IJCRR - 13(18), September, 2021
Pages: 59-63
Date of Publication: 26-Sep-2021
Print Article
Download XML Download PDF
Correlation between Placental Morphometric Parameters and Birth Weight of Neonates
Author: John K Martin, Sreedharan Ranjith, Sampson Ursula
Category: Healthcare
Abstract:Introduction: The placenta is a single organ and a vital regulator for fetal development and birth weight. The morphometry of the placenta helps to understand the antepartum and postnatal health of the neonates. Objective: To assess the placental morphometry of low and normal birth weight neonates and their correlation with birth weight. Materials and Methods: The present study was an institutional case-control study conducted at MES Medical College, Per�in Thalmann, Kerala, India. New-borns with normal (≥2500 g) and low birth weight (< 2500 g.) born at 34 \? 42 weeks were included in the study. The study included 350 subjects whose placentae were collected immediately after delivery for morphometric analysis. Neonatal birth weight and placental morphometry were analysed, and the fetoplacental ratio and placental coefficient were calculated. Result: The present study indicates that all the placental morphometric parameters in low birth weight are significantly lower than those of the normal birth weight neonates. Moreover, there is a positive and significant correlation between the placental morphometric parameters and the birth weight of neonates. Conclusion: Placental morphometric parameters are directly related to birth weight. It may be useful in predicting the postnatal health status of the baby and early adulthood diseases.
Keywords: LBW, NBW, Neonates, Placental morphometry, Fetoplacental ratio, Placental coefficient
Full Text:
Introduction
The placenta, a transient extracorporeal organ, unites the developing fetus to the wall of the uterus. It is a single dynamic organ derived from two separate individuals, the mother and the fetus. The placenta is the prime regulator for the organs, including the lungs, liver, gut, kidneys and endocrine glands of the fetus necessary to fetal development.1 According to Kinare et al., fetal growth and birth weight are related to placental development.2 Low birth weight (LBW) is defined as the birth weight of live-born infants below 2500 g irrespective of gestational age.3 Yearly more than 20 million low birth weight neonates are born worldwide, which accounts for 15 to 20% of all births.4 The prevalence of LBW ranges from 7.2% in developed nations to 17.3% in undeveloped countries. In Asia itself, the prevalence is 5.6% in central Asia and 27.2 % in southern Asia.5 In India, the prevalence of LBW has significantly declined from 20.4% to 16.4% in the last decade.6 In 2012, the World Health Assembly (WHA) endorsed a Comprehensive Implementation Plan on Maternal, Infant and Young Child Nutrition, which specified six global nutrition targets, including an ambitious 30% reduction in LBW prevalence between 2012 and 2025 hoping to reduce 20 million to about 14 million.7
Normal growth of the fetus is mainly reliant on normal placental function, normal morphometry, and normal structure of the placenta.8 Morphometric parameters of the placenta were significantly affected by low birth weight deliveries.9 LBW babies have a higher probability of dying within the first month of life or are connected with adverse health outcomes like stunted growth.10
The morphological parameters such as placental weight, volume, thickness, surface area, number of cotyledons, fetoplacental ratio, and placental coefficient give an idea about intrauterine and intrapartum events of gestation and help to understand the postnatal health of the neonates.11 Placental morphometry has been considered as an indicator of its growth and function. The placental weight which reflects the development and function of the placenta, correlate with birth weight, maternal age, and history of pregnancy complications, parity, gender, and fetal distress.12 Placental volume varies according to fetal weight; the observed values were compared with the expected values (50th percentile) for the appropriate fetal weight.13 Goldy et al. reported a significant positive correlation between placental thickness and estimated fetal weight.14 The placental surface area at term was positively correlated with the weight of a baby at the time of birth.15
Fetoplacental ratio (F/P ratio) was introduced as a predictor of perinatal outcome.16,17 A relationship has been reported between a low F/ P ratio and the risk of adult cardiovascular diseases.18 The altered growth of the placenta will give valuable information about the state of the fetal well-being, and examination of the placental morphology could be a predictor of adult-onset diseases. There are meagre studies on placental morphometry in the northern part of Kerala, which differs in ethnicity, socioeconomic status, maternal education, and cultural practices. Hence, this study on placental morphometric parameters and their correlation with the birth weight of neonates was undertaken.
Materials and methods
A case-control study was conducted in the Department of Anatomy, MES Medical College, Perinthalmanna. The subjects for the study were recruited from the Obstetrics & Gynaecology department of the same medical college. Placentae were collected from 350 births (Low Birth Weight N=175 and Normal Birth Weight, N=175) that occurred from December 2014 to November 2017. Permission for the study was taken from the Institutional Ethics Committee (IEC/MES/75/ 2014). Written consent was obtained from mothers. The data regarding the demographic and clinical parameters of the mothers and their offspring were recorded.
Inclusion criteria
Cases: – Low Birth Weight (LBW).
Neonates with birth weight <2500 g. (34 weeks to 42 weeks of gestation)
Controls: - Normal Birth Weight (NBW).
Neonates with birth weight ≥ 2500 g. (34 weeks to 42 weeks of gestation)
Mothers aged between 18-35 years, singleton neonates delivered either by vaginal route or caesarean section.
Exclusion criteria: Subjects with gestational diabetes mellitus (GDM), hypertensive disorders, congenital anomalies, and intrauterine death were excluded.
Study parameters
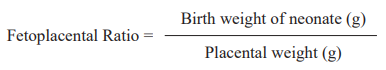
Newborn birth weight was taken within the first hour of birth using a digital weighing scale recorded to the nearest 10 g. The collected placenta was immediately squeezed to evacuate the blood and washed under running tap water. The placental membrane was trimmed off and wiped to drain excess fluid and maternal blood. The placenta was weighed after cutting the umbilical cord at 5cm from its site of insertion. The weight of the placenta was measured by using a sensitive digital baby weighing scale. The volume of the placenta was determined by using the water displacement method19. The surface area was calculated by taking the mean value of the shortest and longest diameter of the placenta. Surface area = π x dl x ds / 4 (π = 3.14, dl is the - long diameter of the placenta, ds – short diameter of placenta). Placental thickness was measured by inserting a needle 2cm away from the margin and 1cm from the centre, respectively. The total number of placental cotyledons were counted and recorded. Counting of cotyledons was started from the left side of one end of the placenta and then going to the right side and again turning back to the left in a loop. The fetoplacental ratio was calculated using the formula:
 Birth weight of neonate (g)
Fetoplacental Ratio =
Placental weight (g)
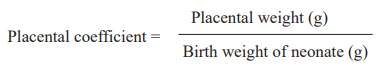
The placental coefficient was calculated by using the formula.
The placental coefficient was calculated by using the formula.
The parameters among the groups were compared using the student`s t’ test. Pearson correlation was used to correlate placental morphometry with birth weight. Linear regression analysis was carried out to estimate birth weight using placental morphometry. Analysis of data was carried out using SPSS v.21.
Results
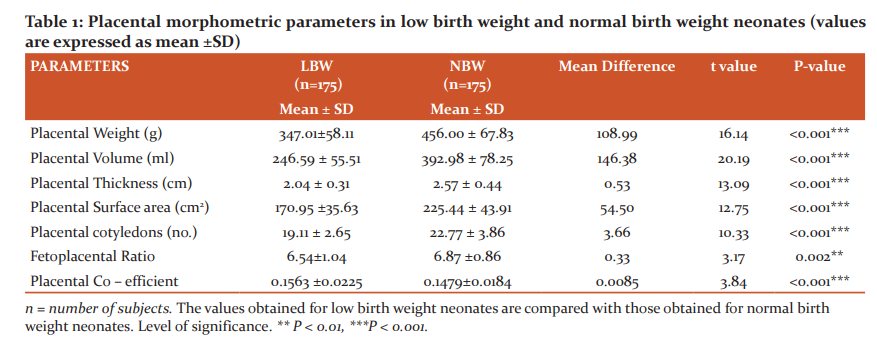
The results expressed in Table 1 showed that placental morphometric parameters were significantly lower in LBW neonates when compared to NBW neonates. Placental weight was 347.01± 58.11g. in LBW and 456.00 ± 67.83g in NBW (P<0.001). Placental volume was 246.59 ±55.51 ml. in LBW and392.98 ± 78.25 ml. in NBW (P<0.001). Placental thickness was2.04 ± 0.31ml. in LBW and (2.57 ± 0.44) in NBW neonates (P<0.001). The placental surface area of LBW was 170.95 ±35.63cm2 and of NBW was 225.44 ± 43.91cm2 (P<0.001). The number of placental cotyledons in LBW was 19.11 ± 2.65 and in NBW was 22.77 ± 3.86 (P<0.001). The fetoplacental ratio in LBW was 6.54±1.04 and in NBW was 6.87 ±0.86 (P=0.002). The Placental coefficient in LBW was 0.1563 ± 0.0225 and in NBW was 0.1479±0.0184 (P<0.001).
The result expressed in Table 2 showed positive correlation with all parameters such as placental weight (r=0.779), volume (r=0.766), thickness (r=0.652), surface area (r=0.615), and number of cotyledons (r=0.598). This result showed that the placental weight, volume, thickness, surface area and number of cotyledons increases with birth weight of neonates.
The results expressed in table 3 shows the linear regression analysis of placental morphometric parameters (placental weight, volume, thickness, and surface area) with an R2 value of 0.69 can predict the birth weight of neonates.
Discussion
Birth weight is a result of multiple factors like maternal nutrition, endocrine factors, maternal metabolism, placental insufficiency, genetic expression, ethnic and geographical variations. As the placenta and fetus share the same intrauterine environment, maternal diseases and nutritional deficiency limit the growth of both. In the present study, all the placental morphometric parameters in low birth weight are significantly lower than those of the normal birth weight neonates. Moreover, placental weight20, volume21, thickness22, surface area, and the number of cotyledons23 showed a positive correlation with the birth weight of neonates. Studies showed that low birth weight was associated with lower placental weight and volume. A reduction in the placental thickness affects the functional efficiency that results in smaller neonates.24,25 Placental thickness may reflect the vascularization and branching of the chorionic villi and is the main dimension of placental growth during the third trimester.26, 27 Freedman et al. stated that the surface area had more influence on the birth weight of the neonates.25 Sirpurkar et al. showed that the placental surface area and the number of cotyledons are associated with birth weight.28 The surface area of the placenta increases with a placental weight according to the growth of the fetal villi.1 The surface area of the chorionic plate is mostly established before the third trimester and may reflect the number of spiral arteries supplying the placenta.26,27,29 The placental co-efficient falls as the placental weight increases and a high placental co-efficient is seen if the placental weight decreases. Placental co-efficient outside the normal range (0.10 to 0.18) is shown to be associated with perinatal effects.30 We conducted a secondary analysis using linear regression to evaluate the placental variables associated with birth weight. Linear regression analysis showed that placental morphometric parameters (placental weight, volume, thickness, and surface area) can predict the birth weight of neonates. The present study concludes that the development of the placenta and that of the fetus are causally related. Moreover, the observation of reduced values of placental morphometric parameters in low birth weight is a direct indication of the influence of the placenta on antenatal growth in utero.
Conclusion
The present postnatal morphometric studies of the placenta allow helping in finding neonates who suffer undetected growth restriction and should be monitored more closely during postnatal care. Placental morphometric parameters and their range differ from place to place due to the influence of factors like the environment, maternal nutrition, genetic expression, ethnicity, and geographical variations. However, the present information may assist in assessing progress towards the achievement of the global nutrition targets by 2025.
Acknowledgement
The authors are thankful to all the individuals who donated their prints for the study. We are incredibly grateful to the OBG department of MES Medical College for allowing us access to individuals used in the study. We also express our deepest gratitude to all authors of all those articles, journals, and books from where the literature for this article has been reviewed and discussed.
Source of Funding- None
Conflict of Interest - There are no conflicts of interest.
Ethical Clearance Letter No. IEC/MES/75/ 2014
Authors’ Contribution
Author 1- Carried out the experiment.
Author 2 and Author 3- Conceived and designed the study.
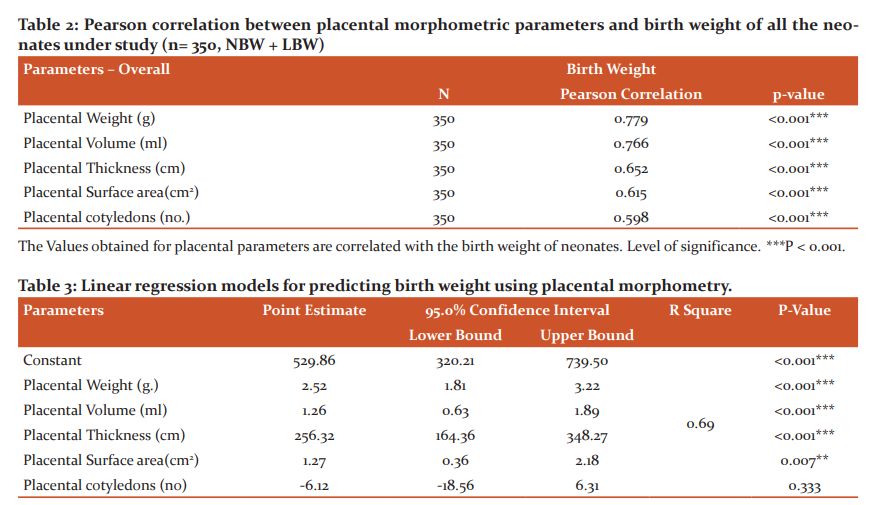
The placental measurements (Placental weight, volume, thickness and surface area) were considered together as a predictor of birth weight with confidence interval 95%; significance at < 0.001 level.
Regression Equation: -
Birth Weight = 529.86 + [2.52xPlacental Weight (g)] + [1.26xPlacental
Volume (ml)] + [256.32xPlacental Thickness (cm)] + [1.27xPlacental Surface
area (cm2)]– [6.12 x Placental cotyledons (number)].
References:
-
Burton GJ, Fowden AL. The placenta: A multifaceted, transient organ. Philosophical Transactions of the Royal Society B: Bio Sci. 2015, March 5; 370 (1663):20140066.
-
Kinare AS, Natekar AS, Chinchwadkar MC, Yajnik CS, Coyaji KJ, Fall CH et al. How mid-pregnancy placental volume in rural Indian women: A cause for low birth weight? Am J Obstet Gynecol. 2000, Feb 1; 182 (2):443-8.
-
Shrestha S, Shrestha S, Shakya Shrestha U, Gyawali K. Predictors of Low Birth Weight at Lumbini Provincial Hospital, Nepal: A Hospital-Based Unmatched Case-Control Study. Adv Prev Med. 2020, Mar 26; 2020 (8459694): 1-7
-
Bekela MB, Shimbre MS, Gebabo TF, Geta MB, Tonga AT, Zeleke EA et al. Determinants of Low Birth Weight among Newborns Delivered at Public Hospitals in Sidama Zone, South Ethiopia: Unmatched Case-Control Study. J Pregnancy. 2020, Apr 16; 2020 (4675701): 1-8
-
Talie A, Taddele M, Alemayehu M. Magnitude of low birth weight and associated factors among newborns delivered in Dangla primary hospital, Amhara regional state, Northwest Ethiopia, 2017. J Pregnancy. 2019; 35(8): 1-6
-
Khan N, Mozumdar A, Kaur S. Determinants of low birth weight in India: An investigation from the national family health survey. Am J Hum Biol. 2020 May;32(3):e23355.
-
World Health Organization. Global Nutrition Targets 2025: Low birth weight policy brief (No. WHO/NMH/NHD/14.5). World Health Organization; 2014.
-
Salavati N, Smies M, Ganzevoort W, Charles AK, Erwich JJ, Plösch T et al. The possible role of placental morphometry in the detection of fetal growth restriction. Front Physiol. 2019 Jan 8; 9:1884.
-
Sunkesula SB, Lingeswara RB, Tamil AD. Low birth weight lives births: An insight into placental pathology. J Evol Med Dent Sci. 2015 Feb 23;4(16):2645-52.
-
Scharf RJ, Stroustrup A, Conaway MR, DeBoer MD. Growth and development in children born very low birthweight. Arch Dis Child Fetal Neonatal Ed.2016 Sep.1;101 (5):433-38.
-
Kowsalya V, Vijayakumar R, Valli G, Bharath KP, Srikumar R, Kishor Kumar C et al. Morphometry examination of the placenta in birth weight of full-term newborns in
Puducherry, India. Pakistan J Biol Sci. 2013 Sep 1; 16: 895-97.
-
Asgharnia M, Esmailpour N, Poorghorban M, Atrkar-Roshan Z. Placental weight and its association with maternal and neonatal characteristics. Acta Medica Iranica2008; 46(6): 467-72.
-
Abulé RM, Bernardes LS, Doro GF, Miyadahira S, Francisco RP. Reduced placental
volume and flow in severe growth-restricted fetuses. Clinics. 2016 Jun; 71(6):332-7.
-
Goldy SJ, Victor SR, Bewin Oral J, Thangam A, Christopher U, Rose A et al. Placentalthickness and its correlation with estimated foetal weight: a cross-sectional study in a tertiary care centre in South India. Int J Reprod Contracept Obstet Gyneco 2019;8(4):1348.
-
Sivarao S, Vidyadaran MK, Jammal AB, Zainab S, Goh YM, Ramesh KN et al. Weight, volume and surface area of placenta of normal pregnant women and their relation to maternal and neonatal parameters in Malay, Chinese and Indian ethnic groups. Placenta. 2002 Sep 1;23 (8-9):691-6.
-
Itoh H, Kanayama N. Nutritional conditions in early life and risk of non-communicable diseases (NCDs) from the perspective of preemptive medicine in perinatal care. Hypertension Res Preg. 2015 Apr 30; 3(1):1-2.
-
Matsuda Y, Itoh T, Itoh H, Ogawa M, Sasaki K, Kanayama N, Matsubara S et al. Impact of placental weight and fetal/placental weight ratio Z score on fetal growth and the perinatal outcome. Int J Med Sci. 2018; 15 (5):484-91
-
Shehata F, Levin I, Shrim A, Ata B, Weisz B, Gamzu R, Almog B et al. Placenta/birthweight ratio and perinatal outcome: A retrospective cohort analysis. Bri J. 2011 May; 118 (6):741-47.
-
Scherle W. A simple method for volumetry of organs in quantitative stereology. Mikroskopie.1970; 26:57- 60
-
Balihalimath RL, Shinde V, Tyagi N, Patil AS. Maternal anthropometry determines pregnancy outcome. J Evol Med Dent Sci. 2015 Jul 6;4(54):9347-58.
-
Kishwara S, Ara S, Rayhan KA, Begum M. Morphological changes of placenta in preeclampsia. Bangladesh J of Anat. 2009;7 (1):49-54.
-
Ghodke S, Dharwadkar S. Hypertensive disorders affecting the morphometry of placenta. Journal of Scientific Society. 2012; 39: 17-8.
-
Virupaxi RD, Potturi BR, Shirol VS. Morphology of placenta and its relation with small for date babies in 950 Live births. Recent res sci technol. 2011 Apr 13; 3 (2). 123-6
-
Thompson J, Irgens L, Skjaerven R, Rasmussen S. Placenta weight percentile curves for singleton deliveries. BJOG 2007; 114(6): 715-20.
-
Freedman AA, Hogue CJ, Marsit CJ, Rajakumar A, Smith AK, Goldenberg RL, et al. Associations Between the Features of Gross Placental Morphology and Birthweight. Pediatr Dev Pathol 2018; 22(3): 194-204.
-
Salafia CM, Maas E, Thorp JM. Measures of placental growth in relation to birth weight and gestational age. Am J Epidemiol. 2005;162:991–8
-
Barker DJP, Eriksson JG, Kajantie E. Chapter 2: The maternal and placental origins of chronic disease In: Burton GJ, Barker DJP Moffet A, et al. (Eds.) The Placenta and Human Developmental Programming. Cambridge, England: Cambridge University Press; 2011: pp. 5–12.
-
Sirpurkar M, Anjankar VP. Study of correlation between placental morphology and adverse perinatal outcome in different conditions affecting pregnancy. Int J Reprod Contracept Obstet Gynecol. 2015;4 (4):1166-68
-
Salafia CM, Zhang J, Charles AK. Placental characteristics and birthweight. Paediatr Perinat Epidemiol. 2008;22: 229–39.
-
Little WA. Placental infarction. Obstet Gynecol. 1960 Feb 1;15(2):109-30.
|
 IJCRR
IJCRR 


 This work is licensed under a Creative Commons Attribution-NonCommercial 4.0 International License


