IJCRR - 13(8), April, 2021
Pages: 10-15
Date of Publication: 25-Apr-2021
Print Article
Download XML Download PDF
Detection of Non-Proliferative Diabetic Retinopathy from Digital Fundus Images
Author: Parashuram Bannigidad, Asmita Deshpande
Category: Healthcare
Abstract:Introduction: The human eye is the most often affected by Diabetes. It deteriorates the functioning of the retina. Diabetic Retin�opathy, Glaucoma, Macular Edema are some of the commonly found ophthalmic disorders among diabetic people. Microaneu�rysms are the earliest symptoms of Diabetic Retinopathy. If these symptoms are detected and treated in the early stages, then they can avoid vision loss among patients. Objective: The main objective of this research work is to detect microaneurysms present on the surface of the retina that char�acterizes Non-Proliferative Diabetic Retinopathy. Methods: The algorithm proposed in this paper is based on morphological operations eliminating blood vessels and the optic disc, followed by the detection of Microaneurysms. Grey level Co-occurrence Matrix(GLCM) and Histogram of Oriented (HOG) features are extracted to identify the Microaneurysms, and various classifiers are tested. HOG features are useful in finding the regions affected in a retinal image as they compute the histogram of gradients that can facilitate tasks such as classification, detection, and recognition. Various classifiers are tested on public fundus databases with the proposed method. Results: For the STARE Database, the Decision tree classifier yielded values for accuracy 0.95, recall 0.9, and precision 1.0. Similarly, accuracy 0.91, recall 0.94, and precision 0.92 were computed for the thee-Ophtha database and accuracy 1.0, recall 0.94, and precision 1.0 for the DIARETDB1 database. Conclusion: From experimentation, it was observed that the decision tree classifier and HOG features yield the best results for detection of Non-Proliferative Diabetic Retinopathy(NPDR) from most of the public fundus databases. The encouraging values computed for performance evaluation testify to the efficiency and robustness of the proposed method.
Keywords: Microaneurysms, Digital fundus images, Optic disc, GLCM features, Decision tree classifier, Diabetic Retinopathy, HOG features
Full Text:
Introduction
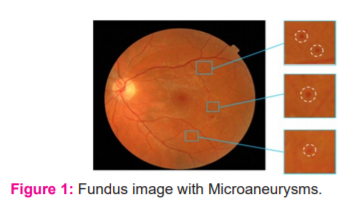
Human beings in different age groups are commonly affected by a lifestyle disorder known as Diabetes. It deteriorates the working of numerous organs, particularly the functioning of the human eye and retina. Diabetic patients suffer from several retinal complications such as Diabetic Retinopathy, Glaucoma, Macular Edema and others. Nowadays, Ophthalmologists use a non-mydriatic fundus camera to check the presence of these diseases. The interior portion of the eye can be examined with the help of a fundus camera. It gives a view of the fovea, optic disc, macula, and retina. High levels of blood sugar can damage the retina leading to loss of vision. Microaneurysms are the first signs of Non-Proliferative Diabetic Retinopathy (NPDR). They appear as tiny red dots caused by swellings of the capillaries. They are localized capillary dilatations, which are often present in clusters. A fundus image with Microaneurysms is shown in Figure 1.
Many researchers have worked on fundus images to explore image processing techniques for the detection of Microaneurysms. Quereshi et al.1 have reviewed significant CAD systems developed using digital image processing techniques. They also describe the limitations and future trends of CAD systems to aid the researchers in working with Diabetic Retinopathy. Malay Kishore Dutta et al.2 have worked on a region-based approach for the detection and grading of Diabetic Retinopathy. Istvan Lazar and Andras Hajdu3 explored the possibility of detection of Microaneurysms by analyzing directional cross-section profiles centred on the local maximum pixels of the preprocessed image. Sreng et al.4 have used image enhancement techniques and 2D wavelet transformation for the detection of Microaneurysms. Ren et al.5 have applied Top-hat transformation on the green channel to separate the Microaneurysms from the vasculature along with Gaussian filtering. Hipwell et al.6 have extracted candidate Microaneurysms by applying algorithms that highlight small circular features. Rosas-Romero et al.7 implemented normalization of fundus images with its statistical properties and morphological operations for candidate extraction. Khojasteh et al.8 used convolution neural for automated detection of Microaneurysms. Manjaramkar and Kokare9 distinguished between MA and Non-MAs regions by exploring the statistics of geometrical properties in connected regions. Li. et al.1 presented a cross-disease attention network (CANet) for grading Diabetic Retinopathy and macular oedema. They explored image-level supervision to find the relationship between the diseases. They developed an attention module that can select useful features for specific diseases and the further captured relationship between the two diseases using a disease-dependent attention module. Bannigidad and Deshpande17 implemented a multistage approach for exudates detection in fundus images that consolidates morphological operations and thresholding. The objective of this paper is to detect Microaneurysms using morphological operations and thresholding and explore GLCM and HOG features along with various machine learning algorithms.
Materials and Methods
This experiment is implemented using fundus images from STARE11, e-Ophtha12, and DIARETDB113 databases. These databases are free and are made available for research purposes. STARE database consists of 20 digital fundus images and 20 ground truth images, which can be used for evaluating different vessel segmentation algorithms. These images have been captured by a TopCon TRV-50 camera having 700 × 605 pixel resolution. e-Ophtha is another database containing fundus images specially established so that research work in Diabetic Retinopathy can be undertaken. It consists of 148 images with Microaneurysms and 233 images having no lesions. Image sizes are in the range of 1440×960 pixels to 2544×1696 pixels. The DIARETDB1 data set contains a total of 89 fundus images captured with a 50-degree field-of-view. Among them, 84 contain signs of Diabetic Retinopathy and 5 do not contain any Microaneurysms.
Proposed method
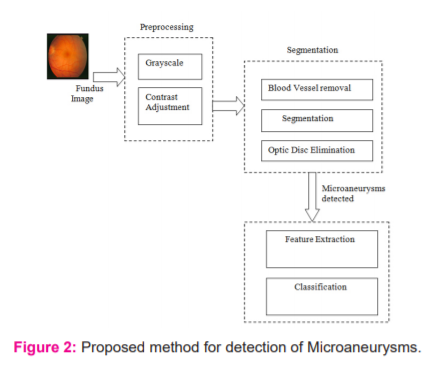
Microaneurysms present in a retinal image is detected by a multi-stage approach in the proposed method. The multistage process proceeds by initially performing preprocessing, followed by segmentation, optic disc elimination, and Microaneurysms detection. This is aided by the feature extraction process and classification. The different stages in the proposed method are presented in Figure 2
Preprocessing
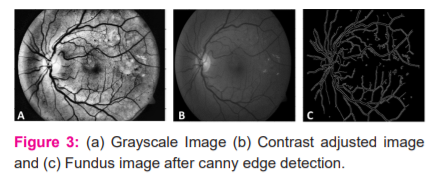
Preprocessing is an essential step in fundus images because lesions and exudates have almost the same intensity values as the remaining normal components of the retina. It is essential to highlight smaller details like red dots that indicate Microaneurysms, Yellow regions, indicating exudates and haemorrhages to detect the presence of Diabetic Retinopathy. Most fundus images suffer from illumination differences due to the type of camera used, the field of view used to capture the fundus image, and lighting. Initially, the original fundus images from all databases are resized to a standard size of 576 X 720, followed by the extraction of the green channel. This facilitates the detection of Microaneurysms to a large extent. This image is then converted into grayscale16. The contrast of the grayscale image is enhanced using Contrast Limited Adaptive Histogram Equalization (CLAHE). It transforms the intensity values to higher intensities to increase the contrast. The grayscale image is depicted in Figure 3A and the fundus image after contrast adjustment is shown in Figure 3B.
Canny edge detection14 is further applied to the fundus image to highlight the edges. The circular border of the fundus image is masked and eliminated, as shown in Figure 3C. Next, a binarized image is obtained by setting a threshold value.
Blood Vessel Removal
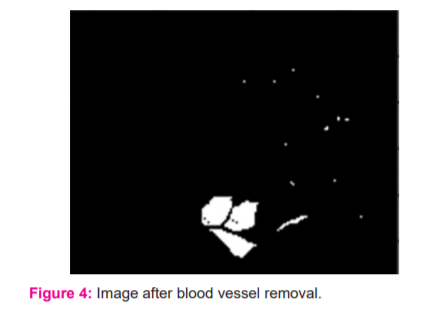
A network of blood vessels is prominently present in the retina. Identification and elimination of the complete vasculature are essential to accurately identify candidates15 Microaneurysms from the digital fundus images. Morphological operations14are implemented to detect the blood vessel network and eliminate them from the fundus image.
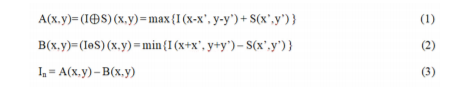
where I(x,y) is the image obtained after preprocessing, and S(x’,y’) is the structuring element. The image thus obtained is shown in Figure 4.
Segmentation
Ophthalmologists identify Microaneurysms as tiny dots that are red and have a diameter ranging between 25 to 100 µm. Segmenting the candidates correctly is a challenging task due to their tiny size. Segmentation techniques such as circular Hough transform don’t work well due to the small size. An important characteristic of the retinal image is that there are disparities in intensity and texture. Thus, a local thresholding based segmentation technique proposed and used in this experiment. Column wise neighbourhood operation is performed on In and the fixed threshold (T) is applied to filter the Microaneurysms.
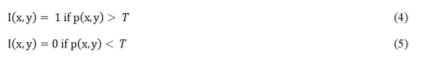
where, T = 0.7. An important task at this stage is to identify and eliminate the optic disc which a natural anatomical circular structure that is present on the retina. Optic Disc identification is a challenging task in the processing of fundus images because the exact location of the optic disk is not known. It may be present at the left, right or centre of the retina. In the segmented image, the largest connected component is computed to locate the optic disc. The equation of a circle is used to compute a circular mask for eliminating the optic disc.
where x, y, mc, mr are mesh grid vectors and medians of a row and column coordinates respectively. The optic disc is eliminated by subtracting the mask(M) from the segmented image as follows:

Next, the outer border is eliminated to obtain image Inc and morphological closing operation is applied to detect the Microaneurysms accurately.

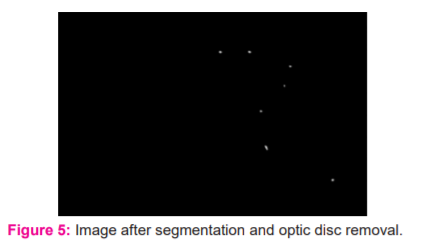
Further, contrast enhancement is applied using CLAHE so that the affected regions are highlighted. This is followed by an AND operation on ?(Ima) and ψ(Ima). ?(Ima) complements the image and ψ(Ima) inverts the fundus image to highlight the microaneurysms. Figure 5 shows the fundus image obtained after the segmentation of Microaneurysms.

The algorithm for the proposed method is described below:
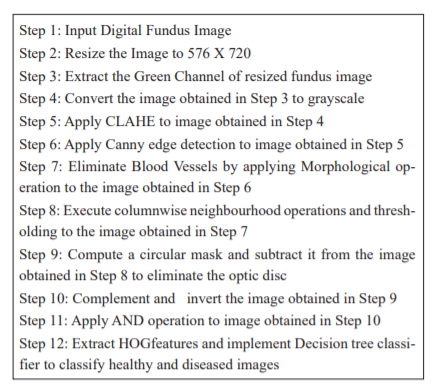
This algorithm explores Gray Level Co-occurrence Matrix (GLCM) and Histogram of Oriented Gradients (HOG) features for classification. GLCM is a method to statistically determine the spatial relationship of pixels. It also calculates how often certain specific values occur in the image. HOG is commonly used to detect objects and plays a vital role in computer vision. HOG features are obtained by dividing the image into regions, and for each region, gradients and orientations are computed. The feature descriptor for HOG highlights the structure or shape of an object18. In this experiment, various classifiers such as the Support Vector Machine (SVM) classifier, k-Nearest Neighbour (k-NN) classifier, and Decision tree classifiers have been tested. It was found that the Decision tree classifier yields the best results of classification for the proposed method. Decision tree classification is based on tree representation wherein every leaf node represents a class label, and the internal nodes represent attributes.
Experimental Results and Discussions
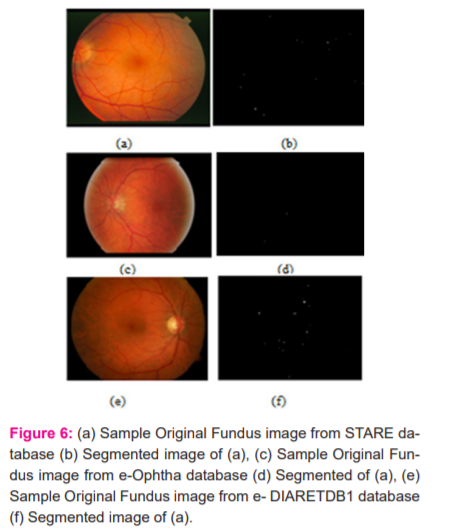
The proposed algorithm was executed on public fundus databases viz, STARE, e-Ophtha, and DIARETDB1 and implemented using MATLAB R2015b. These are freely available databases designed to facilitate research in the detection of retinal disorders. In all, 20 images from the STARE database, 381 images from thee-Ophtha database, and 89 images from DIARETDB1 have been tested in the experiment. Sample digital fundus images from STARE, DIARETDB1 and e-Ophtha are shown in Figure 6a, 6c and 6e and their corresponding segmented images using the proposed method are depicted in Figure 6b, 6d and 6f respectively.
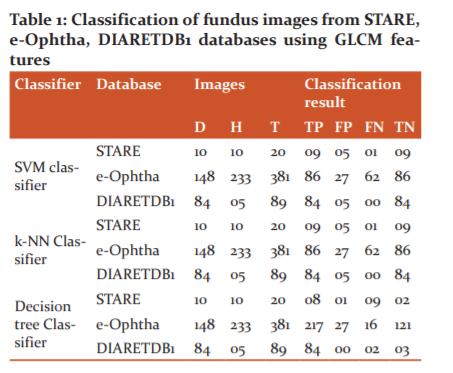
The classification of fundus images from STARE, e-Ophtha, and DIARETDB1 databases using GLCM features with various classifiers is shown in Table 1.
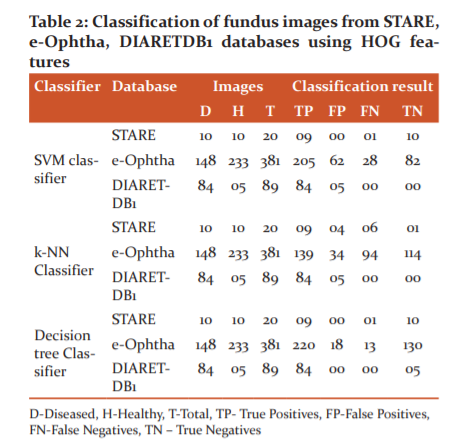
The classification of fundus images from STARE, e-Ophtha, and DIARETDB1 databases using HOG features with various classifiers is shown in Table 2.
The performance of the proposed method is evaluated on the basis various evaluation measures [16] as follows:

Accuracy: Classification accuracy relates to the number of correctly identifies images, either healthy or diseased from a given set of images.

Recall: The ability of a classifier to find all positive images correctly is known as Recall. The recall is defined as:

Precision: In Information retrieval systems precision is the fraction of relevant instances of images classified among the retrieved instances.
The comparison of results based on the test parameters using GLCM features on STARE, e-Ophtha, and DIARETDB1 databases are given in Table 3.
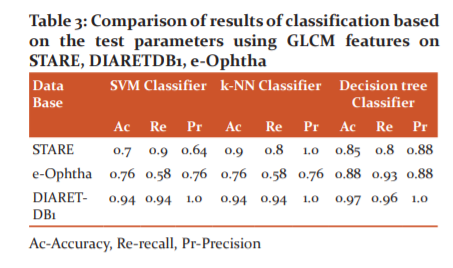
For the STARE database, the SVM classifier yielded values 0.7 for accuracy, 0.9 for recall, and 0.64 for precision. Similarly, accuracy 0.76, recall 0.58, and precision 0.76 were computed for e-Ophtha database and accuracy 0.94, recall 0.94, and precision 1.0 for DIARETDB1 database. When the proposed method was tested with a k-NN classifier, for the STARE database, the yielded values were 0.9 for accuracy, 0.8 for recall, and 1.0 for precision. Similarly, accuracy 0.76, recall 0.58, and precision 0.76 were computed for the e-Ophtha database and accuracy 0.94, recall 0.94, and precision 1.0 for the DIARETDB1 database. The decision tree classifier for the STARE database yielded values for accuracy 0.85, recall 0.8, and precision 0.88. Similarly, accuracy 0.88, recall 0.93, and precision 0.88 were computed for e-Ophtha database and accuracy 0.97, recall 0.96, and precision 1.0 for DIARETDB1 database. Also, the comparison of results based on the test parameters on the STARE database, e-Ophtha database, and DIARETDB1 database using HOG features are given in Table 4.
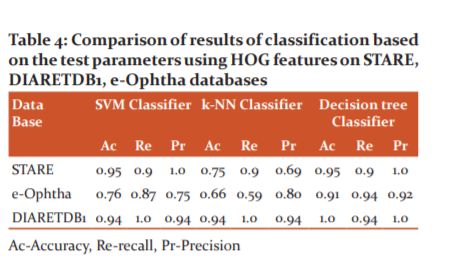
For the STARE database, the SVM classifier yielded values 0.95 for accuracy, 0.90 for recall, and 1.0 for precision. Similarly, accuracy 0.76, recall 0.87, and precision 0.75 were computed for the thee-Ophtha database and accuracy 0.94, recall 1.0, and precision 0.94 for the DIARETDB1 database. When the proposed method was tested with a k-NN classifier, for the STARE database, the yielded values were 0.75 for accuracy, 0.9 for recall, and 0.69 for precision. Similarly, accuracy 0.66, recall 0.59, and precision 0.80 were computed for e-Ophtha database and accuracy 0.94, recall 1.0, and precision 0.94 for DIARETDB1 database. The decision tree classifier yielded values for accuracy 0.95, recall 0.9, and precision 1.0 for the STARE database. Similarly, accuracy 0.91, recall 0.94 and precision 0.92 were computed for the thee-Ophtha database and accuracy 1.0, recall 0.94 and precision 1.0 for the DIARETDB1 database.
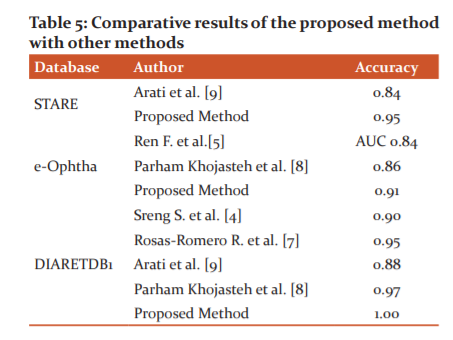
The comparative results of the proposed method using HOG features with other methods suggested by various researchers are given in Table 5.
Conclusion
This paper reports a method based on morphological operations and thresholding for the detection of Microaneurysms in fundus images. The proposed algorithm consolidates morphological operations for the elimination of the vasculature present in the retina, removal of the optic disc and accurate detection of Microaneurysms. The proposed technique extracts HOG features and proposes the use of a decision tree classifier as it yields better results of classification on all the databases tested in this experiment. The Decision tree classifier yielded values for accuracy 0.95, recall 0.9, and precision 1.0 for the STARE database. Similarly, accuracy 0.91, recall 0.94, and precision 0.92 were computed for the e-Ophtha database and accuracy 1.0, recall 0.94, and precision 1.0 for the DIARETDB1 database. The encouraging values reported in this paper based on measures of performance evaluation testify to the efficiency of the proposed method.
Acknowledgements: The authors wish to acknowledge developers of STARE, e-Ophtha, and DIARETDB1 databases for facilitating the research fraternity with fundus datasets publicly and freely. The authors acknowledge the immense help received from the scholars whose articles are cited and included in references of this manuscript. The authors are also grateful to authors/editors/publishers of all those articles, journals and books from where the literature for this article has been reviewed and discussed.
Conflict of interest: Nil
Source of funding: Nil
References:
-
Quereshi I, Ma J, Abbas Q. Recent Development on Detection Methods for the Diagnosis of Diabetic Retinopathy. Symmetry 2019;11(6): 1-34.
-
Dutta MK, Parthasarathi M, Ganguly S, Ganguly S, Srivastava K. An efficient image processing based technique for comprehensive detection and grading of non-proliferative diabetic retinopathy from fundus image,. Comp Meth Biomech Biomed Engi Imaging Visualiz 2015;5(3):1-13.
-
Wu B, Zhu W, Shi F, Zhu S, Chen X. Automatic detection of microaneurysms in retinal fundus images. Comp Med Imag Graph 2017;55:106–112.
-
Sreng S. Maneerat N. Hamamoto, K. Automated microaneurysms detection in fundus images using image segmentation. In Proceedings of the International Conference on Digital Arts, Media and Technology (ICDAMT), Chiang Mai, Thailand. 2017; 19–23.
-
Ren F, Cao P, Li W, Zhao D, Zaiane O. Ensemble-based adaptive over-sampling method for imbalanced data learning in computer-aided detection of microaneurysm. Comp Med Imag Graph 2017; 55:54–67.
-
Hipwell JH, Starchant F, Olson JA, McHardy KC, Sharp PF, Forester JV. Automated detection of microaneurysms in digital red free photographs: a diabetic retinopathy screening tool. Diab Med 2000;13:588-594.
-
Rosas-Romero R, Martínez-Carballido J, Hernández-Capistrán J, Uribe-Valencia LJ. A method to assist in the diagnosis of early diabetic retinopathy Image processing applied to the detection of Microaneurysms in fundus images. Comp Med Imag Graph 2015;44:41–53.
-
Khojasteh P, Aliahmad B, Kumar DK. Fundus images analysis using deep features for detection of exudates, haemorrhages and Microaneurysms. BMC Opthalmology 2018;18:1-13.
-
Manjaramkar A, Kokare M. Statistical Geometrical Features for Microaneurysm Detection. J Digit Imag 2018;31(2):224-234.
-
Li X, Hu X, Yu L, Zhu L, Fu C, Heng P. CANet: Cross-disease Attention Network for Joint Diabetic Retinopathy and Diabetic Macular Edema Grading," in IEEE Transactions on Medical Imaging. 2019; 1-12.
-
Dataset STARE: Obtained from A. Hoover, STARE database[Online],http://cecas.clemson.edu/~ahoover/stare/
-
Decencière E, Cazuguel G, Zhang X, Thibault G, Klein JC, Mayer B, et al. TeleOphta: Machine learning and image processing methods for teleophthalmology. IRBM 2013);9:196-203.
-
Dataset DIARETDB1: Obtained from the website:http://www.it.lut.fi/project/imageret/diaretdb1/
-
Gonzalez RC, Richard E. Woods. Dig Image Processing, 3rd Edition, 2014.
-
Bannigidad P, Deshpande A. Exudates Detection from Digital Fundus Images using GLCM features and Decision tree classifier, Edited K.C. Santosh and Ravindra S. Hegadi, Recent trends in Image Processing. Springer, 2019;1036: 245-257.
-
Bannigidad P, Deshpande A. An automated method for Optic Disc detection and elimination in digital fundus images, Int J Recent Tech Engi 2019;8(4): 12559-12563.
-
Bannigidad P, Deshpande A. A Multistage Approach for Exudates Detection in Fundus Images using Texture Features and k-NN classifier. Int J Adv Res Comp Sci 2018;9(1):1-5.
-
Bannigidad P, Deshpande A. Detection and Classification of Diabetic Retinopathy using Histogram of Oriented Gradients and Decision Tree Classifier. Int J Adv Sci Tech 2020;29(4):8640 –8648.
|
 IJCRR
IJCRR 


 This work is licensed under a Creative Commons Attribution-NonCommercial 4.0 International License


