IJCRR - 13(6), March, 2021
Pages: 117-123
Date of Publication: 20-Mar-2021
Print Article
Download XML Download PDF
Cross-sectional Study to Assess Serum Insulin Like Growth Factor-1 Levels (IGF-1) in Female and Male Subjects in Relation to Various Stages of Cervical Vertebrae Maturation
Author: Kahlon SS, Aggarwal V, Ahluwalia KS, Narang RS, Singh B, Kahlon M, Chopra S
Category: Healthcare
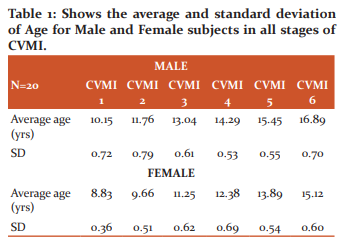
Abstract:Background: Response to orthopaedic treatment modalities is maximum during the peak of the adolescent growth spurt. Objective: To assess serum insulin-like growth factor-1 levels ( IGF-1) in female and male subjects concerning various stages of cervical vertebrae maturation (CVMI). Methods: The study sample consisted of 240 subjects, 120 females and 120 males, in the age range of 8-16 years, who re�ported for orthodontic treatment. Radiographs were assessed for different CVMI stages. After evaluating the X-rays for CVMI stages, subjects were placed into different groups; Group 1-CVMI 1 stage, Group 2- CVMI 2 stage, Group 3- CVMI 3 stage, Group 4- CVMI 4 stage, Group 5- CVMI 5 stage and Group 6- CVMI 6 stage, both for male and female subjects separately. Results: Evaluation of results revealed that the average age of male subjects in CVMI stage 1 was 10.15 years, in CVMI-2 was 11.76 yrs, in CVMI-3 was 13.04 yrs, in CVMI-4 was 14.29, in CVMI-5 was 15.45 and in CVMI-6 was 16.89. The average age of female subjects in CVMI stage 1 was 8.83 years, in CVMI-2 was 9.66 yrs, in CVMI-3 was 11.25 yrs, in CVMI-4 was 12.38, in CVMI-5 was 13.89 and in CVMI-6 was 15.12. Gender was a significant factor associated with the age of attainment of each CVMI stages. Male subjects showed on average delayed attainment of the CVMI stages by about 14 months later as a comparison to females. Conclusion: This study reveals that Serum IGF-1 levels are at peak in CVMI Stage 3 in both males and females. Biomarker�IGF-1 serve as an alternate method for growth assessment which is non invasive to x-ray exposure , simple and gives a quantita�tive value to find pubertal growth peak.
Keywords: Insulin-like growth factor-1 levels (IGF-1), Cervical vertebrae, Maturation, Lateral Ceph
Full Text:
Introduction
While making orthodontics treatment planning the most important objective is to correct skeletal discrepancies by utilising the growth potential of the patient so that the most favourable results could be achieved.1 Response to orthopaedic treatment modalities is maximum during the peak of the adolescent growth spurt. The correct identification of the pre-pubertal and post-pubertal growth phases on an individual is very important in orthodontic diagnosis and treatment planning.2Orthopaedic treatment of patients with Class III malocclusion and rapid maxillary expansion achieve maximum efficacy when performed at a pre-pubertal growth phase. On the other hand, in Class II subjects the amount of supplementary mandibular growth induced by functional appliances appears to be significantly greater when the treatment is performed during the pubertal growth phase. Thus determining the growth potential in both genders is an essential step for orthodontic practitioners.2,3
Different methods have been reported in an attempt to determine the best indicator of maturity. These include height, weight, chronological age, sexual maturation, Frontal sinus, biological age or physiological age, Hand-wrist maturity,4,5 Cervical vertebrae, dental eruption, dental calcification stages and biomarkers.6
Chronological age and dental emergence be poorly related to skeletal maturation. Other methods includeradiographic assessment of skeletal structures like hand wrist radiographs in which appearance and union of different skeletal centresof ossification of bones give growth assessment. In 1972, Lamparski7 introduced a method for assessing cervical vertebral maturation on cephalometric radiographs. Hassel and Farmanmodified the cervical vertebrae and found them as reliable and valid for assessing skeletal age. But despite being reliable these methods are invasive as they give an X-ray exposure to the patient. Moreover, cervical vertebral maturity (CVM) staging though widely used has decreased reproducibility and subjective errors with Intra and inter-observer disagreements.7,8 Furthermore, the onset of the peak in mandibular growth cannot be accurately defined by the CVMI staging.However new possibilities might be provided by biochemical markers, i.e. biomarkers that avoid invasive X-ray exposure and represent agents that are directly involved in bone growth and remodelling.9,10
A biomarker is defined as “any substance, structure, or process that can be measured in the body or its products and influence or predict the incidence of outcome or disease.10 Biomarkers represent agents that are directly involved in bone growth and remodelling and would help the clinicians in assessing the growth status of the orthodontic patient.11 Amongst all biomarkers, IGF-1 is a very important one that varies according to age and sex. The IGFs play important role in the function of almost every organ in the body. IGFs are essential for embryonic development. After birth, however, IGF-I appears to have the predominant role in regulating growth Serum, IGF-1 level is a reliable maturation factor as it quantitively assesses the growth. Therefore the intensity of the growth can be estimated which will help in assessing the exact timings of the treatment. Many variables, such as age, sex, nutritional status, and growth hormone secretion, affect serum IGF-I concentrations. The concentrations are low at birth, increase substantially during childhood and puberty, and begin to decline after puberty.
According to all the literature available to date on biomarkers, Insulin-like growth factor 1 (IGF-1), Insulin-like growth factor Binding Protein-3 (IGF-BP3) and Alkaline phosphatase (ALP) are common substances that have proved to be most reliable in all the studies. The pubertal peak occurs approximately two years earlier in girls than in boys. So separate studies are needed for male and female subjects. This cross-sectional study is to access the serum IGF-1 levels as markers for the evaluation of skeletal growth assessment in different stages of cervical skeletal maturation.
Materials and methods
The study sample consisted of 240 subjects, 120 females and 120 males, in the age range of 8-16 years, who reported for orthodontic treatment. A random sampling of male and female subjects was done who met the inclusion criteria, to avoid bias. Inclusion criteria include healthy individuals, same Socio-economic status and same ethnic group. Exclusion criteria included the presence of signs of acute inflammation or infection at the time of blood sampling, patients on medication, patients with systemic disease, serious illnesses, growth abnormality, no bone disease or deformities, no bleeding disorders, no history of any serious trauma or injury to the face or hand and wrist region.
Lateral cephalograms were obtained from male and female subjects. Radiographs were assessed for different CVMI stages. Parents of subjects were explained about the study. Those who were willing to give blood samples were included in the study. After evaluating the x rays for CVMI stages, subjects were placed into different groups. Subjects were placed into 6 groups viz Group 1 corresponding to CVMI 1 stage, Group 2 corresponding to CVMI 2 stage, Group 3 corresponding to CVMI 3 stage, Group 4 corresponding to CVMI 4 stage, Group 5 corresponding to CVMI 5 stage and Group 6 corresponding to CVMI 6 stage, both for male and female subjects separately.
All subjects were explained about the design of the study and informed consent was taken from all parents before enrolling them for study. The research protocol was approved by the Institutional Review Board. The parental informed consent form was taken before enrolling each subject in the study.
Blood samples were collected from the median cubital vein. The time of blood sample collection for all subjects was between 10 AM to 12 noon. Serum was separated from the clotted blood samples and labelled with a patient code (without any mention of the patient’s details, such as name, age and sex). It was then properly sealed and stored in a box with an ice pack and sent to the laboratory for chemiluminescence immunoassay for determination of IGF-1 levels using IGF-1 600 ELISA (DRG Instruments GmbH,Germany).
Procedure for Lateral Cephalograms
Lateral cephalograms were taken in a natural head position. The cervical staging technique, as described by Hassel and Farman,was used to stage the cervical vertebrae.
Hassel and Farman rule for the assessment of cervical vertebrae skeletal maturation as a predictor
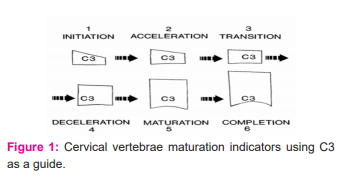
Modification of Lamparski’s criteria, which assess maturational changes of the second, third and fourth cervical vertebrae. Three parts of the cervical vertebrae were traced on matte acetate with a 0.5 mm diameter mechanical lead pencil. These entities were the dens (odontoid process), the body of the third cervical vertebra (C3), and the body of the fourth cervical vertebra (C4). These areas were selected because C3 and C4 could be visualised even when a thyroid protective collar is worn during radiation exposure.
I. Initiation stage of cervical vertebrae (CVMI – 1)
C2, C3 and C4 inferior vertebral body borders were flat with tapered superior vertebral borders of C3 and C4 from posterior to anterior (a wedge shape) and 80% to 100% of adolescent growth was expected (Figure 1).
II. Acceleration stage of cervical vertebrae (CVMI – 2)
Concavities begin to develop on the inferior borders of C2 and C3 with the flat inferior border of fourth cervical vertebrae, vertebral bodies of C3 and C4 are nearly rectangular with 65-85% of remaining pubertal growth (Figure 1).
III.Transition stage of cervical vertebrae (CVMI – 3)
Distinct concavities have seen in the lower borders of C2 and C3 cervical vertebrae.developingconcavity seen in the lower border of the body of C4 cervical vertebrae and 25-65% of pubertal growth expected (Figure 1).
IV . Deceleration stage of cervical vertebrae (CVMI – 4)
Distinct concavities in lower borders of C2, C3 and C4 cervical vertebrae are observed with C3 and C4 cervical vertebrae nearly square in shape with 10-25% of pubertal growth expected (Fig 1).
V. Maturation stage of cervical vertebrae (CVMI – 5)
Accentuated concavities of inferior vertebral body borders of C2, C3 and C4 cervical vertebrae are observed with C3 and C4 cervical vertebrae square in shape and 5-10% of pubertal growth expected (fig 1)
VI. Completion stage of cervical vertebrae (CVMI – 6)
Deep concavities are present for inferior vertebral body borders of C2, C3 & C4 cervical vertebrae with greater C3 & C4 cervical vertebrae height than widths alongwith the completion of pubertal growth(Figure 1).
All radiographs were evaluated by the same operator and later verified by an independent evaluator to determine any interoperator and intraoperator errors. CVMI staging of all samples was performed separately by two investigators at different times. Both investigators were blinded regarding the patient’s details. For all samples, the primary investigator-assessed CVMI stages twice at an interval of 21 days. Another investigator assessed the radiographs.
Results
The assessment of average age and standard deviation of the age in the male and female in all the stages of CVMI has been shown in Table 1. The average age in CVMI 6 in the male category is 16.89 years and in the female 15.12 years.
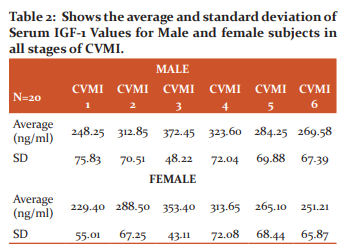
The serum IGF-1 values for the males and females in all the stages of CVMI has been depicted in Table 2. The highest average level of Serum IGF-1 in the males has been shown in CVMI 3rd stage in both males and females, however, the lowest level of serum IGF-1 has been shown in CVMI stage 1 in both males and females (Table 2).
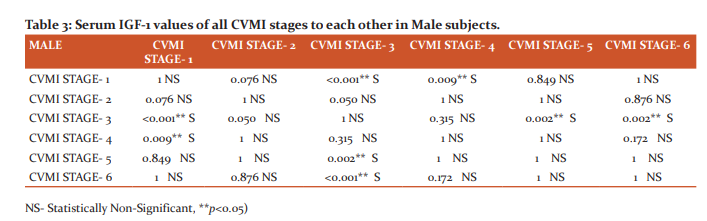
Bonferroni test has beenapplied for the multiple comparisons of serum IGF-1 values for all the stages of CVMI in all the male subjects (Table 3). The significant différence has been observedwhencomparisonshave been donewith CVMI stage 1 with CVMI stage 3 and 4, Stage 3 with stage 1,5 and 6, Stage 4 with stage 1, Stage 5 with Stage 3 and Stage 6 with stage 3 witha P value of lessthan 0.005.
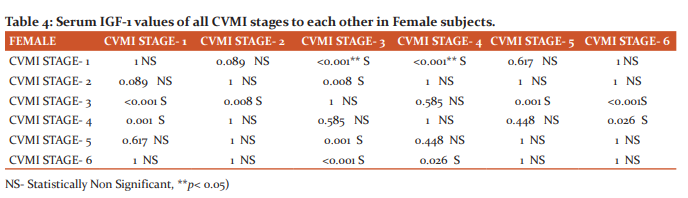
Bonferroni test has been applied for the multiple comparisons of serum IGF-1 values for all the stages of CVMI in all the femalesubjects(Table 4). The significant différence has been observedwhencomparisonshave been done CVMI stage 1 with CVMI stage 3, Stage 2 with Stage 3, Stage 3 with stage 1,2,5 and 6, Stage 4 with stage 1, Stage 5 with Stage 3 and Stage 6 with stage 3 and 4 witha P value of lessthan 0.005.
Discussion
Procedures requiring growth modulation are carried out during the active growth phase for achieving more predictable results. In adolescence, there are many physiological differences in the development of individuals of the same chronological age. There area wide variation between dental age, chronological age and skeletal age. Thus only chronological age or dental age cannot be used to predict growth status. As human growth is mediated through growth hormones, so not only chronological events but also physiological and biological events are seen to assess the growth status of the individual. Growth prediction can be estimated using physiological parameters like peak growth velocity in height, dental development, pubertal markers, and radiographs of skeletal maturation.1 Skeletal age is for a very specific and short period. It is usually assessed using radiographs of one or more specific body parts. There are different methods proposed by various authors in determining the skeletal maturation of the individual. It includes radiographic assessment using lateral cephalograms, OPG, hand wrist radiographs or IOPA`s.
The present cross-sectional study was conducted on 240 male and female subjects in the age group of 8-16 years. Patients were assessed in all 6 stages of CVMI. These stages correspond to pre-pubertal, pubertal and post-pubertal stages. Patients in these age group report for orthodontic treatment, functional correction and orthopaedic treatment. Lateral cephalograms of subjects were assessed for CVMI stages in the beginning. 20 subjects both males and females were placed in each CVMI stage. The grouping was done randomly. Evaluation of results revealed that the average age of male subjects in CVMI stage 1 was 10.15 years, in CVMI-2 was 11.76 yrs, in CVMI-3 was 13.04 yrs, in CVMI-4 was 14.29, in CVMI-5 was 15.45 and in CVMI-6 was 16.89 (Table 1). Further evaluation of results revealed that the average age of female subjects in CVMI stage 1 was 8.83 years, in CVMI-2 was 9.66 yrs, in CVMI-3 was 11.25 yrs, in CVMI-4 was 12.38, in CVMI-5 was 13.89 and in CVMI-6 was 15.12 (Table 2). A higher mean age of male and female patients by about a year.3,5 There is a variation in the age group of male and female subjects.4,6 As expected, sex was a significant factor associated with the age of attainment of each CVMI stages. Male subjects showed on average delayed attainment of the CVMI stages by about 14 months later as a comparison to females. Thus Chronological age alone cannot be used to predict the growth status of individuals. Hand bones and teeth have well-defined appearances during stages of development, but in contrast, cervical vertebrae have a variance of shapes, and it is difficult to define their peculiar appearances. There is not much difference between adult and child as far as the geometry of cervical vertebrae is concerned. This might limit the usefulness of cervical vertebrae in age estimation.9 Additionally, the drawback of repeatability in radiographic methods has questioned the reliability12 of these methods to be used for growth assessment. Gabreils et al.13 and Nestman14 and in their studies have observed insufficient repeatability in identification the stages of CVMI.
There has been a long quest to find an alternate method that is non-invasive, simple and gives a quantitive value to find pubertal growth peak. Thusa newly emerging method for determining skeletal growth is the evaluation of biomarkers. Biomarkers are those agents which are directly involved in bone growth and remodelling. A biomarker is a measurable indicator of some biological state or condition. Biomarkers are measured and evaluated to examine normal biological or pathological processes or pharmacologic responses to a therapeutic intervention. Several parameters are considered for including a biomarker as a diagnostic tool, which includes sensitivity, specificity, robustness, accuracy, reproducibility, practicality and ethicality.
Thus various biomarkers have been suggested for predicting the peak growth spurts. During the active phase of growth and development, certain biomarkers present in high concentration in body fluids. Thus biomarkers should be used for monitoring skeletal change during puberty as they have the potential to provide a comprehensive skeletal picture of the individual without the limitations of radiation exposure.15
Insulin-like growth factors (IGF), also known as somatomedin C or non-suppressible insulin-like activity, that play an important role in regulating cellular proliferation, growth, differentiation, survival, migration and development.16 IGF-1 is also known to increase both bone formation and resorption. Two types of IGFs, IGF-I and IGF-II circulate through the bloodstream. IGF-1 is secreted by many tissues and the secretory site seems to determine its actions.IGFs are in ternary complexes with varying half-lives from a few min to more than 12 hours.17,18By the process of proteases IGF is released and later it binds with type I IGF-receptor (IGF-1R).
In our study, we found that IGF-1 values increased from stage 1 to stages 3 and then declined as can been seen in Tables 4 & 5 in both male and female subjects. Though serum IGF-1 values are higher in male subjects as compared to female subjects in all stages of CVMI, there is no statistically significant difference between the mean values of males and females. IGF-1 serum values are low during early childhood, increases progressively through childhood, with the typical pubertal peak around 11.5 and 13 years of age in girls and boys respectively. The increased GH secretion that is provoked by the increased production of gonadal steroids most likely initiates the pubertal increase. After puberty, IGF-I serum values decrease across CVMI stages but not sharply as stated in other studies. IGF-1 shows a positive relation for 8-12 and 9-13 years in female and male subjects and shows a negative relation form 12-18 and 14-18 years in male and female subjects. Despite using a similar methodology (chemiluminescent assays), the mean reference values of serum IGF-1 of ouradolescent'ssubjects are different from that of Sweden, Belgium and Germany.19
IGF-1 values were maximum in CVMI stage 3 as reported in other studies. Data from all stages were evaluated and compared to each stage individually in male and female subjects. In male subjects, it started from 248.25 ng/ml from CVMI 1 stage, peaked at 372.45 ng/ml in the CVMI3 stage and later decline to 269.58 ng/ml in CVMI 6 stage. There was a relatively high standard deviation seen in our study. This could be due to fact that there is great variation in the individual during puberty, the duration of the growth spurt, and the peak annual growth increment or it could be due to inherent problem seen in cross-section study design.20 Evidence suggests that changes in environmental and socioeconomic factors can greatly influence the timing and patterns of growth in a population. In male subjects, it showed that there is a statistically significant difference for serum IGF-1 values of CVMI stage 1 to CVMI stage 3 and CVMI stage 4. There is a statistically significant difference for serum IGF-1 values of CVMI stage 3 concerning CVMI stage 1, CVMI stage 5 and CVMI stage 6. There is also a statistically significant difference for serum IGF-1 values of CVMI stage 4 to CVMI stage 1, serum IGF-1 values of CVMI stage 5 to CVMI stage 3 and serum IGF-1 values of CVMI stage 6 to CVMI stage 3. As evident from higher values of IGF-1 in CVMI stage 3 as compared to values in other CVMI stages, it is of opinion that serum IGF-1 values can be used as a tool to predict the peak velocity growth. There need to consensus and data to have reference values for a male subject who are normal and healthy. As the results are following other studies but mean values are different.
Data from female subjects showed a similar trend as was seen in male subjects. In female subjects, it started from 229.40 ng/ml from the CVMI 1 stage, peaked at 353.40 ng/ml in the CVMI3 stage and later decline to 251.21 ng/ml in CVMI 6 stage. There is a statistically significant difference for serum IGF-1 values of CVMI stage 1 concerning CVMI stage 3 and CVMI stage 4; serum IGF-1 values of CVMI stage 2 to CVMI stage 3; serum IGF-1 values of CVMI stage 3 to CVMI stage 1, CVMI stage 2, CVMI stage 5 and CVMI stage 6; serum IGF-1 values of CVMI stage 4 to CVMI stage 1 and CVMI stage 6. Thus comparison shows that values of CVMI stage 3 for both male and female subjects were much higher compared to other CVMI stages. Serum IGF-1 levels tend to peak whenever there is accelerated growth whether it is due to pubertal growth spurt21, adrenarche22,acromegalyor tumorous growth occurring in the body23. We found peak mean IGF-1 levels in male subjects at CVMI3 at a mean age of 13.04 years in comparison to the peak value in males found at CS4 at a mean age of 14.5 years in the study by Ishaq et al.24 and in stage CS4 with a mean age of 14.04 years in a previous study.25
Disagreement to other studies may be attributed to the difference in ethnic backgrounds, the methodology for serum value evaluation. Also, the role of environmental and genetic factors affecting sex steroid control and IGF-1 cannot be excluded.25On the critical assessment of IGF-1 trends, we found that in males subjects IGF-1 serum levels increased from CVMI1 to CVMI2, with a sudden rise seen from CVMI2 to peak at CVMI3, followed by a gradual decline from CVMI3 to CVMI4 and then a sudden fall in value from CVMI4 to CVMI6; while in female subjects, there was a sudden increase in IGF-1 serum levels from CVMI1 to CVMI2, which peaked at CVMI3 followed by a slow decline to CVMI4 continuing to suddenly decline from CVMI4 to CVMI 6.
On evaluating the reference values of IGF-1 in both males and females in our study, the mean IGF-1 levels in CVMI stages 2,3,4,5 and 6 lie above 250 ng/ml. Masoud et al.26in a longitudinal study investigated mandibular growth and IGF-1 levels. The authors find that if serum levels of IGF-1 are above 250 ng/ml on periodic testing, average mandibular growth of 5.5 mm can be anticipated. If levels of IGF-1 have an ascending trend and an average of below 250 ng/ml, the average growth rate of 2 mm or f is expected. 25.26.27. It is in contrast to a study by Gupta et al where it was seen only CVMI 3 to CVMI 6 stages. But it can be assumed that regularly follow up of subjects will show ascending or descending trend, which can be used to predict remaining growth in individuals using IGF-1 values. Several growth studies have shown that serum IGF-1 levels reflect serum GH levels but without the diurnal variations involved with the latter. Thus, IGF-1 levels have been used to diagnose GH activity27,28. Serum IGF-1 levels have also been related to chronologic age and sexual maturity stages, and have been shown to peak late in puberty28.
Conclusion
This study reveals that Serum IGF-1 levels are at a peak in CVMI Stage 3 in both males and females.Biomarker- IGF-1 serve as an alternate method for growth assessment which is non-invasive to x-ray exposure, simple and gives a quantitative value to find pubertal growth peak.In comparison to handwrite radiographs and repeatability of lateral cephalograms, biomarkers serve as an adjunctive and reliable tool in growth assessment.The greater binding affinity of IGF-1 to other proteins makes it necessary for conducting further studies.
Conflict of interest: None
Source of Funding: Nil
References:
-
Mohammed RB, Reddy MA, Jain M, Singh JR, Sanghvi P, Thetay AA. Digital radiographic evaluation of hand-wrist bone maturation and prediction of age in South Indian adolescents. Hand (NY)2014;9:375–383.
-
Greulich WW, Pyle SI, Todd TW. Radiographic Atlas of Skeletal Development of the Hand and Wrist. Stanford: Stanford University Press. 1959.
-
Kiran S, Sharma VP, Tandon P. Correlative and comparative study of Fishman's skeletal maturity indicators with CVMI and chronological age in Lucknow population. Eur J Gen Dent2012;1:161-165.
-
Javangula PT, Uloopi KS, Vinay C, Rayala C, Kumar NM, Chandra S P. Comparison of middle phalanx of the middle finger and cervical vertebrae as skeletal maturity indicators. Indian J Dent Sci 2017;9:84-87.
-
S Mittal, A Singla, M Virdi, . Sharma, B Mittal. Co-Relation Between Determination Of Skeletal Maturation Using Cervical Vertebrae And Dental Calcification Stages. Int J Forens Sci2009;4(2):1-9.
-
Perinetti G, Rosso L, Riatti R,Contardo L. Sagittal and Vertical Craniofacial Growth Pattern and Timing of Circumpubertal Skeletal Maturation: A Multiple Regression Study. BioMed Res Int 2016;2016:1728712-7.
-
Szemraj A, Wojtaszek-S?omi?ska A,Racka-Pilszak B. Is the cervical vertebral maturation (CVM) method effective enough to replace the hand-wrist maturation (HWM) method in determining skeletal maturation?-A systematic review. Eur J Radiol2018;102:125-128.
-
Hassel B, Farman AG. Skeletal maturation evaluation using cervical vertebrae. Am J Orthod Dentofacial Orthop 1995;107(1):58-66.
-
Bjork A, Helm S. Prediction of the age of maximum pubertalgrowth in body height. Angle Orthod1967;37:134–143.
-
Gelbrich B, Fischer M, Stellzig-Eisenhauer A, Gelbrich G. Are cervical vertebrae suitable for age estimation?. J Forensic Odontostomatol 2017;35(2):66-78.
-
Ricky WK. WongHA. Alkhal, and A. Bakr M. Rabie. Use of cervical vertebral maturation to determine skeletal age. Am J Orthod Dentofacial Orthop2009;136:484.e1-484.e6.
-
Predko-Engel A, Kaminek M, Langova K, Kowalski P, Fudalej PS. Reliability of the cervical vertebrae maturation (CVM) method. Bratisl Lek Listy 2015;116(4):222-226.
-
Gabriel DB, Southard KA, Qian F, Marshall SD, Franciscus RG, Southard TE. Cervical vertebrae maturation method: poor reproducibility. Am J Orthod Dentofacial Orthop2009;136:478.e1-7.
-
Nestman TS, Marshall SD, Qian F, Holton N, Franciscus RG, Southard TE. Cervical vertebrae maturation method morphology criteria: poor reproducibility. Am J Orthod Dentofacial Orthop2011;140:182-188.
-
Gordon CM. Evaluation of bone density in children. CurrOpin Endocrinol Diab 2005;12:444-451.
-
Varma Shrivastav S, Bhardwaj A, Pathak KA, Shrivastav A. Insulin-Like Growth Factor Binding Protein-3 (IGFBP-3): Unraveling the Role in Mediating IGF-Independent Effects Within the Cell. Front Cell Dev Biol 2020;5(8):286.
-
Hodgkinson SC, Napier JR, Davis SR, Patel B,Gluckman PD. Binding protein, radioreceptor and biological activities of recombinant methionyl insulin-like growth factor-I variants. Molec Cell Endocr 1989;66;37-44.
-
Baxter RC. Circulating binding proteins for insulin-like growth factors. Trends EndocriMetab1993;4:91–96.
-
Brabant, von ZurMuhlenA,WusterC,RankeMB,KratzschJ,KiessW, et al. Serum insulin-like growth factor I reference values for an automated chemiluminescence immunoassay system: results from a multicenter study. Horm Res 2003;60(2):53–60.
-
Masoud MI, Marghalani HY, Masoud IM, Gowharji NF. Prospective longitudinal evaluation of the relationship between changes in mandibular length
and blood-spot IGF-1 measurements. Am J Orthod Dentofacial Orthop. 2012;141(6):694-704.
-
KanburOksuz N, Derman O, Kynyk E. Correlation of sex steroids with IGF – 1 and IGFBP-3 during di erent pubertal stages. Turk J Pediatr 2004;46(4):315-321.
-
Baquedano MS, Berensztein E, Saraco N, Dorn GV, Davila MT, Rivarola MA, et
al. Expression of the IGF system in human adrenal tissues from early infancy to late puberty: implications for the development of adrenarche. Pediatr Res 2005;58(3):451-458.
-
Daughday WH. The possible autocrine/paracrine and endocrine roles of insulin-like growth factors of human tumours. Endocrinology 1990;127(1):1-4.
-
Ishaq RAR, Soliman SAZ, Foda MY, Fayed MMS. Insulin-like growth factor I: a biologic maturation indicator. Am J Orthod Dentofacial Orthop 2012;142(5):654-661.
-
Gupta S, DeoskarA, Gupta P, Jain S. Serum insulin-like growth factor-1 levels in females and males in different cervical vertebral maturation stages. Dental Press J Orthod2015;20(2):68-75.
-
Masoud MI, Masoud I, Kent RL Jr, Gowharji N, Hassan AH, Cohen LE. Relationship between blood-spot insulin-like growth factor 1 levels and hand-wrist assessment of skeletal maturity. Am J Orthod Dentofacial Orthop 2009;136(1):59-64.
-
Teale J, Marks V. The measurement of insulin-like growth factors 1: clinical applications and significance. Ann Clin Chem 1986;23:413-24
-
Mitchell ML, Hermos RJ, Schoepfer A, Orson JM. Reference ranges for insulin-like growth factor-1 in healthy children and adolescents, determined with filter-paper blood specimens. Clin Chem 1990;36:2138-2139.
|
 IJCRR
IJCRR 


 This work is licensed under a Creative Commons Attribution-NonCommercial 4.0 International License


