IJCRR - 13(5), March, 2021
Pages: 145-149
Date of Publication: 03-Mar-2021
Print Article
Download XML Download PDF
A GLCM based Feature Extraction in Mammogram Images using Machine Learning Algorithms
Author: BN Jagadesh, L Kanya Kumari
Category: Healthcare
Abstract:Introduction: Most Indian women are suffering from Breast Cancer. The simple and efficient screening used for Breast Cancer (BC) is Mammograms. Mammogram images are used to detect BC in the early stages. Objective: The main objective of our research is to detect the BC in early stages using Gray Level Co-occurrence Matrix (GLCM) with Machine Learning Algorithms. Methods: Our proposed system is a two-step process which includes feature extraction and classification. Features are extracted from the Mammographic Image Analysis Society (MIAS) database by using a texture-based descriptor called GLCM. These features are passed to classifiers called K-Nearest Neighbor (KNN), Random Forest (RF) and Gradient Boosting by considering 30% as testing data size. Results: The experiments are done as follows: GLCM+RF, GLCM+KNN and GLCM+ Gradient Boosting and the performance of these classifiers are calculated by finding accuracy metric. Conclusion: The conclusion is that GLCM features with KNN classifier give better results than other classifiers.
Keywords: Breast cancer, Screening, Mammograms, Gray Level Co-occurrence Matrix, K-Nearest Neighbor
Full Text:
INTRODUCTION
Most of the women in India are dying due to breast cancer (BC), which can be detected by a method called screening. The symptoms for BC are 1. Nipple discharge 2. Change in the shape and size of the breast 3. Redness 4. Swelling. Not all lumps will lead to BC. Calcium deposits present in the breast are called microcalcifications which may lead to Breast Cancer.1 According to IARC (International Agency for Research on Cancer), breast cancer is present in 2,088,849 women.2 Diagnosing this cancer cell is difficult process.3 Breast Cancer screening can be done in many ways like X-ray (mammograms), PET (Positron Emission Tomography), ultrasound, MRI (Magnetic Resonance Imaging) and CT-Scan (computed tomography), Thermogram imaging. Among all these methods, mammogram imaging is an efficient and less cost technique. Different temperatures are required for different imaging techniques. But, the accurate prediction was not possible because of human fatigue and habituation.4,5 This paper is organized as follows: literature survey is in section 2, image dataset is discussed in section 3, our proposed methodology is discussed in section 4, the experimental results are discussed in section 5 and the conclusion is given in section 6.
The authors discussed that there are several feature extraction techniques are available in medical image processing.6 Among these techniques, the authors used one mostly used technique called shape-based feature extraction. The shape of an image includes two properties such as boundary-based and region-based and they concluded that the features are depending on the segmented images. The features has been extracted based on texture.7 There are many numbers of feature extraction techniques are present. In their paper, they have used Grey-Level Co-occurrence Matrix (GLCM).
A private dataset taken from Bethezata General Hospital and a Mammographic Image Analysis Society (MIAS) database which is publicly available.8 Gray Level Co-occurrence Matrix (GLCM) and Gabor filters are used for feature extraction and also they have used Convolutional Neural Network (CNN). For classification, they have used different classification techniques such as K-Nearest Neighbors (KNN), Random Forest(RF), Support Vector Machine (SVM), Naïve Bayes and Multi-Layer Perceptron (MLP). Authors did the experiments with all the combinations and they concluded that Gabor and CNN feature with Multi-Layer Perceptron (MLP) is performed well for mammogram classification. The authors have used preprocessing techniques and Region Of Interest (ROI) is extracted by using Fuzzy C-Means clustering technique and active counter technique.9 From this resultant ROI, mostly used texture-based feature extraction technique called GLCM is used. A combined classifier called Support Vector Machine (SVM) and KNN is used to classify Digital Database for Screening Mammography (DDSM) images and MIAS image dataset. The accuracy for MIAS dataset is 94% and DDSM dataset the classification accuracy is 100%.
To identify the mass as benign or malignant, shape and margin features has been used.10 Vector field convolution is applied as a segmentation technique. Texture based and statistical-based methods are used for feature extraction and these features are given as input to classifiers such as SVM and RF. SVM with Genetic algorithm and SVM with Particle Swarm Optimization results are compared with RF and concluded that RF gave better results. They have used 5-fold cross-validations accuracy measure. The authors concluded that not only shape features will give better results. These are combined with texture features may give better results. A Computer-Aided Diagnosis (CAD) system11 is to find masses in the mammograms. They have experimented in 4 steps. They are: 1) preprocessing median filtering, homomorphic filtering, logarithmic transformation, region growing and thresholding are used. 2) Feature extraction used is Fourier Transform(FT) and weighted FT transform are used. 3) the obtained features are reduced by using Principal Component Analysis. The classifiers used in their research are VM and KNN. As a performance measure, the authors have used is 10-fold stratified cross-validation. The authors concluded that SVM gave better results than compared other technique.
In medical image processing, there is the number of imaging techniques are available for the detection of breast cancer. They are: 1) Mammogram X-ray, ultrasound,2) CT-Scan(computed tomography), 3) PET (Positron Emission Tomography) and 4)MRI (Magnetic Resonance Imaging). Among all these mammogram imaging is better for early detection of breast cancer. So, in our research MIAS mammogram dataset is used (Mammographic Image Analysis Society) to classify mammograms into Benign or Malignant. This dataset consists of 322 grey-scale images.12 We represented sample images from MIAS which is represented in Figure 1.

Figure 1. Sample mammograms from MIAS dataset: mdb001, mdb015, mdb023, mdb081. Mammograms are the X-ray imaging modality used to detect breast cancer in early stages so that the patient survival rate can be increased.
MATERIALS AND METHODS
Our methodology is divided into 2 stages. They are feature extraction and classification. Diagrammatically it is represented in figure 2.

Figure 2. Steps in the proposed methodology. This diagram represents mammogram images are given as input to our system. Then features are extracted from mammograms. These features are given as input to the classifier to classify the image into normal or abnormal
Feature Extraction
The Transformation of the input image into features is called feature extraction. Features are extracted by using feature extraction techniques. Features are extracted based on texture, boundary, spatial, edge, transform, colour and shape features. Shape-based features are divided into the boundary and region-based features. Boundary features are also called contour-based which uses boundary segments.13 Boundary based features are geometrical descriptors (diameter, major axis, minor axis, perimeter, eccentricity and curvature), Fourier descriptors and statistical descriptors (mean, variance, standard deviation, skew, energy and entropy).14 Region-based features are texture features as GLCM.15
Gray Level Co-Occurrence Matrix
Texture features are playing an important role in the prediction of breast cancer disease16. It is represented in the form of a matrix called GLCM. This Co-Occurrence Matrix gives different frequencies of pixel intensities in an image. These frequency values are likelihood occurrence of grey-level pixel intensity ‘p’(called reference pixel) in the neighbourhood of intensity ‘q’ (neighbour pixel) grey level at a distance ‘d’ in 4 directions ‘?’(00,450, 900 and 1350). In our research, the properties considered are energy, contrast, correlation and homogeneity. Total 16 GLCM features are considered (4 features in 4 directions). These features are extracted from MIAS mammogram images. The block diagram is represented in 3. The images considered for our experiment from MIAS dataset are represented in Figure 4 (Benign) and Figure 5 (Malignant) respectively.
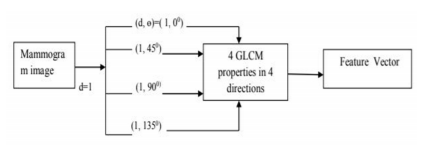
Figure 3: Block diagram of the GLCM Technique. This diagram takes mammogram image as input and calculates GLCM properties in 4 different angles (00,450, 900 and 1350) and statistical features such as energy, homogeneity, correlation and contrast calculated
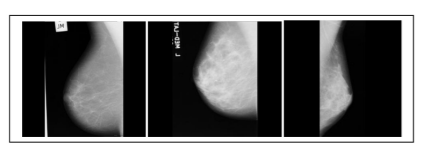
Figure 4: These images are considered from benchmark dataset called MIAS. This dataset consists of a total of 322 images which are taken from 161 patients. Sample images from MIAS database mdb018, mdb029, mdb009- Benign.
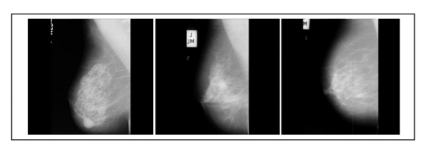
Figure 5: These images are also considered from MIAS dataset. These are grey level images and each of size 1024 X 1024. Sample images from MIAS database mdb013, mdb021, mdb063- Malignant
GLCM properties considered for our research are as follows:
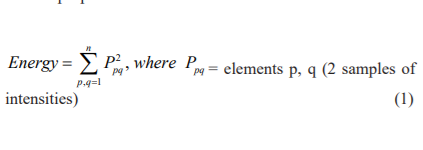
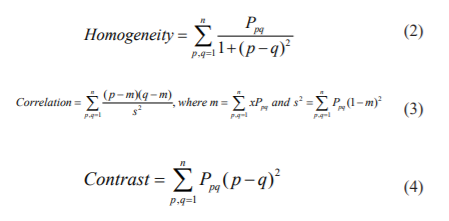
These features are fed to different classifiers to find the performance of the proposed GLCM technique.
CLASSIFICATION
A simple machine learning classifier KNN is used for classification of mammogram images into Benign and Malignant. This is not only used in medical image classification but also used to detect the diseases in plants to save the crops17. This technique finds the K-closest neighbours to the given image and forecasts the majority vote of classes of K-neighbors2. The steps applied are:
1. The GLCM features are given as input to KNN classifier
2. Initialize the value of K to 5.
3. For each image in the data, calculate the distance between training data and test data.
4. Sort the final distances from the smallest distance to the largest distance.
5. Choose the first K-class labels from the sorted list
6. Return the mode of K-labels.
The benefits of using KNN classifier are 1. It is easy to use and also easy to implement 2. hyperparameters used in this technique are less than 3. It works fast when we use small dataset.
RESULTS AND DISCUSSION
In the proposed methodology we considered the images from MIAS. These images are given as input to texture-based feature extraction technique called GLCM. The 16 features are represented with class labels in Table 1. This table consists of image number (I) from the dataset(for example I21 means mdb021) and features are represented as columns (F) denoted by F0, F1…..F15 and class labels are represented as follows.

These features are given as input to KNN18 classifier with K=5. To classify mammograms into Benign or Malignant, the dataset is divided into 2 parts for experimentation. They are training and testing data. We have considered training and testing sizes at 70% and 30% respectively. To know the performance of the classifier we have calculated the accuracy. Accuracy is the measure to find the efficiency of the classifier and is calculated as follows.19

In the equation (5), TPC is True Positives Count, TNC is True Negatives Count, FPC is False Positives Count and FNC is False Negatives Count. By using the above equation (5) we have calculated accuracy for GLCM with Random Forest, GLCM with KNN and GLCM with Gradient Boosting classifiers. The better classification accuracy is achieved for GLCM with KNN and it is 93%.
CONCLUSION
In our research, we have studied number of feature extraction techniques which used for mammogram classification. The techniques used in literature were region based, boundary based, texture based and shape based methods. Among all these methods most of the researchers concluded that texture based feature extraction technique called GLCM gives better features to classify mammograms. The obtained features are given as input to different machine learning classifiers like Random Forest, KNN and Gradient Boosting. We have done the experiments like GLCM with Random Forest, GLCM with KNN and GLCM with Gradient Boosting. By observing all the experimental results, we concluded that GLCM with KNN gives better results than compared other classifiers in classifying the mammogram image as benign or malignant.
ACKNOWLEDGMENT
Authors acknowledge the immense help received from the scholars whose articles are cited and included in references to this manuscript. The authors are also grateful to authors/editors/publishers of all those articles, journals, and books from which the literature for this article has been reviewed and discussed.
Conflict of Interest:
The authors involved in the current study does not declare any competing conflict of interest
Source of Funding
No fund or sponsorship in any form was obtained from any organization for carrying out this research work.
References:
1. Abirami C, Harikumar R, Chakravarthy SRS. Performance analysis and detection of microcalcification in digital mammograms using wavelet features. International Conference on Wireless Communications, Signal Processing and Networking.2016; 2327-2331.
2. Nagarajan V, Britto EC, Veeraputhiran SM. Feature extraction based on empirical mode decomposition for automatic mass classification of mammogram images. Med Novel Tech Devic 2019;1:100004.
3. Rangayyan M, El-Faramawy NM, Desautels JEL Alim OA. Measures of acutance and shape for classification of breast tumours. IEEE Transactions Med Imaging.1997;16:799-810.
4. Damiati S, Peacock M, Mhanna R, Sopstad S, Sleytr UB, Schuster B. Bioinspired detection sensor based on functional nanostructures of S-proteins to target the folate receptors in breast cancer cells. Sens Actuators B Chem. 2018;267:224-230.
5. Margolies LR, Salvatore M, Yip R, Tam K, Bertolini A, Henschke C, et al. The chest radiologist’s role in invasive breast cancer detection. Clin Imaging 2018;50:13–19.
6. Liu J, Shi Y. Image Feature Extraction Method Based on Shape Characteristics and Its Application in Medical Image Analysis. Appl Inform Commun Comp Inform Sci 2011; 224:172-178.
7. Pradeep S, Malliga L. Content-based image retrieval and segmentation of medical image database with fuzzy values. International Conference on Information Communication and Embedded Systems. 2014;1-7.
8. Debelee TG, Gebreselasie A, Schwenker F, Amirian M, Yohannes D. Classification of mammograms using texture and CNN based extracted features. J Biomim Biomater Biomed Eng 2019;42:79–97.
9. Sonar U. Bhosle F, Choudhury C. Mammography classification using modified hybrid SVM-KNN. In: International Conference on Signal Processing and Communication (ICSPC), Coimbatore, pp. 305-311(2017).
10. Dong M, Lu X, Ma Y, Guo Y, Ma Y, Wang K. An Efficient Approach for Automated Mass Segmentation and Classification in Mammograms. Soc Imaging Inform Med 2015;28(5):613-625.
11.Zhang Y-D, Wang S-H, Liu G, Yang J. Computer-aided diagnosis of abnormal breasts in mammogram images by weighted-type fractional Fourier transform. Adv Mech Eng 2016;8(2):1-11.
12. Suckling J, Parker J, Dance D, Astley S, Hutt I, Boggis C, Ricketts I et al. The Mammographic Image Analysis Society Digital Mammogram Database. Excerpta Medica 2015; 375-378.
13. Kumari LK, Jagadesh BN. A novel approach for the detection of tumours in mammographic images using Fourier descriptors and KNN. In: Lecture Notes in Electrical Engineering. Singapore: Springer Singapore; 2020. p. 1877–84.
14. Murty AVSN, Jagadesh BN, Bhagavan K, Satyanarayana S. A comparative study of various edge enhancement filters in the spatial domain. Res J Pharm Technol 2016;9(12):2403.
15. Kumar G, Bhatia PK. A detailed review of feature extraction in image processing systems.In:2014 Fourth International Conference on Advanced Computing & Communication Technologies. IEEE; 2014.
16. Parekh R. Using Texture Analysis for Medical Diagnosis. IEEE Multi Media 2012;19(2):28-37.
17. Sheikh S, Wani R, Niyaz I, Manzoor F, Wani L, Beg A. Study of Breast Lesions with Special Reference to Rare Malignant Epithelial Tumors in a Tertiary Care Hospital with Brief Review of Literature. Int J Curr Res Rev 2017;9(24):48-54.
18. Bhattacharyya D, Doppala BP, Rao NT. Prediction and forecasting of persistent kidney problems using machine learning algorithms. Int J Curr Res Rev 2020;12(20):134–139.
19. Kaur A, Kaur I. An empirical evaluation of classification algorithms for fault prediction in open source projects. J King Saud Univ Comput Inform Sci 2018;30(1):2–17.
|


 This work is licensed under a Creative Commons Attribution-NonCommercial 4.0 International License