IJCRR - 9(11), June, 2017
Pages: 64-67
Date of Publication: 12-Jun-2017
Print Article
Download XML Download PDF
Performance Visualization of Gnome Sort in Worst Case Implemented Using R in Three Personal Computers
Author: Dipankar Das, Priyanka Das, Rishab Dey, Sreya Modak
Category: Technology
Abstract:Aim: To visualize the performances of the Gnome sort in the worst case in three different personal computers and to identify through visual inspection whether the performances of the Gnome Sort in the worst case follows quadratic nature or not.
Methodology: The Gnome sort algorithm is implemented using R. For the purpose of the study, the researchers have used three (3) different personal computers having different configurations. The entire experiment have been carried out for data size one hundred (100) to data size two thousand (2000) with an interval of one hundred (100). The performances (data size versus average run time in seconds) of Gnome sort algorithm in the worst case in all the three personal computers are visualized using scatter plots and quadratic curves.
Results: The performances of Gnome sort in the worst case implemented using R in all the three personal computers under study shows similar patterns which are very close to quadratic curves.
Conclusion: From the study using visual inspections, we may conclude that the performances of Gnome sort in the worst case in all the three (3) cases are approximately following quadratic nature.
Keywords: Gnome sort, Worst Case, Performance Visualization
Full Text:
Introduction:
One of the ways to measure the performance of any algorithm is to measure the running time of that algorithm [1] and the performance measurement can be done either empirically or theoretically [1]. In the case of analysis of any algorithm empirically, one of the goals is to find out whether a particular algorithm is having a particular property [2]. Bostock (2014) had pointed out that in the case of algorithm visualization one has to rely on the existing logical rules and that is why this work becomes really interesting [3]. Stupid sort was first described by Hamid Sarbazi-Azad in 2000 [4][5]. Later Dick Grune called it Gnome sort [5].
Literature Review:
The literature review revealed that the comparative study of different sorting algorithms which include Gnome sort also, were performed [6][7][8][9][10]. Demonstration of Gnome sort, Insertion sort and Quicksort on mobile platforms was done [11].
Objective of the Study:
To visualize the performances (data size versus run time in seconds) of Gnome sort in the worst case implemented using R in three (3) different personal computers.
To perform the visual comparisons of all the three (3) performances (data size versus run time in seconds) of Gnome sort in the worst case implemented using R in three (3) different personal computers with quadratic curves.
Methodology:
The Gnome sort algorithm was implemented using R programming language. We had run the algorithm on three (3) different personal computers in the worst case for data size one hundred (100) to data size two thousand (2000) with an interval of one hundred (100) and on each machine for each data size, ten (10) observations were recorded. On each machine, for each data size (data size one hundred (100) to data size two thousand (2000) with an interval of one hundred (100)) we had calculated the average run time in seconds. As a result, we had generated three (3) different datasets named D1 (for Machine1), D2 (for Machine2) & D3 (for Machine3), one each for each of the personal computers under study. The scatter plots were generated for each of these three (3) datasets where ‘data size’ was considered as x axis, ‘average run time in seconds’ was considered as y axis and further to this, for meeting the second objective of the present study, we had taken the highest point as the starting point in each cases and drawn the quadratic curve from that point for each of these three (3) cases to perform the visual comparison. After performing the visual comparisons using these quadratic curves, we had also drawn trend lines to these data sets for the final visualizations of the said performances.
The hardware configurations of the three (3) personal computers are given below:
For Machine 1 (Desktop): Intel(R) Core 2 Duo CPU, E7500 @2.99 GHz, 2 GB of RAM
For Machine 2 (Laptop): Intel(R) Core i5-6200U CPU @2.30 GHz, 8 GB of RAM
For Machine 3 (Laptop): Intel(R) Core i7-4702MQ CPU @2.20 GHz, 8 GB of RAM
Data Analysis, Findings & Visualizations:
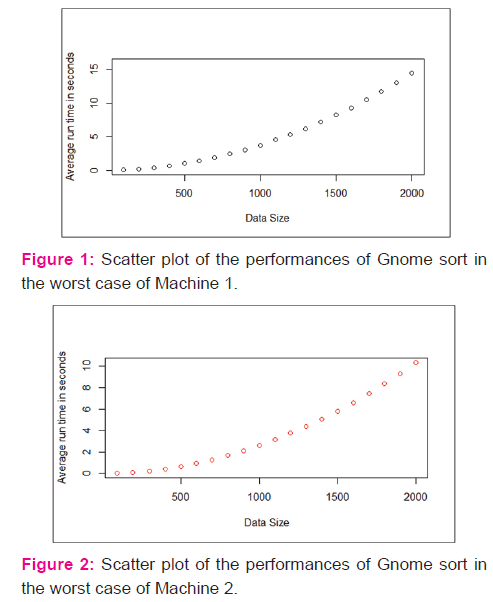
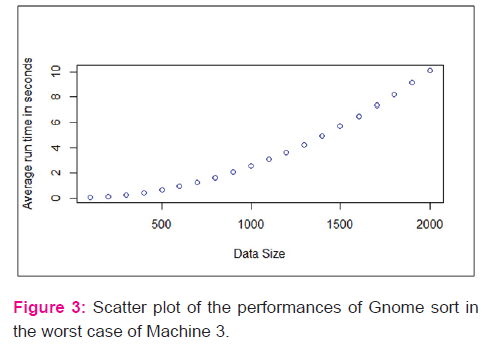
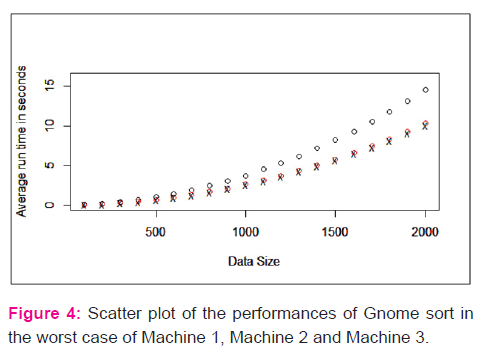
The performances (data size versus average run time in seconds) of Gnome sort in the worst case implemented using R in three (3) different personal computers are shown in the following scatter plots:
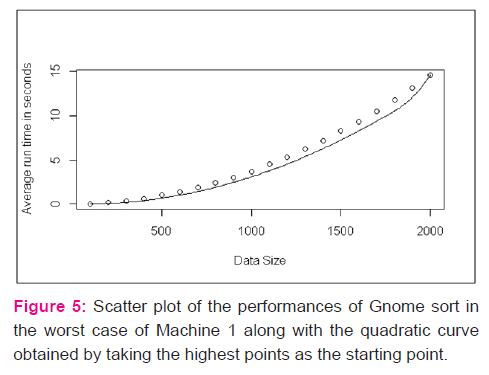
The performances (data size versus average run time in seconds) of Gnome sort in the worst case implemented using R in all the three (3) cases are shown using a single scatter plot in the following figure:
In the scatter plot (Figure 4) the black circles represent the performance of Machine 1, the red circles represent the performance of Machine 2 and the ‘x’ sign represent the performance of Machine 3.
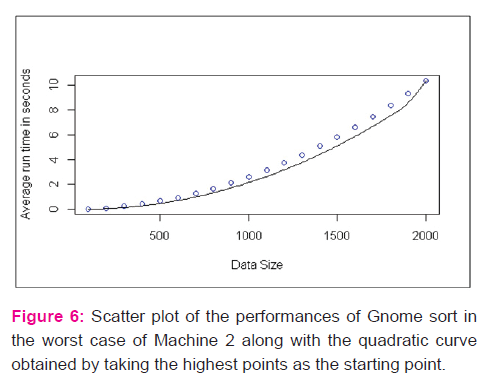
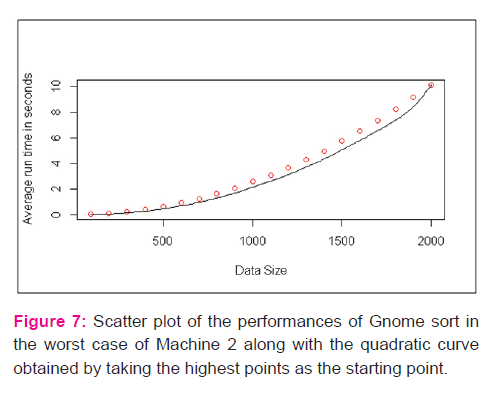
The scatter plots of the performances (data size versus average run time in seconds) in all the three (3) cases along with the quadratic curves which are obtained by taking the highest points as the starting points in each of the three (3) cases are shown in the following figures:
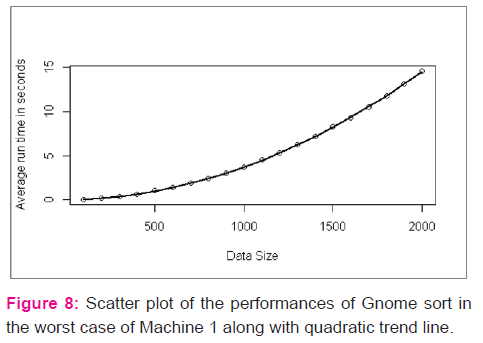
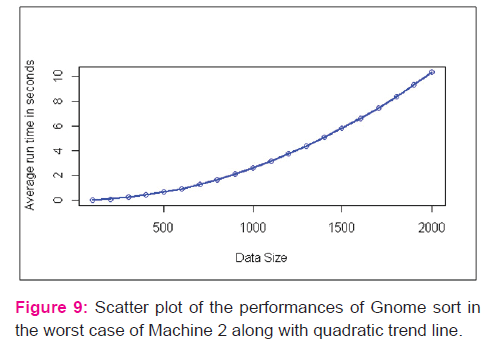
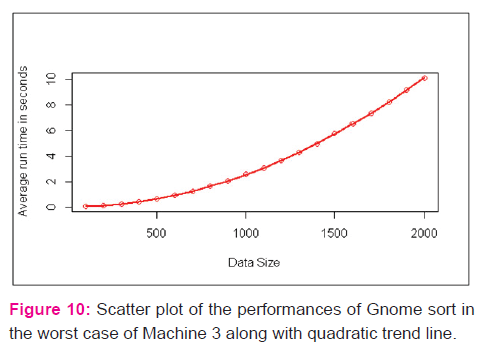
The scatter plots of the performances (data size versus average run time in seconds) in all the three (3) cases along with the quadratic trend lines are shown in the following figures:
Discussion:
All the scatter plots in the study are drawn by taking ‘Data Size’ as the x axis and ‘Average run time in seconds’ as the y axis. We observe that though for all the three (3) personal computers under study, the quadratic curves (drawn by considering the highest data point as the starting point in each case) do not pass through all the data points (as evident from Figure 5, Figure 6 & Figure 7) but they provide us enough visual hint for exploring the quadratic trend lines in all the three (3) cases. Next, when we have examined the cases using quadratic trend lines, then it has been observed that the quadratic curve in each case passes through most of data points of the respective case (as evident from Figure 8, Figure 9 & Figure 10). We have also observed that the Machine 1 is taking more run time than the other two (2) personal computers (Machine 2 & Machine 3). At the same time we have also observed that the patterns in all the cases are almost similar.
Conclusion:
From Figure 1, Figure 2 and Figure 3, we have observed that the performances of Gnome sort in the worst case implemented using R in all the three (3) cases are showing similar pattern. It is also clearly visible from the scatter plot (Figure 4) that with the increase in the data size the first personal computer (Machine 1) is taking more run time in respect to the others (Machine 2 & Machine 3). From Figure 5, Figure 6 and Figure 7, we may conclude that the natures of the performances of all the three (3) cases are very close to quadratic pattern. Taking clue from these we have drawn quadratic trend lines for each of these three (3) cases which are shown in the Figure 8, Figure 9 and Figure 10. From these three (3) figures (Figure 8, Figure 9 and Figure 10) we have observed that in each of these three (3) cases the quadratic trend lines passes through almost all the data points and we may safely conclude that in each of these three (3) cases the performances are following quadratic pattern. The present study is conducted on three (3) personal computers only. In all the three (3) cases, the experiments are carried out from data size one hundred (100) to data size two thousand (2000) and therefore our findings are limited to this study only. It may also be noted that in this study, we have tried (i) to visualize the performances of the Gnome sort in the worst case in three (3) personal computers (having different hardware configurations) & (ii) to compare the performance of the Gnome sort in the worst case with quadratic curves in order to identify the pattern of the performance of Gnome sort in the worst case and have not tried to find out the best curve which passes through the data points in each case. Identification of the best curve which passes through the data points in each cases and discovering the pattern of the performance beyond the experimented range will be our future scope of work.
Acknowledgement:
Authors acknowledge the immense help received from the scholars whose articles are cited and included in references of this manuscript. The authors are also grateful to authors / editors / publishers of all those articles, journals and books from where the literature for this article has been reviewed and discussed.
References:
[1] Han, B. (n.d.). CSED233: Data Structures (2015F) - Lecture3: Algorithm Analysis [PDF]. Retrieved March 30, 2017, from http://cvlab.postech.ac.kr/~bhhan/class/cse233_2015f/csed233_lecture3.pdf
[2] Hoos, H. H. (n.d.). CPSC 590 (AUTUMN 2003) - INTRODUCTION TO EMPIRICAL ALGORITHMICS [PDF]. Retrieved March 30, 2017, from http://www.sls-book.net/Slides/sls-empalg.pdf
[3] Bostock, M. (2014, June 26). Visualizing Algorithms. Retrieved April 06, 2017, from https://bost.ocks.org/mike/algorithms/
[4] Sarbazi-Azad, H. (2000, October 2). Stupid Sort: A new sorting algorithm. News letter (Computing Science GLASGOW), 599, 4. Retrieved March 31, 2017, from http://sina.sharif.edu/~azad/stupid-sort.PDF
[5] Grune, D. (n.d.). Gnome Sort - The Simplest Sort Algorithm. Retrieved March 31, 2017, from https://dickgrune.com/Programs/gnomesort.html
[6] Hammad, J. (2015). A Comparative Study between Various Sorting Algorithms. International Journal of Computer Science and Network Security, 15(3), 11-16. Retrieved March 31, 2017, from http://paper.ijcsns.org/07_book/201503/20150302.pdf
[7] Pandey, R. C. (2008). Study and Comparison of various sorting algorithms. Thapar University, Patiala. Retrieved March 21, 2017, from http://dspace.thapar.edu:8080/jspui/bitstream/10266/583/3/T583.pdf
Thesis submitted in partial fulfillment of the requirements for the award of degree of Master of Engineering, in Computer Science & Engineering Under the supervision of: Mrs. Shivani Goel, Lecturer, CSED
[8] Mishra, A. D., & Garg, D. (2008). SELECTION OF BEST SORTING ALGORITHM. International Journal of Intelligent Information Processing, 2(2), 363-368. Retrieved March 31, 2017, from http://gdeepak.com/pubs/Selection%20of%20best%20sorting%20algorithm.pdf
[9] Rao, D. T. V. D., & Ramesh, B. (2012). Experimental Based Selection of Best Sorting Algorithm. International Journal of Modern Engineering Research (IJMER), 2(4), 2908-2912. Retrieved March 31, 2017, from https://pdfs.semanticscholar.org/295e/e11e71ff42e4d74dbc83d320d462d4695e67.pdf
[10] Kaur, S., Singh, H., & Singh, P. (2013). COMPARISON BASED IDENTIFICATION OF SORTING ALGORITHM FOR A PROBLEM. International Journal of Advanced Computational Engineering and Networking, 1(1), 67-75. Retrieved March 31, 2017, from http://www.iraj.in/journal/journal_file/journal_pdf/3-18-139082309867-75.pdf
[11] Meolic, R. (2013). Demonstration of Sorting Algorithms on Mobile Platforms. In CSEDU (pp. 136-141). Retrieved March 31, 2017, from http://lms.uni-mb.si/~meolic/papers/meolic-csedu13-extended.pdf
|
 IJCRR
IJCRR 


 This work is licensed under a Creative Commons Attribution-NonCommercial 4.0 International License


