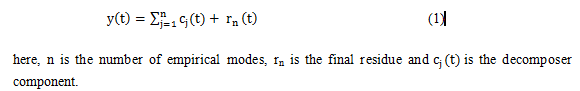
IJCRR - 9(19), October, 2017
Pages: 12-18
Print Article
Download XML Download PDF
Natural Periodic Oscillations Extracted in the Precipitation using Empirical Mode Decomposition and Ensemble Empirical Mode Decomposition methods
Author: S. Jyothi, S. V. B. Rao, P. Kishore
Category: General Sciences
Abstract:Objective: The monthly mean precipitation over India is used to investigate natural periodic wave characteristics using a novel technique of Empirical Mode Decomposition (EMD) and Ensemble Empirical Mode Decomposition (EEMD).
Methods: These two methods empirical mode decomposition and ensemble empirical mode decomposition are interesting approach to decompose the signals into locally periodic oscillations.
Result: The Intrinsic mode functions (IMFs), will easily Identify the Embedded structures, even with those smaller amplitudes. Ensemble Empirical Mode Decomposition is better performed than the Empirical Mode Decomposition technique. The Empirical Mode Decomposition method was observe the mode mixing of two signals in Intrinsic Mode Function, but Ensemble Empirical Mode Decomposition found the distinct and clear peak of each periodic signal in each Intrinsic Mode Function.
Conclusion: In Empirical Mode Decomposition method has 11 Intrinsic Mode Functions and Ensemble Empirical Mode Decomposition has 10 Intrinsic Mode Functions, it is due to the Noise-assisted method to reduce the Intrinsic Mode Function numbers. The decomposed oscillations in Ensemble Empirical Mode Decomposition are above confidence interval and significant, it has 515 iterations than Empirical Mode Decomposition method has 740 iterations. We observe the computational time is lesser in Ensemble Empirical Mode Decomposition than Empirical Mode Decomposition method.
Key Words: Precipitation, Empirical mode decomposition (EMD), Ensemble empirical mode decomposition (EEMD), Periodic oscillations, Lomb-Scargle (LS) spectral analysis
Keywords: Precipitation, Empirical mode decomposition (EMD), Ensemble empirical mode decomposition (EEMD), Periodic oscillations, Lomb-Scargle (LS) spectral analysis
Full Text:
Introduction
Precipitation is probably the most important of the essential climate condition and its crucial role to sustain any form of life on earth as a major source of fresh water, its major impact on weather, climate change, and related issues of society's adaptation. The occurrence of precipitation is highly variable in space and time. Finally, high-quality monthly precipitation data sets across a long-term period are key information for an improved understanding of the global water cycle (Becker et al., 2012).
The spatial and temporal variations of rainfall are important in understanding the hydrological balance on regional and global scales. The distribution of precipitation is also critical for water control in agriculture, power generation and drought-monitoring. Nishant Malik et al., (2011) evaluates the Indian summer monsoon (ISM) rainfall over South Asia is the result of the interaction of several complex atmospheric processes evolving at many different spatial and temporal scales (e.g., Webster 1987). By the influences of the interplay of synoptic scale weather phenomena, the Indian summer monsoon rainfall patterns are also modulated by the steep topography of the Himalayas (e.g., Bookhagen and Burbank 2010). Hence, monsoonal rainfall has highly complex spatiotemporal patterns.
The Indian summer monsoon (June to September) rainfall is essential for the economic development of population, disaster management, hydrological planning for the country by Guhathakurta and Rajeevan (2008). Earlier, Parthasarathy (1993 and 1994) used 306 uniformly distributed rain-gauge stations for construct the precipitation series. Attempts have been to study the annual, seasonal and long-term trends for the Indian region as well as for smaller sub-divisions using rainfall data (Parthasarathy et al., 1993 and P. Kishore et al. 2015).
It is well known that, the rainfall during monsoon season over Indian region exhibits, large spatial, temporal, intra-seasonal and inter-annual variability. It is evident that Indian Summer Monsoon (ISM) exhibits different variations with different periodicities starting from active and breaks period too, intra-seasonal, inter-annual, quasi-biennial oscillation (Rao and Lakhole, 1978), El~Nino Southern oscillation (Shukla and Paolino, 1983), solar cycle (Bhalme and Jadhav, 1984). Their analysis reveals that the annually sampled seasonal data is characterized by near periodic oscillations of 3, 5.8, 11.6, 20.8 and 37 year periods. In general, this variability is extracted from long-term data sets by using different methods like Fourier and wavelet analysis. From the above analysis, the authors have concentrated the only one oscillation but not all.
In this study, we make use of two different methods like empirical mode decomposition (EMD) and ensemble empirical mode decomposition (EEMD) to extract different oscillations present in the long-term rainfall data over Indian region.
Empirical mode decomposition is a form of adaptive time series decomposition method by Huang et al., (1998). Some standard forms of spectral analysis methods like Fourier analysis assume that a time series (either linear or nonlinear) can be decomposed into a set of linear components.
In contrast, the Empirical mode decomposition method does not assume a time series is linear or stationary before analysis, it lets the data speak for themselves. Empirical mode decomposition adaptively decomposes a signal into a set of intrinsic mode functions and a residual component. When the intrinsic mode functions and residual are summed together, they form the original time series (Srikanthan et al., 2011). An inconvenient feature of Empirical mode decomposition is mode mixing, where a fluctuation of given frequency may split across two intrinsic mode functions (Peel et al., 2011a). The adaptive iterative nature of the Empirical mode decomposition algorithm means mode mixing is difficult to avoid without subjectively deciding on the likely nature of any signal to be extracted before analysis. Mode mixing between intrinsic mode functions is problematic, to investigate the significance of intrinsic mode functions, as an expected physical signal may be present but split across intrinsic mode functions. Wu and Huang (2009) proposed as Ensemble Empirical mode decomposition, it is a noise-assisted data analysis method, to overcoming the mode mixing problem in intrinsic mode functions.
In Ensemble Empirical mode decomposition, an ensemble of Empirical mode decomposition trials is obtained by adding white noise to the time series of before the each Empirical mode decomposition run. The intrinsic mode functions and residual from each trial are grouped by intrinsic mode functions order into ensembles, and the intrinsic mode function and residual ensemble averages to form the Ensemble Empirical mode decomposition. Since the white noise is different for each trial of Empirical mode decomposition and its noise cancels out during averaging as the ensemble size increases. However, the noise serves the useful purpose of changing the order of local maxima and minima within the time series, thus different Empirical mode decomposition outcome in each trial is formed. Wu and Huang (2009) believe Ensemble Empirical mode decomposition method provides more physically meaningful intrinsic mode functions and residue than the traditional Empirical mode decomposition method.
We present here different period of oscillations using the Indian Meteorological Department precipitation data. The data from 1901-2010 has been used in the present study. The analysis is expected to provide more information in the periodic oscillations using different spectral analysis techniques. In the next section, a brief description of our data collection of analysis procedure is given below section2. Results and discussion are given in the subsequent section3. Finally, our results are summarised in section 4.
Data and Methodology
IMD Precipitation Datasets
The Indian Meteorological Department (IMD) 1ox1ogridded precipitation datasets of the periods from 1901-2010 over the Indian region (Rajeevan et al., 2006, 2008) is used for the present study. This data analysis and results are organized from 3700 rain-gauge stations over India. Each grid consists of several stations of data and linear interpolation technique (Shepard, 1968) is used to provide the missing data points.
Empirical Mode Decomposition (EMD) technique
The Empirical mode decomposition method was firstly introduced by Huang et al., (1998). The essence of the approach is to empirically perceive the intrinsic oscillatory modes by way of their functional time scales within the statistics to decompose them consequently. Empirical mode decomposition method makes use of local features time scale of the signal, extracting some intrinsic mode functions and residual from the original signal and intrinsic mode function show the local features of the data while the residual component shows the slow change of the signal. The key idea of this method is empirical mode decomposition, and it can make any complex data sets be decomposed for a limited, usually a few numbers of intrinsic mode functions. An intrinsic mode function meet two conditions: (1) In the whole data set, the number of extrema and the number of zero crossings must either equal or differ at most by one. (2) At any point, the mean value of the envelope defined by the local maxima and the envelope defined by the local minima is zero. It is versatile in a broad range of applications for extracting signals from data generated from non-stationary processes (see an example, Huang et al., 2008; Kishore et al., 2012) the decomposition procedure is as follows.
Let the original time series of monthly precipitation data be Po(t). First the upper (E+) and lower (E-) envelopes of local maxima and minima respectively are estimated using a cubic spline interpolation. Next, at each time instance, the mean value of the two envelopes is computed using mo(t)=((E+) + (E-))/2. This mean is subtracted from the original signal to get P1(t)=Po(t)-mo(t). The procedure is repeated until the mean of the envelopes is close enough to zero. If the procedure was repeated n times until to reach the zero-criterion, then Pm(t) would be first intrinsic mode function (IMF1). After the initial intrinsic mode function is found, it is subtracted from the original time series, Po(t), and the procedure is repeated to locate the second intrinsic mode function. The above process is repeated until satisfies above two conditions. The first intrinsic mode function corresponds to the highest frequency component of the signal and lower frequency components are extracted in the subsequent intrinsic mode functions. The last intrinsic mode function always represents the climate average, which remains almost constant.
Ensemble Empirical Mode Decomposition (EEMD) technique
A noise-assisted data analysis method is Ensemble Empirical mode Decomposition (EEMD), represents a major improvement of the Empirical mode Decomposition method, eliminating largely the mode mixing problem and preserving the physical uniqueness of decomposition (Wu et al., 2009). The principle of Ensemble Empirical mode Decomposition is to add white noise, which populates the whole time-frequency space uniformly with the constituent components of different scales separated by filter bank (Flandrin et al., 2004; Wu and Huang, 2004). The Ensemble Empirical mode Decomposition process is explained as follows:
1. Add a white noise series to the targeted data set.
2. Decompose the data with added white noise into intrinsic mode functions using Empirical mode Decomposition.
3. Repeat step 1 and step 2 again and again, but with different white noise series at each time.
4. Obtain the (ensemble) means of corresponding intrinsic mode functions of the decompositions as the final result.
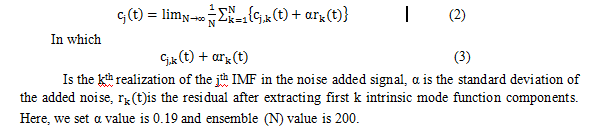
The number of trials in the ensemble N, has to be large. In this study, alpha was set to 0.21 and N was set to 210.
Results
Figure.1 shows that the mean precipitation over India into thirteen intrinsic mode functions can be extracted using empirical mode decomposition (EMD) technique, but only eleven intrinsic mode functions are to the most important components. It can that all intrinsic mode functions exhibit slow varying amplitudes and frequencies. Each intrinsic mode function component denotes the variation of different timescales. investigate the gross characteristics of oscillations with dominant periods, we applied Lomb Scargle (L-S) periodogram analysis to the precipitation data; each intrinsic mode function and resultant amplitude spectral plots at the side of 1. Compared to the other methods, the Lomb Scargle (L-S) method weights the data on a per point basis instead of a per time interval basis (Press et al., 1992). This technique is equivalent to a pure harmonic least-square analysis. The advantage of this method is that the input data do not have to be evenly spaced in (Scargle et al., 1982; Press et al., 1992). Semi-annual and annual oscillations in the mode of intrinsic mode function (IMF2), and mode of intrinsic mode function (IMF3), respectively. These two oscillations with maximum amplitudes of periodicities about 6 and 12 months are observed. The fifth mode intrinsic mode function (IMF5) corresponds to quasi-biennial oscillation (QBO), its periodicity between 20-34 months and the maximum amplitude at around 24 months. The seventh intrinsic mode function (IMF7) has periods (3.8 to 6 and it corresponds to the El-Nino southern oscillation (ENSO) cycle. The IMF7 dominates with maximum amplitudes at ~ and ~6 year periods. The tenth mode of intrinsic mode function (IMF10), a clear peak between 9 and 11 years, and the maximum peak at around 10-year and it corresponds to the solar cycle. The eleventh mode intrinsic mode function (IMF11) corresponds to the oscillations (IDO) and the period oscillates between 18-22 years periods. All these oscillations with 90% confidence level. Agnihotri et al. (2011) also have reported this inter-decadal (16-30 years) variability Total Solar Irradiance (TSI) and Indian rainfall datasets. 6-month and 12-month oscillations, the remaining oscillations quasi-biennial oscillation (QBO), El-Nino southern oscillation (ENSO), solar cycle, and Inter-decadal oscillation in the original time series data set.
From Figure 1, frequent occurrence of mode mixing, which is defined as a single intrinsic mode function either consist of widely scales, or a signal of a similar scale residing in different intrinsic mode function components. To overcome the scale separation issue without introducing a subjective test, a new noise-assisted data analysis (NADA) method, known as ensemble empirical mode decomposition (EEMD), which defines the true IMF components as the mean value of an ensemble number of trials (Wu and Huang et al., 2009). The ensemble empirical mode decomposition (EEMD) method detailed procedure given in Section 3.
This method the input precipitation data to 13 intrinsic mode functions, but we show only the first 10 intrinsic mode functions here in the figure 2 for the clarity of the most components. The semi-annual and annual oscillations in the modes of IMF2 and IMF4. The amplitude of the semi-annual oscillations is smaller than annual oscillations. IMF5 is a mode with a dominant period of 24-28 months, but the peak value is at about 26 , and this mode indicates quasi-biennial oscillation (QBO). IMF6 has with the El-Nino southern oscillation (ENSO) cycle about a year period. The average period of IMF7 and IMF8 corresponds to 132 and 216 months, and these to solar and oscillations. These modes all fall above the confidence interval and therefore are significant. It is worth mentioning here that the decomposed oscillations are fixed intervals than the empirical mode decomposition (EMD). is likely due to the adding the white noise to the Indian meteorological department (IMD) of precipitation data.
Figure 3 and 4 provide a more detailed look at the iterations in empirical mode decomposition (EMD) and ensemble empirical mode decomposition (EEMD) methods using precipitation over India. Box plots describe the statistical distribution of iterations for each intrinsic mode function. The box plots identify the five important statistics on two . Moreover, while in the empirical mode decomposition (EMD) case the total number of iterations is 740, in the case of ensemble empirical mode decomposition (EEMD) is 515 iterations. It is clear that the ensemble empirical mode decomposition (EEMD) method provides less shifting iterations, less computational time for the given time series dataset.
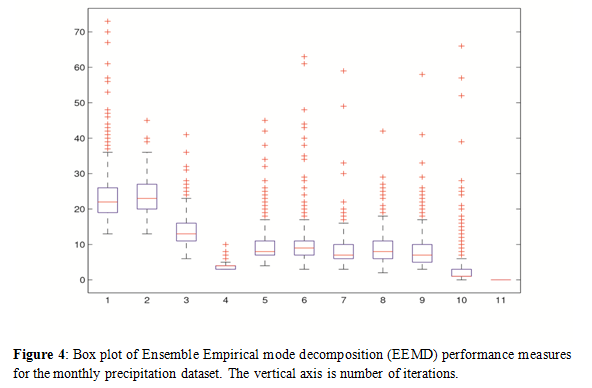
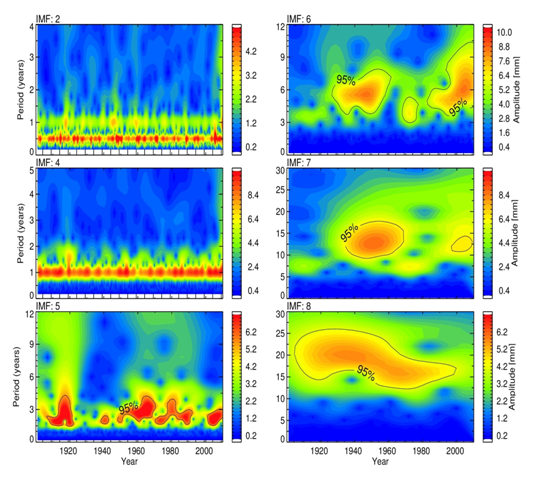
We further applied Morlet wavelet analysis for six dominant periods of intrinsic mode functions in figure 2 are shown in figure 5. In the second intrinsic mode function the presence of wave, and the maximum amplitude at about ~5 mm. In the fourth intrinsic mode functionperiod covers annual periods ~12 months. The annual amplitude (IMF4) is greater than semi annual oscillations (IMF2), fifth intrinsic mode function period covers 23-33 months, and the maximum peak at around 28 months is quasi-biennial oscillation (QBO), the amplitude of 28 months during the periods at 1915-1920, 1960-1972, and 2003-2009.The sixth intrinsic mode function period covers 4-6 year periods is El-Nino Southern Oscillation (ENSO) and extends nearly months period during the observation period, where the maximum amplitudes around 1935-1960, 1995-2005. The dominant oscillation of 9-14 years . The maximum amplitude is at about 10.8 years during the period of 1940-1960. This intrinsic mode function represents a solar cycle. The period of oscillations 16-23 years in IMF8 is Inter-decadal oscillation. The amplitudes in quasi-biennial oscillation (QBO), El-Nino southern oscillation (ENSO), and Annual oscillations in the wavelet analysis.
Discussion
The empirical mode decomposition and Ensemble empirical mode decomposition using to investigate the natural periodic oscillations into two sets over India, first one is semi annual, annual oscillations is small amplitudes and other oscillations are Quasi bi-ennial oscillation and El-Nino southern oscillation is coincided with the IMF1 with an average period of 2.7 years and second mode IMF2 is a dominant period of 5-6 years and the long periods are solar cycle, Inter decadal oscillation are also observed in IMF3 is associated with sunspot cycle of about 11 yearsand fourth IMF is about 20-24 years in all India rainfall using EMD method by Iyenger et al., (2005). The importance of these oscillations are changed the variability of rainfall.
Conclusions
In the present Study, we have investigated the natural periodic oscillations using India Meteorological Department (IMD) precipitation data during the period from 1901-2010. We examine the semi annual oscillation (SAO), annual oscillation (AO), quasi bi-ennial oscillation (QBO), El~Nino southern oscillation (ENSO), inter-decadal oscillation (IDO) periods using Empirical mode decomposition (EMD) and Ensemble Empirical mode decomposition (EEMD) technique. We found mixed mode oscillations in Empirical mode decomposition. The Empirical mode decomposition method a strong mixture of modes, where Intrinsic mode function dramatically changes with no valid reason. This instability can have a dramatic effect on the study of any signal. According to the obtained results, the Ensemble Empirical mode decomposition improves the precipitation intrinsic mode function and offers a simple approach for the stable prediction of non-stationary data. As a future work, it would the possibility of employing different aggregation methods as well as performing an addition and more significant test that exposes more reliable results, may be considering for other datasets.
Acknowledgements
The Authors like to thank all the members of India Meteorological Department (IMD) for providing the high resolution of rainfall datasets. extends her sincere thanks to the UGC, New Delhi for providing the Fellowship during course of work. Thanks to the authorities of Sri Venkateswara University for providing the necessary facilities to carry out this work. Authors acknowledge the immense help received from the scholars whose articles are citied and included in references of this manuscript. The authors are also grateful to the authors / editors / publishers of all those articles, Journals and books from where the literature for this article has been reviewed and discussed. Authors are grateful to IJCRR editorial board members and IJCRR team of reviewers who have helped to bring quality to this manuscript.
Figure captions
Figure1: Time series of monthly mean India Meteorological Department (IMD) precipitation during 1901 to 2010. Intrinsic mode function (IMF) components extracted from Empirical mode decomposition (EMD) method, the first to eleven intrinsic mode functions are shown in left column. Corresponding Lomb-Scargle periodograms are shown in right column. Dashed horizontal line indicates 95% confidence level.
Figure 2: Time series of monthly mean India Meteorological Department (IMD) precipitation during 1901 to 2010. Intrinsic mode function (IMF) components extracted from Ensemble Empirical mode decomposition (EEMD) method, the first to ten intrinsic mode functions are shown in left column. Corresponding Lomb-Scargle periodograms are shown in right column. Dashed horizontal line indicates 95% confidence level.
Figure 3: Box plot of Empirical mode decomposition (EMD) performance measures for the monthly precipitation dataset. The vertical axis is number of iterations.
Figure 4: Box plot of Ensemble Empirical mode decomposition (EEMD) performance measures for the monthly precipitation dataset. The vertical axis is number of iterations.
Figure 5: Contours of wavelet intensities of frequency with time for the precipitation datasets and its six intrinsic mode functions (IMFs) are (2, 4, 5, 6, 7, and 8) as shown in Figure.2.
Figures with captions
Figure1: Time series of monthly mean India Meteorological Department (IMD) precipitation during 1901 to 2010. Intrinsic mode function (IMF) components extracted from Empirical mode decomposition (EMD) method, the first to eleven intrinsic mode functions are shown in left column. Corresponding Lomb-Scargle periodograms are shown in right column. Dashed horizontal line indicates 95% confidence level.
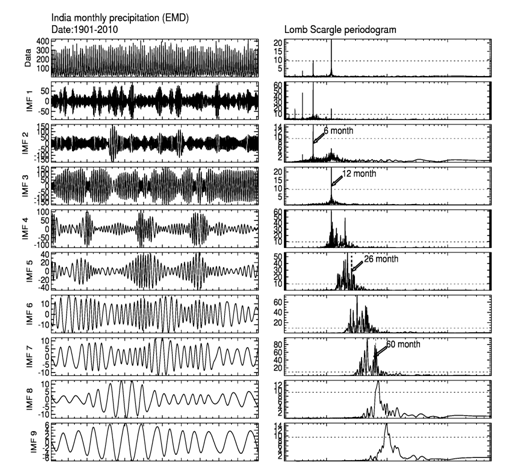
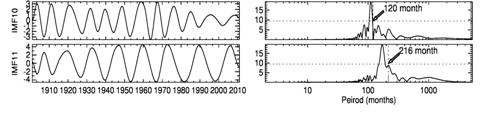
Figure 2: Time series of monthly mean India Meteorological Department (IMD) precipitation during 1901 to 2010. Intrinsic mode function (IMF) components extracted from Ensemble Empirical mode decomposition (EEMD) method, the first to ten intrinsic mode functions are shown in left column. Corresponding Lomb-Scargle periodograms are shown in right column. Dashed horizontal line indicates 95% confidence level.
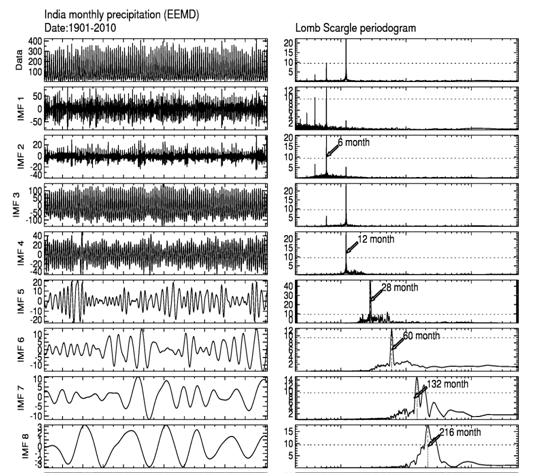
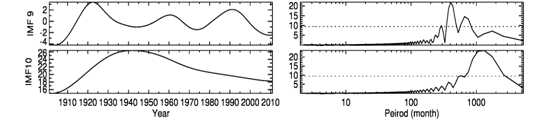 Figure 3: Box plot of Empirical mode decomposition (EMD) performance measures for the monthly precipitation dataset. The vertical axis is number of iterations.
References:
- Agnihotri R, Dutta K, Willie Soon. Temporal derivative of Total Solar Irradiance and anomalous Indian summer monsoon: An empirical evidence for a Sun-climate connection. J Atmos SolTerr Phy. 2011; 7(13):1980-7.
- Becker A, Finger P, Meyer-Christoffer A, Rudolf B, Schamm K, Schneider U, and Ziese M. A description of the global land-surface precipitation data products of the Global Precipitation Climatology Centre with sample applications including centennial (trend) analysis from 1901-present. Earth Syst. Sci. Data Discuss. 2012; 5:921-98.
- Bhalme HN, Jadhav SK. The double (Hale) sunspot cycle and floods and droughts in India. Weather. 1984; 39:112.
- Bookhagen B, Burbank DW. Toward a complete Himalayan hydrological budget: spatiotemporal distribution of snowmelt and rainfall and their impact on river discharge. J Geophys Res. 2010; 115:F03019.
- Flandrin P, Rilling G, Goncalces P. Empirical mode decomposition as a filter bank. IEEE Signal Process Lett. 2004; 11:112-4.
- Huang NE, Shen Z, Long SR, Wu MC, Shih HH, Zheng Q, Yen NC, Tung CC, Liu HH. The empirical mode decomposition and the Hilbert spectrum for nonlinear and non stationary time series analysis. Proc R Soc Lond. 1998; A 454:903-95.
- Huang NE, Wu Z. A review on Hilbert-Huang Transform: the method and its applications on geophysical studies. Rev Geophys. 2008; 46, RG2006, doi: 10.1029/2007RG000228.
- Iyengar RN, Raghu Kanth STG. Intrinsic mode functions and a strategy for forecasting Indian monsoon rainfall. Meteorol Atmos Phys. 2005; 9:17-36.
- Kishore P, Jyothi S, Ghouse Basha, Rao SVB, Rajeevan M. Isabella Velicogna, Sutterley Tyler C. Precipitation climatology over India: validation with observations and reanalysis datasets and spatial trends. Clim Dyn. 2015; doi: 10.1007/s00382-015-2597-y.
- Kishore P, Velicogna I, Venkat Ratnam M, Jiang JH, Madhavi GN. Planetary waves in the upper stratosphere and lower mesosphere during 2009 Arctic major stratospheric warming. Ann Geophys. 2012; 30:1529-38, doi: 10.5194.
- Malik N, Bookhagen B, Marwan N, Kurths J. Analysis of spatial and temporal extreme monsoonal rainfall over South Asia using complex networks. Clim Dyn. 2011; doi: 10.1007/s00382-011-1156-4.
- Parthasarathy B, Munot A, Kothawale D. All-India monthly and seasonal rainfall series: 1871-1993. Theor Appl Climatol. 1994; 49(4):217-24.
- Parthasarathy B, Rupakumar K, Munot AA. Homogeneous Indian monsoon rainfall: variability and prediction. In: Proceedings of the Indian Academy of Sciences (Earth Planetary Sciences). 1993; 102:121-55.
- Peel MC, McMahon TA, Srikanthan R, Tan KS. Ensemble Empirical Mode Decomposition: Testing and objective automation. Proceedings of the 33rd Hydrology and Water Resources Symposium, Brisbane, Engineers Australia.2011a; 702-9.
- Press WH, Teukolsky SA, Vetterling WT, Flannery BP. Numerical Recipes in C: The Art of Scientific Computing, 2nd Edition, Cambridge University Press, Cambridge, 994pp, 1992.
- Rajeevan M, Bhate J, Jaswal AK. Analysis of variability and trends of extreme rainfall events over India using 104 years of gridded daily rainfall data. Geophys Res Lett. 2008; 35:L18707. doi:10.1029/2008GL035143.
- Rajeevan M, Bhate J, Kale JD, Lal B. High resolution daily gridded rainfall data for the Indian region: analysis of break and active monsoon spells. Current Science. 2006; 91: 296-306.
- Rao Raja KS, Lakhole NJ. Quasi-biennial oscillation and summer southwest monsoon. Indian J Meteor Hydrol Geophys. 1978; 29:403-11.
- Scargle J. Studies in Astronomical Time series Analysis. II. Statistical Aspects of Spectral Analysis of Unevenly Spaced Data. Astrophysical Journal. 1982; 263:835-53.
- Shepard D. A two-dimensional interpolation function for irregularly spaced data. In Proc. 1968, ACM Natl Conf 1968; 517-24.
- Shukla J, Paolino DA. The southern oscillation and long-range forecasting of the summer monsoon rainfall over India. Mon Wea Rev. 1983; 111:1830-7.
- Srikanthan R, Peel MC, McMahon TA, Karoly DJ. Ensemle empirical mode decomposition of Australian monthly rainfall and temperature data. 19th International Congress on Modelling and Simulation, Perth, Australia, 12-16 December 2011.
- Webster PJ. The elementary monsoon. In: Js Fein, Stephen PL (eds) Monsoons. Wiley, New York. 1987.
- Wu Z, Huang NE. A study of the characteristics of white noise using the empirical mode decomposition method. Proc R Soc Lond. 2004; A460:1597-1611.
- Wu Z, Huang NE. Ensemble Empirical Mode Decomposition: A noise assisted data analysis method. Adv Adapt Data Anal. 2009; 1:1-41.
- Wu Z, Huang NE, Chen X. The Multi-Dimensional Ensemble Empirical Mode Decomposition Method. Adv Adapt Data Anal. 2009; 01(3):339-72.
|
 IJCRR
IJCRR 


 This work is licensed under a Creative Commons Attribution-NonCommercial 4.0 International License


