IJCRR - 9(3), February, 2017
Pages: 43-47
Date of Publication: 10-Feb-2017
Print Article
Download XML Download PDF
ASSESSMENT OF QUALITY OF LIFE IN NORMAL INDIVIDUALS USING THE SF-36 QUESTIONNAIRE
Author: Ronika Agrawal, Charleen D Silva
Category: Healthcare
Abstract:Context: Quality of life of individuals varies in different cities, countries and continents. It is influenced by lifestyle, infrastructure, emotional and social wellbeing. The Quality of Life (QOL) values of the Western population are available but it cannot be used in Indian setup due to various factors and diversities. It is of utmost importance to know about the quality of life in normal individuals so as to try to aspire to reach those values in the diseased population. Thus, we can try to improve the quality of life in the diseased population.
Aim: To assess the quality of life in normal individuals using the SF-36 Questionnaire
Settings and Design: Permission to carry out the study was taken from the college ethical committee. The study included a consent, assessment form and the SF-36 quality of life questionnaire. Permission for the usage of the questionnaire was procured from OptumInsight Life Sciences, Inc. 400 normal individuals of age group between 35 to 60 years, both males and females not suffering from any disease and educated middle class individuals above 8th grade were included. The exclusion criteria involved psychiatric complications, cerebrovascular disease, cardiovascular diseases, diabetes, neuropathy, chronic joint pain, recent trauma, pregnant females and respiratory diseases.
Methods and Material: A study was conducted using a convenient sampling method and included 400 individuals. The SF-36 questionnaire was used.
Statistical Analysis: Data analysis was done using the SPSS version 14.
Results: The physical component of QOL of individuals between 35-44 years is good in comparison to the other groups. The mental component of QOL is higher in individuals between 35-44 years than in group 54-60 years while group 45-54 years showed poor results. The QOL of males is much better than females both physically and mentally. Education has no effect on the QOL of normal individuals.
Conclusion: The quality of life of middle class Indian population as per SF-36 scoring is around 75 on 100. Mental Component Summary scores are better than Physical Component Summary scores. Quality of Life of males is better compared to females. As aging progresses, QOL reduces. Education has no effect on QOL.
Keywords: SF- 36, Quality of Life Questionnaire, Indian Population, PCS, MCS
Full Text:
INTRODUCTION:
The quality of life is concerned with the living standard of all the members of the family or society. This is the age of competition and everyone is busy with their personal and professional life. More attention is being given to the development of the quality of life. There has been an increased importance given to the patient’s point of view and is an important aspect in the evaluation of health care outcomes.[1] This has resulted in the use of several questionnaire to assess the health related quality of life. [1]
WHO defines health as “a state of complete physical, mental and social wellbeing and not merely the absence of any disease or infirmity”. Any compromise in the physical, mental and social dimensions of health adversely affects the quality of life of an individual.
To measure the quality of life different questionnaires can be used. The questionnaire has to be such that it can rightly judge the quality of life of individuals. Until recently, there were not many pragmatic measures of health related quality of life developed for use in the general community.[2]
The SF-36 instrument is sensitive to changes in the age, social and financial condition and health of the general population.[1]Measuring quality of life is one of several components for determining intervention effectiveness in primary care settings. The effectiveness of health care is comprehensively determined by measures of clinical changes in patient’s condition, indicators of knowledge and self-management, satisfaction with healthcare provision and quality of life.
Quality of life of individuals varies in different cities, countries and continents. It is influenced by lifestyle, infrastructure, emotional and social wellbeing. The values of the Western population are available but it cannot be used in Indian setup due to various factors and diversities.
It is of utmost importance to know about the quality of life in normal individuals so as to try to aspire to reach those values in the diseased population. Thus, we can try to improve the quality of life in the diseased population. We have chosen SF-36 questionnaire for our study as a comparison of a series of different health status questionnaires indicated that the SF-36 is also more reactive to clinical improvement than the other questionnaires tested.
Materials and methods:
Permission to carry out the study was taken from the college ethical committee. The study included a consent, assessment form and the SF-36 quality of life questionnaire. Permission for the usage of the questionnaire was procured from OptumInsight Life Sciences, Inc. 400 normal individuals were included from co-operative housing societies, hostels, colleges. The inclusion criteria comprised of age group between 35 to 60 years, both males and females who were normal and educated middle class individuals above 8th grade. The exclusion criteria involved psychiatric complications, cerebrovascular disease, cardiovascular diseases, diabetes, neuropathy, chronic joint pain, recent trauma, pregnant females and respiratory diseases. Individuals were explained and informed about the study. 396 individuals filled the questionnaire while 4 individuals did not complete due to lack of time. Only after their written consent they were included in the study. The data taken in the assessment form included name, age, gender, occupation, weight, height, BMI, educational qualification, marital status, economic status and whether the individuals were suffering from any disease or were on any medications.
Statistical Methods: With the help of the scoring software granted by OptumInsight Life Sciences, Inc. the scores were calculated. Data analysis was done with the help of SPSS version 14. Anova was used to find the significance. Level of significance was set at 0.05.
Results:
The physical quality of life of individuals between 35-44 years is good in comparison to the other groups. The mental quality of life is higher in individuals between 35-44 years than in group 54-60 years while group 45-54 years showed poor results. The quality of life of males is much better than females both physically and mentally. Education has no effect on the quality of life of normal individuals.
Discussion:
We have done the study to find out the quality of life in normal population using the SF-36 questionnaire. There are various factors that affect the quality of life in normal individuals. The highest score in the SF 36 questionnaire is 100 and the lowest is 0 indicating poor quality of life.
The mean calculated for Physical functioning(PF) is 75.29 and SD is ±22.81. With the advancement in the technology, many individuals live a sedentary life. They avoid participating in any sports and with the availabilities of elevators, they do not climb the stairs. With aging, there is a loss of muscle strength which in turn results in frailty and it affects the person from living an independent life.[3] The hormonal system also shows decreasing circulating hormone concentrations during normal aging process.[4] Physical activity influences the bone density and bone architecture via the load bearing effect on the skeleton( Lanyon 1987, 1993). Thus, regular exercise can help elderly population to be functionally self-reliant( Buchner 1997, LaCroix et al 1993, Nelson et al 1994). The mean of Physical functioning(PF) is 84.2 and SD is ±23.3 in the United States of America population. The scores are higher in comparison to those got by our study. In western countries, from childhood people are involved in many extra-curricular activities like skating, playing golf, skiing etc and are more physically active.
The mean calculated for role of Physical health (RP) is 78.59 and SD ±31.84 which indicates it as a good score. The mean of Physical health (RP) in United States of America population is 80.9 and SD ±34. There is hardly any difference between the two scores.
The mean calculated for bodily pain(BP) is 73.80 and SD ±21.28 The factors that affects the BP score may be pain due to overuse, poor posture, muscle strain, repetitive stress injury, injury to muscles, ligaments and also the intervertebral discs that supports the spine. As age progresses degenerative changes in the joints also leads to pain. The mean of bodily pain(BP) in United States of America population is 75.2 and SD is ±23.7 which is less than the Indian population.
General health (GH) reflects the individual’s perception of his/her health and his/her attitude towards life. The mean calculated for GH is 73.30 and SD is ±17.77 Health has fundamentals without which no drugs, surgeries will be effective. The fundamentals factors affecting health are good nutrition, exercise, adequate hydration, proper sleep, proper hygiene, sunlight, emotional and spiritual aspects.[5] Negative health consequences associated with retirement have not been demonstrated. Infact some benefits are seen primarily in the psychological domain and in health domain (Gall et al., 1997; Midanik et al., 1995; Osteberg and Samuelsson 1994; Salokangas and Jowkamaa, 1991). The mean of GH in United States of America population is 71.9 and SD is ±20.3 which is almost similar to the Indian population.
Vitality (VT) includes lively feeling, energy, tiredness etc. The mean calculated for Vitality (VT) is 70.53 and SD is ±17.06. Individuals feel more tired and worn out and have difficulty with work of other daily activities due to their physical health and emotional problems. The mean of Vitality (VT) in United States of America population is 60.9 and SD is ±20.9. There is quite a lot of difference in the scores in comparison to the Indian population. This shows that Indian population is more energetic.
Social functioning (SF) interferes with an individual’s social activities like visiting friends, relatives etc. The mean calculated for SF is 75.07 and SD is ±22.28. Factors affecting this score are alcoholism and lack of close ties or bondage with others[5] Alcoholism reduces the health related quality of life in normal individuals [7]The mean of Social functioning (SF) in United States of America population is 83.3 and SD is ±22.7. In foreign countries people live a more extrovert type of life and they are involved in more physical activity. Being out of home on weekend’s leads to social interaction and bonding.
Role of emotional wellbeing (RE) includes problems faced by an individual with work or any other regular daily activities as a result of any emotional problems (such as feeling depressed or anxious). The mean calculated for RE is 78.28 and SD is ±31.38 The mean of Role of emotional wellbeing (RE) in United States of America population is 81.3 and SD is ±33 which is similar to the Indian population. A person’s emotional and social wellbeing can form from their friends, family, sense of belonging, self- image, education and childhood. These factors can shape how a person feels about self and how their friends and family see them. Peoples love and support can boost an individual’s self- confidence and help the individual become happier. If someone is lacking in these areas, this will lower their wellbeing and they will find it hard to have the potential to grow and have a good wellbeing.
Mental health (MH) includes nervousness, feeling of blue or sad, happy, peaceful etc. The mean calculated for Mental health (MH) is 78.11 and SD is ±17.34 This score seems to be good. As on the large scale people are highly educated thus are able to cope up with the daily stress and probably have a good mental health. The mean of Mental health (MH) in United States of America population is 74.7 and SD is ±18.1 which is less in comparison to the Indian population. Indian people are more mentally stable and happy. They have less mental issues in comparison to the western population.
Physical wellbeing depends upon age, mobility, sleep, diet, exercise routine and environment. These are the physical needs to keep the body healthy and happy with no limitations. These physical factors will help maintain an individual’s physical needs and wellbeing.
The Physical Component Summary(PCS) calculated mean is 47.87 and SD is ± 8.17 and Mental Component Summary(MCS) calculated mean is 51.63 and SD is ±8.55. While the United States of America population values for Physical Component Summary(PCS) mean is 50 and SD is ±10 and the Mental Component Summary(MCS) mean is 50 and SD is ±10. Studies published in the past decade demonstrate the health benefits of prayers. Studies show that mortality and quality of life among those frequently attending community services are partly because of improved health practices and partly because of increased social contacts due to meeting every day. [6-9]
The quality of life in males is higher in comparison to females. At workplace men hold higher posts and females are more likely to experience job insecurity, lack of autonomy and less supervisor support, including in relation to work-life balance [10].Women are highly prone to depression than men. The depression in women is high, because of environmental factors. The environmental factors include the gender bias and identity roles.[11] Various hormonal reduction like estrogen also causes harmful effects in women such reduction in the bone density, cardiovascular diseases etc. Non-communicable diseases like cardiovascular diseases, cancers and chronic respiratory diseases strike women at an earlier age in less developed countries. [12]
According to our study, as aging progresses there is a reduction in the quality of life. Age group of 35-44 years has a better quality of life in comparison to the age group of 45-54 years and 55-60 years. Physically unhealthy days increased with age. Mentally unhealthy days decreased with age in the older groups. Limitation of activity refers to a long-term reduction in a person’s ability to do his or her usual activities. The limitations are caused by physical, mental or emotional problems.
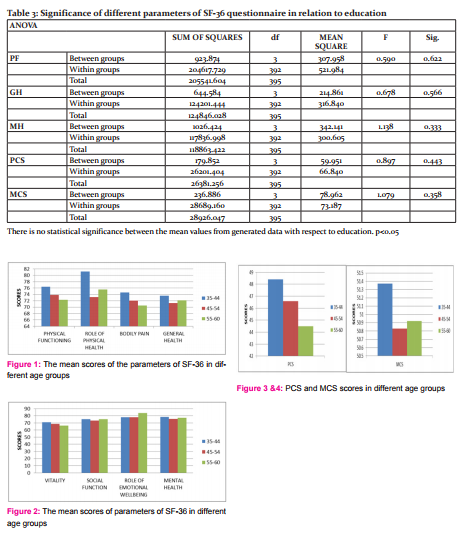
There is no statistical significance between the mean values and any of the parameters of the quality of life with respect to education. According to our study, education has no role or effect in the quality of life of an individual.
CONCLUSION
The quality of life of middle class Indian population as per SF-36 scoring is around 75 on 100. Mental Component Summary scores are better than Physical Component Summary scores. Quality of Life of males is better compared to females. As aging progresses, quality of life reduces. Education has no effect on quality of life.
ACKNOWLEDGEMENT
Authors acknowledge the immense help received from the scholars whose articles were cited and included in references of this manuscript. The authors are also grateful to authors / editors / publishers of all those articles, journals and books from where the literature for this article has been reviewed and discussed. We would also like to thank all our participants for their valuable time and participation.
Financial Support: None
Conflict of Interest: None

References:
- Wilma M. Hopman et al., Canadian normative data for the SF-36 health survey CMAJ. 2000 Aug 8; 163(3): 265–271. PMCID: PMC80287
- Ronan A. Lyonset al., Measuring health status with the SF-36: the need for regional norms. Journal of Public Health Medicine. Vol. 17, No. 1, pp. 46- 50
- Brown et al., Relationship between muscle strength and physical function USDHHS, 2000.
- Lamberts SWJ, Van Den Beld AW, Van Der Lely AJ. The endocrinology of aging. Science 1997:278: 419–424
- Health for All: A Congregational Health Ministries Resource, Health and Welfare Ministries, General Board of Global Ministries, The United Methodist Church (New York: GBGM, 1997)
- Strawbridge et al, Frequent attendance at religious services and mortality over 28 years. Am J Public Health. 1997 Jun;87(6):957-61.
- Idler and Kasl, 1992. Religion, disability, depression, and the timing of death. AJS 1992;97:1052–79
- Susan K Lutgendorf et al, Religious Participation, Interleukin-6, and Mortality in older Adults. Health Psychology, 09/2004;23(5):465-75.
- Idler and Kasl, 1997. Frequent religious attendance predicted better physical function 8–12 years later. U.S Department of Health and Human Services
- Lippe, T. van der et al. (2009). Final Report Quality of Life in a Changing Europe. Deliverable of EU-project Quality, Utrecht: Utrecht University.
- Zender R, et al. Women's mental health: Depression and anxiety. Nursing Clinics of North America. 2009;44:355.
- Gretchen A Stevens et al., Global mortality trends and patterns in older women .Bulletin of the World Health Organization 2013;91:630-639.
|
 IJCRR
IJCRR 


 This work is licensed under a Creative Commons Attribution-NonCommercial 4.0 International License


