IJCRR - 6(6), March, 2014
Pages: 36-43
Print Article
Download XML Download PDF
A STUDY OF ANTHROPOMETRIC INDICES BETWEEN HYPERTENSIVE AND NORMOTENSIVE ADULTS
Author: Ramya K., Jai Ganesh K., Mukundan A.
Category: Healthcare
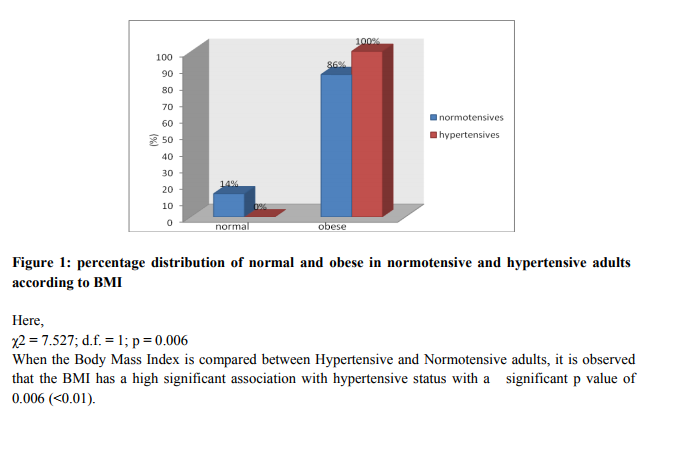
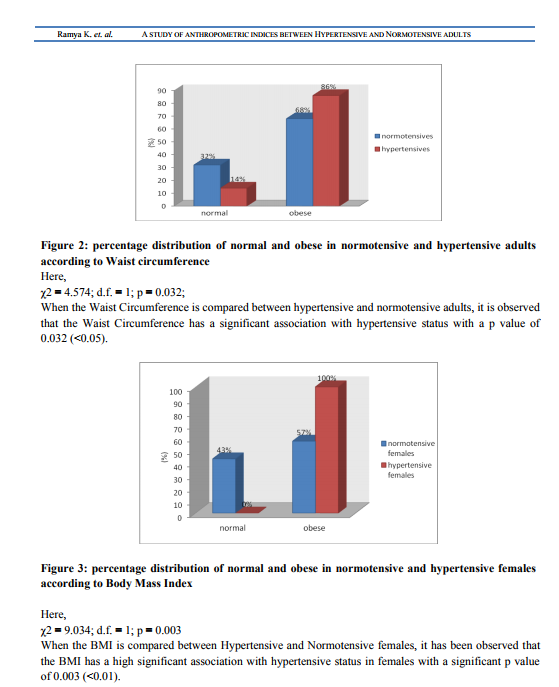
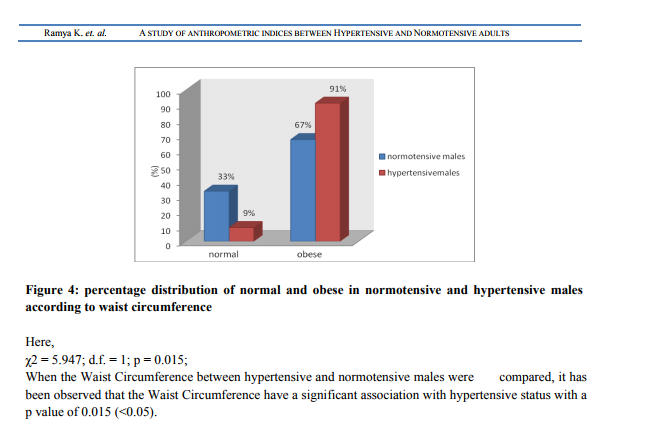
Abstract:Background: Hypertension is the most common cardiovascular disorder affecting 20% of adult population worldwide. Obesity is considered as the main risk factor for hypertension .Simple clinical anthropometric measurements of obesity may be conveniently used to assess regional adiposity, which serves as indicators for Hypertension. Aim: To establish the correlation of Waist Hip Ratio, Body Mass Index and Waist Circumference between Hypertensive and Normotensive status in adults between the age group of 45-55 years of both genders. Methods: This is a clinical based case control study. The subjects were selected according to the inclusion and exclusion criteria with a sample size of 100, using a pretest proforma. Blood Pressure, weight, height, waist circumference and hip circumference were measured for each participant, using standard methods. Then the data obtained was analyzed using Fisher's exact test and Chi Square Test. Results: BMI and Waist Circumference were found to have significant association with hypertension, with a p value of 0.006 and 0.032 respectively, irrespective of the gender. BMI and Waist Circumference showed significant association in women (p=0.003) and in men (p=0.015) respectively. Conclusion: Association between these anthropometric measures and hypertensive status proves obesity to be a major pathological factor in the development of hypertension.
Keywords: Hypertension; Obesity; Anthropometric indices
Full Text:
INTRODUCTION
Hypertension is one of the most prevalent cardiovascular disorders affecting 20% of adult population worldwide, with a myriad of health complications that might lead to fatal consequences. Normal systolic blood pressure is 100-120 mm of Hg and the diastolic blood pressure is 70 -90 mm Hg and those readings above these are graded into pre hypertensive (120- 139 /80-89)and hypertensive conditions(140/90) 1 . In India, prevalence of hypertension ranges from 20-40% in urban adults and 12-17% among rural adults. The number of people with hypertension is projected to increase from 118 million in 2000 to 214 million in 2025, with nearly equal numbers of men and women.2 Even though hypertension results in many complications, it is considered as the primary risk factor for stroke, ischemic heart disease and cardiovascular disease mortality2,3. Hypertension can either be essential type or may occur secondary to many diseases. But age and obesity are considered as the main risk factors 4 .The above fact is supported by the data from the Framingham Cohort study, which states that obesity accounts for 78% and 65% of essential hypertension in men and women, respectively.5 Obesity is first of the “disease of civilization” to appear 6 , which has increased rapidly by urbanization, westernization, rapid economic development and unhealthy lifestyles. Based on data from the 2007 National Family Health Survey.19.8% of males and 24.4% of females are obese. Thus the past few decades had witnessed the soaring rates of obesity and its co morbid consequences7 .A study conducted by the World Health Organization has estimated the presence of more than 1 billion overweight and at least 300 million adults worldwide who are clinically obese and they are estimated to increase further by the year 2015 8 . It is one of the major modifiable risk factors for hypertension; and the relationship between Hypertension with body fat distribution has been demonstrated by various studies5 . So, obesity should no longer be simply considered only as a marker of cardiovascular risk but should be regarded as an important and primary contributor to the pathophysiology of hypertension9 . Especially, the central obesity plays a major role in triggering complications of Hypertension10 . Even though assessment of obesity is done by various clinical tests accurate quantification of body fat compartments requires imaging techniques, which are relatively expensive and impractical for routine clinical settings or largescale studies11 . Therefore, simple clinical anthropometric measurements such as waist circumference (WC), waist-to-hip ratio (WHR) and body mass index (BMI) may be conveniently used to assess regional adiposity, which correlates reasonably well with some of adiposity measures using imaging techniques 12. And these anthropometric measures have been used by many epidemiological studies to define obesity 13 . Though controversies exist for their reliability, the above mentioned parameters served as effective epidemiological equipment in assessing the relationship between obesity and hypertension for many researchers. Therefore, this study was structured with the intent to establish the relationship existing between obesity and hypertensive individuals and it is also compared with normotensive individuals.
MATERIALS AND METHODS
This study was conducted at Mahatma Gandhi Medical College and Research Institute, Pillaiyarkuppam, Pondicherry. The subjects were chosen from the Outpatient Medicine department and Master Health Check-up during January 2010 to May 2011. Sample size of this study was 100 including both male and female. Among which 50 are cases (hypertensive) and 50 are controls (normotensive), selected between the age group of 45 to 55years.Individuals with history of smoking, intake of drugs which influences lipid metabolism, upper abdominal surgeries, Diabetes Mellitus, Cardiovascular Disorders, Endocrinological Disorders and family history of hypertension were excluded from the study. Institutional Ethical Committee clearance was obtained before conducting the study. The purpose of the study was explained to the individuals and written consent was taken from the participants who had willingness, in both English and Regional languages. Following which, all the participants of the study were interviewed by using pre-test proforma. And the subjects were selected according to the inclusion and the exclusion criteria of the study. Then the following procedures were done: After giving a supine rest of 5 minutes to the subject, blood pressure was measured in supine position by using Mercury Sphygmomanometer. The pressure at which korotkoff’s sound was first heard [phase-I] was taken as systolic blood pressure and the pressure at which the sound disappeared [phase V] was taken as diastolic blood pressure11. Blood pressure was measured 3 times. The average of second and third reading was taken as systolic and diastolic blood pressure 11 . Height was measured to the nearest 0.1 cm, while the subject was standing in erect position with bare feet on flat floor against a vertical scale and with heels touching the wall and head straight at the OPD 11. Body Weight was measured using Bathroom weighing scale, while the subject was minimally clothed and without shoes, standing motionless on a weighting scale and it was recorded nearest to 0.1 Kg, at the OPD 11. Body Mass Index was calculated using the Quetlet’s index14 .Then the participants of the study were classified into normal and obese, according to the BMI. Revised WHO Criteria for Asian Indians 14 was used for this categorization. Waist Circumference (in cms) was measured at a point mid-way between the lower rib and iliac crest with the measuring tape centrally positioned at the level of the umbilicus 14.It is the average of two measurements one taken after inspiration and the other taken after expiration in standing position. Hip Circumference was measured (cms) over light clothing at the trochanter major of the Head of femur 14. And Waist Hip Ratio is taken as the ratio of waist circumference to the Hip Circumference.
Statistical analysis
Statistical analysis was done using Fisher’s exact test and Chi Square Test. They were analyzed using the p-value obtained.
RESULTS
From the analysis done, it was found that no association exists between Waist Hip Ratio and Hypertensive status. According to Waist Hip Ratio, individuals are classified into normal and obese. In this study all the subjects inclusive of 50 hypertensive and 50 normotensive individuals were found to be obese, irrespective of the gender.
DISCUSSION
Obesity is considered as a primary contributor to the pathophysiology of hypertension. Clinically, Obesity is evaluated clinically by anthropometric indices like BMI, Waist Circumference and Waist Hip Ratio. Observation similar to our results was found by Jung C, who established that BMI was a good predictor of Hypertension 15.In addition, two other previous studies conducted by Kaur P during 2008 and Koh-Banerjee P during 2004 has similar findings. They showed that increased BMI and waist circumference are strongly associated with cardiovascular disease risk factor such as hypertension in many populations 16, 17 . In contrary, Theodore A K during 2008 conducted a study on the Africans and Americans; found that the indices of obesity correlated well with normotensive than with hypertensive18 . Unlike the above parameters, WHR had no significance in establishing the relationship between hypertensive status and obesity in our study which is in accord with the findings of Kaur P during 2008 and Koh-Banerjee P during 2004 16, 17. Whereas, association was observed for WHR, in the studies of Mohan V and Tiffany G during 2004 which contradicted our study results 19, 20. Esmaillzadeh A in 2004 found a similar contradictory observation with WHR serving a better predictor for cardiovascular risk factors than BMI, WC and WHtR 21 . It was also observed that, parameters individually had gender selective significance rates. Body Mass Index and Waist Circumference correlated significantly among female and male Hypertensive respectively. The above mentioned result was supported by a study conducted in Japan, which showed, waist Circumference to have strongest association with BP and its prevalence in men and BMI had the strongest association with BP and its prevalence in women 22.And Esmaillzadeh A in his study during 2004 observed WHR to be a better predictor in male 21, which contradicted our study result. The anthropometric studies conducted by Rocchini, 2002 demonstrated, that Central obesity is often referred to as android obesity and gynoid obesity in males and females respectively; where there is preferential fat accumulation in the gluteal and femoral distribution, which can be measured by Waist Circumference and Waist Hip Ratio11. This study supported our result of Waist Circumference to be good predictor in male and contradicted our result of BMI to be good predictor in females. Majority of all the studies, which showed observations inclusive of both the supportive and contradictory facts were targeted with the same aim. The aim was nothing but the proven fact that, the obesity leads to hypertension and the various indices of obesity have greater predilection for hypertension. And this is clinically evident by many factors, which act together to promote vasoconstriction and sodium retention 23. Increased levels of leptin, free fatty acids and insulin in obesity enhances the sympathetic activity in a mutual way resulting in vasoconstriction due to increased vasoconstrictor tone. In addition, obesity-induced insulin resistance and endothelial dysfunction acts in a combined manner to magnify the vasoconstrictor response. Finally, increased renal tubular reabsorption of sodium may also occur, caused by an increased renal sympathetic nerve activity, the direct effect of insulin, hyperactivity of the renin-angiotensin system and possibly by an alteration of intrarenal physical forces. All together, these factors will lead to sustained hypertension. Variations in the results when compared with other studies that have assessed cardio metabolic risk factors in relation to the indices of adiposity may be attributable to differences in ethnicity, age, and gender distributions of participants across study populations. The above fact about the role of obesity in the development of hypertension was supported by a study conducted in Chennai by Mohan V during 2006 19 and various other studies. In our study, it is observed that majority of hypertensive were obese when compared to normotensive, which stresses the fact that hypertension could have resulted from obesity, as the other predisposing factors such as smoking, personal habits, family history and other medical, surgical and Endocrinological causes were excluded. Therefore, it could be established that obesity is one of the most common causes of the multi etiologic condition, “the hypertension”. The unequal recruitment of male and female subjects was due to the short available recruitment time and subject unavailability. Findings of the present study, suggests the need for larger population and increased duration for accurate results.
CONCLUSION
Our study serves as a reaffirmation, for the proven fact that obesity leads to hypertension. Body Mass Index and Waist Circumference were found to have significant association with hypertensive adults in the present study. Thus, these parameters in all their variations have proved themselves effective in establishing the linear relationship between Obesity and Hypertension. Personal habits, socioeconomic status and psychosocial factors play a major role in the development of complications of hypertension, when compared with other causes like race, ethnicity, or genetics. Obesity being a modifiable factor, life style modifications including increased physical activity and dietary modifications can decrease the incidence of hypertension and its outcomes
ACKNOWLEDGMENT
I acknowledge the immense help received from the scholars whose articles are cited and included in references of this manuscript. I am also grateful to authors / editors / publishers of all those articles, journals and books from where the literature for this article has been reviewed and discussed. And I also thank Dr.Tamilselvan, Assistant professor, Department of Physiology, Sri Venkateswaraa Medical College, Hospital & Research Center, Pondicherry, for his immense help during the work.
References:
REFERENCES
1. WHO, The World Health Report 1997. Hypertension, P 39-45.
2. Reddy KS. Regional case studies–India. Nestle Nutr Workshop Ser Pediatr Program. 2009;63:15-24; discussion 41-16, 259-268.
3. He FJ, Macgregor GA. A comprehensive review on salt and health and current experience of worldwide salt reduction programmes. J Hum Hypertens 2009; 23:363- 84.
4. Wrobel MJ, Figge JJ, Izzo JL Jr.Hypertension in diverse populations: a NewYork State Medicaid clinical guidance document. J Am Soc Hypertens. 2011 Jul-Aug;5 (4):208-29.
5. Aien khan Afridi , Alam Khan .Prevalence and Etiology of Obesity – An Overview Pakistan Journal of Nutrition Year: 2004: 3(1): 14-25.
6. Trowell HC Burkitt DP Western Diseases: Their Emergence and Prevention(1981).
7. Third National Family Health Survey. Mumbai: International Institute for Population Sciences. 2006.
8. WHO Consultation 2000: Prevalence and Etiology of Obesity-An overview
9. Bogaert YE, Linas S.The role of obesity in the pathogenesis of hypertension. Nat Clin Pract Nephrol. 2009; Feb;5(2):101-11.
10. Roopakala MS, Suresh A, Ashtalakshmi, Srinath, Ashok, Giridhar, Anand, Silvia WD. Anthropometric measurements as predictors of intraabdominal fat thickness. Indian J Physiol Pharmacol. 2009 Jul-Sep;53(3):259-64.
11. D.B. Tambe, A.V. Phadke, J.S. Kharche, A.R. Joshi. Correlation of blood pressure with Body Mass Index and Waist to Hip Ratio in middle aged men. Journal of Medical Update : July, 2010.
12. D.C. Chan, G.F. Watts, P.H.R. Barrett and V. Burke.Waist circumference, waist-to-hip ratio and body mass index as predictors of adipose tissue compartments in men. An International Journal of Medicine.2003 Jun ; 96(6): 441- 447.
13. Zhou Z, Hu D,Chen J.Association between obesity indices and blood pressure or hypertension: which index is the best? Public Health Nutrition. 2009; 12:1061-71.
14. World Health Organisation Expert Committee 1995. Physical Status: The Use and Interpretation of Anthropometry. Technical Report Series No. 854, World Health organisation, Geneva 427-438.
15. Jung C, Fischer N, Fritzenwanger M, Figulla HR. Anthropometric indices as predictors of the metabolic syndrome and its components in adolescents. Pediatr Int. 2010 Jun;52 (3):402- 9.
6. Kaur P, Radhakrishnan E, Sankarasubbaiyan S, Rao SR, Kondalsamy-Chennakesavan S, Rao TV, Gupte MD.A comparison of anthropometric indices for predicting hypertension and type 2 diabetes in a male industrial population of Chennai, South India. Ethn Dis. 2008 Winter;18 (1):31-6.
17. Koh-Banerjee P, Wang Y, Hu FB, Spiegelman D, Willett WC, Rimm EB: Changes in body weight and body fat distribution as risk factors for clinical diabetes in US men. Am J Epidemiol 2004, 159:1150-1159.
18. Theodore AK, Clarence EG, Jane MK, Shanthi K, Hongyan Y, Raymond GH and Emily LM. Altered Relationship of Blood Pressure to Adiposity in Hypertension. American Journal of Hypertension (Feb 2008).
19. Mohan V, Deepa R. Obesity and Abdominal Obesity in Asian Indians. Indian J Med Res. 2006; 123: 593-596.
20. Tiffany G , Catherine C, Anne T, Richard R, David W and Patrick P. Body mass index, waist hip ratio, and waist circumference: which measure to classify obesity? Journal Social and Preventive Medicine 2003, June:48 (3).
21. Esmaillzadeh A, Mirmiran P and Azizi F. Waist-to-hip ratio is a better screening measure for cardiovascular risk factors than other anthropometric indicators in Tehranian adult men. International Journal of Obesity.(2004) 28, 1325–1332.
22. Masaru Sakurai, Katsuyuki Miura, Toshinari Takamura, Tsuguhito Ota,Masao Ishizaki, Yuko Morikawa, Teruhiko Kido, Yuchi Naruse and Hideaki Nakagawa.Gender Differences in the Association between Anthropometric Indices of Obesity and Blood Pressure in Japanese. Hypertension Research (2006) 29, 75–80.
23. Keith SW, Redden DT, Katzmarzyk PT, et al. (2006)."Putative contributors to the secular increase in obesity: Exploring the roads less traveled". Int J Obes (Lond) : 2006:30 (11): 1585-94.
|
 IJCRR
IJCRR 


 This work is licensed under a Creative Commons Attribution-NonCommercial 4.0 International License


