IJCRR - 9(9), May, 2017
Pages: 06-08
Date of Publication: 15-May-2017
Print Article
Download XML Download PDF
Electrical properties of Co-Zn ferrite Doped with Silicon
Author: S. S. Shinde
Category: General Sciences
Abstract:Ferrites of the composition Co0.7+x Zn0.3 Six Fe2-2x O4 (x = 0.0, 0.1, 0.15, 0.2, 0.25, 3, 4) are prepared by double sintering ceramic method. X-ray diffraction patterns of all the samples show cubic spinal phase. By comparing the calculated and observed X-ray intensity ratios I220/I400 and I400/ I422 and using site preference of various ions, the cation distribution of the present system is determined. At lower concentration of Si up to x = 0.15, the dc resistively (ρdc) increases and for x > 0.15, ρdc is found to decrease. With increase in temperature, dc resistively decreases except for higher concentration of Si (x = 0.3 and 0.4) which show increase in resistivity at lower temperature. Activation energy values show one to one correspondence with resistivity values. Curie temperature is found to decrease with increase in Si concentration.
Keywords: Lattice Parameter, D.C. Resistivity, Activation Energy
Full Text:
INTRODUCTION
Studies of spinel ferrites are highly relevant to modern technologies. So that the synthesis of ferrites have become an important part of modern ceramic research. Cobalt-Zinc ferrite is one of the soft ferrites used in electronic devices such as transformer core, electric motors and generators. It is observed that incorporation of diamagnetic, tetravalent and pentavalent ions in the ferrites sufficiently improves their electrical properties. To increase the resistivity and develop the desired microstructure, tetravalent ions like Ti, Sn and Si are substituted in mixed ferrites. It is observed that the resistivity increases with increase in Si4+ content in Ni-Cd ferrite [1]. The addition of tetravalent ions like Ti and Si in Co-Cd mixed ferrite have been studied to understand the role of these ions on the physical properties of ferrites [2]. In our previous study we have reported electrical and dielectric properties of Si substituted Co ferrite [3]. As an extension of this work, present paper reports the effect of Si4+ substitution on electrical properties of Co-Zn mixed ferrite.
MATERIAL AND METHODS
The ferrites with chemical formula Co0.7+xZn0.3Six Fe2-2xO4 (Where x = 0.0, 0.1, 0.15, 0.2, 0.25, 0.3, 0.4) were prepared by standard double sintering ceramic technique. AR grade oxides Fe2O3, CoO, ZnO and SiO2 were thoroughly mixed in required proportions. The samples were then presintered at 7000c for 12 hr in air medium and slowly cooled to room temperature. The presintered powder was milled and sieved to a fine powder. Pellets were prepared by subjecting a small quantity of powder to a pressure of about 12 x 106 kg/m2 by keeping it in a die of diameter 1cm and these pellets were finally sintered at 10500C for about 24 hr in air medium. Cooling to room temperature was carried out at the rate of 800c per hr.
The structural and physical properties of the prepared samples were determined by X-ray powder diffractometry technique. The X-ray diffraction patterns were recorded on a diffractometer PW710 using Cu-K radiation of wavelength 1.54060 A0 in the range of 2q = 100 to 900 and scanning rate of 10 per minute.
The temperature and composition dependence of dc resistively (rdc) of all samples was studied by two probe method. For good electrical ohmic contact the pellets were polished and silver pasted on both the surfaces.
RESULTS
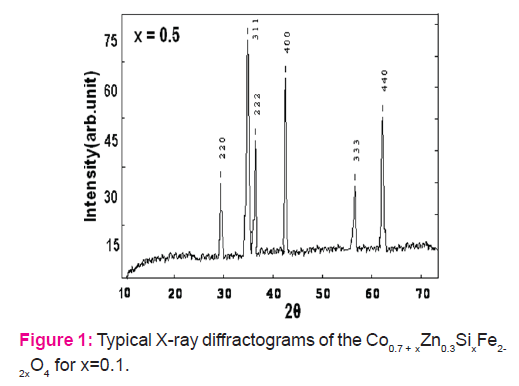
The room temperature X-ray diffraction patterns of all the samples of the present series confirm the single phase formation of spinel. Typical X-ray diffraction patterns of the samples with Si concentration x = 0.2 and x = 0.4 are shown in Figure.1. The values of lattice constant ‘a’ listed in Table 1 show slow decrease with increasing Si content from x = 0.1 to 0.4.
According to site preference clergies given by Miller [5], Fe3+ ions get statistically distributed over B-site and A-site, Co2+ has a strong preference on B-site and Zn2+ has strong preference for A-site. Also it is reported that Si4+ ions have strong preference to A-site [6]. X-ray intensities were calculated using the formula suggested by Buerger [7]
Ihkl = | Fhkl |2 P Lp
where notations have their usual meanings. By comparing the calculated and observed X-ray intensity ratios I220/I400 and I400/ I422 and using the above stated site preference of various ions, the cation distribution of the present system can be written as
For x = 0.0 (Zn0.3 Fe0.7 ) [Co0.7 Fe1.2]
For x = 0.1 to 0.4 (Co0.05 Zn0.3 Si0.05+y Fe0.6-y) [Co0.75+y Si0.05Fe1.2-y]
Where x = 0.1 + y, y = 0.0, 0.05, 0.1, 0.15, 0.2, 0.3
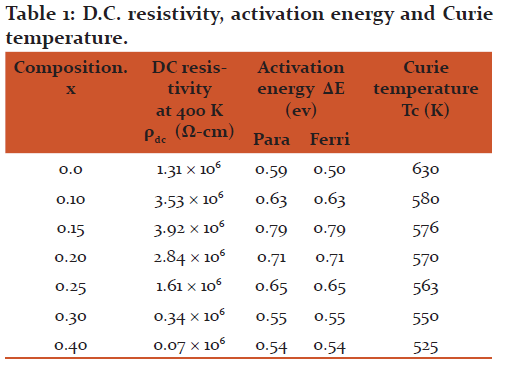
The values of dc resistivity rdc obtained at 400 K are listed in Table 1. It is evident that dc resistively increases with increase in Si concentration up to x = 0.15 and then decreases with increase in x.
The activation energies (Eg) in ferrimagnetic and paramagnetic regions obtained from the plots of Log rdc and temperature are listed in Table1. The activation energy values in the paramagnetic regions are higher than that in ferrimagnetic region. This is in agreement with the theory developed by Irkhin and Turvo [12].
The values of Curie temperature (Tc) determined from the resistivity plots are listed in Table 1. It is evident that the Curie temperature decreases with increasing Si concentration
DISCUSSION
Decrease in lattice constant ‘a’ with increasing Si content from x = 0.1 to 0.4 show that present samples obey Vegard’s law [4]. Usually in a solid solution of spinels within the miscibility range, a linear change in the lattice constants in observed [4]. The linear slow decrease in lattice constant in the present system can be explained on the basis of following facts.
(i)The larger Fe3+ ions (0.64 A0) are replaced by smaller Si4+ ions (0.42 A0) on A site so that ionic radius at A site decreases.
(ii)The smaller Fe3+ ions (0.64 A0) are replaced by larger Co2+ (0.72 A0) on B site so that ionic radius of B site increases.
(iii)The difference in ionic radii of Fe3+ and Si4+ (0.22 A0) on A Site is more than the difference in the ionic radii of Fe3+ and Co2+ (0.12 A0) on B site. Thus decrease in ionic radius of A site is greater than the increase in ionic radius of B site.
Due to complex structural composition of these ferrites, the conduction mechanism can be attributed to a combination of several processes. Fe2+ ions are formed due to partial reduction of small fraction of Fe3+ to Fe2+ ions due to volatilization of Zn at elevated firing temperature during sintering process [9]. In the present system, 2Fe3+ ions are replaced by Si4+ ions and Co2+ ions. Also CoO has an affinity for oxidation resulting in the formation of Co3+ ions. So increasing resistivity of the system with increase of Si content up x = 0.15 may be due to electron – hole compensation.
The decrease in rdc with increase of Si content from x = 0.2 to 0.4 may be attributed to the presence of larger number of cobalt ions on B-site, which favor the hoping mechanism between Co2+ and Co3+ ions. Thus P-type, i.e. hole hoping between Co2+ and Co3+ in predominant conduction mechanism in the ferrites containing higher concentration of cobalt. These observations are consistent with the earlier reported results [10].
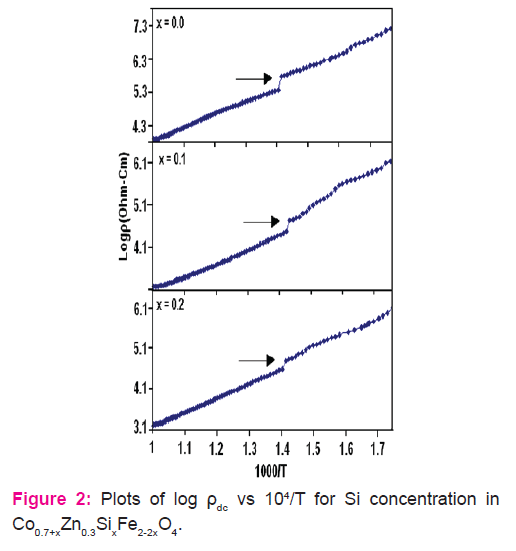
Variation of Logrdc with temperature (Fig.2) show decrease in resistivity with increasing temperature. This indicates semiconductor behavior having negative temperature coefficient of resistance. For higher concentrations of Si with x = 0.3 and 0.4, Log rdc is found to increase with temperature up to about 250 K. (Figure 2.) This anomalous variation of resistively at lower temperature for Si concentration x = 0.3 and 0.4 may be due to ionic drift current. The variation of rdc with temperature can be attributed to current due to electrons in conduction band, current due to electro hoping and ionic drift current [11]. The present results indicate that contribution from ionic drift current is more predominant in the anomalous region of rdc for samples with Si concentration x = 0.3 and 0.4. The ionic contribution becomes negligible at higher temperatures and rdc becomes entirely electronic.
The activation energy (Eg) values are found to correspond to the dc resistivity values of the samples. The plots of Log rdc against reciprocal of temperature show abrupt change in the slope at the transition temperature. The change in the slope of the curves may be due to change in conduction mechanism [13] or it may be due to phase transition..
The decrease in Curie temperature Tc is because of net reduction of Fe3+ ions which reduces the number of active magnetic linkages
CONCLUSION
Decrease in Lattice constant is due to replacement of larger ions by smaller ions. Decrease in X-ray density shows that decrease in mass overtakes decrease in volume of unit cell. Particle size is found to be consistent with the ceramically prepared ferrites. Increase in dc resistivity for lower concentration of Si is due to electron hole compensation while decrease in rdc at higher concentration of Si is due hole hoping between Co2+ and Co3+ ions. The anomalous variation of resistivity for higher concentration of Si is due to ionic drift current.
Acknowledgement
Author acknowledges the immense help received from the scholars whose articles are cited and included in references of this manuscript. The author is also grateful to authors/editors/publishers of all those articles, journals and books from where the literature for this article has been reviewed and discussed.
Conflict of Interest: Author declare no conflict of interest.
References:
1. M.G. Patil, V.C. Mahajan , A. K. Ghatege and S. A. Patil Indian J. of Pure and applied Phy.,34:166:1996
2. V. C. Mahajan , Ph.D. Thesis, Shivaji University, Kolhapur (1995).
3. S. S. Shinde , K. M. Jadhav , Mater Lett.,37: 63: 1998.
4. C. G. Whinfrey , D. W. Eckart, A. Taubar, J.Am. Chem. Soc.,82:2695:1960
5. A. J. Miller, Appl. Phys., 30:248:1959.
6. S.S. Shinde, K.M. Jadhav, G. K. Bichile, B. S. Trivedi and R. G. Kulkarni, Bull. Mat. Sci. 21:409:1998.
7. M. J. Burger J. Crystal Structure Analysis, John Wiley, New York (1960).
8. B. D. Cullity, Elements of X-ray diffraction, Addision Wesely, Reading, Mass, 1959.
9. L. G. Van Uitert, Proc. IRE (USA), 1294 (1956) 1303.
10.A. B. Devale, D. K. Kulkarni, J. Pure and Appl. Phys. 16:697:1978.
11 R. H. J. Waldron, Appl. Phys. (USA), 43 (1972) 1186.
12.Yu.P. Irkin, E.A. Turov, Soviet Phys.JEPT, 33:673:1957.
13.K. R. Krishanamurthy, Thesis I.I.T., Madras (1975).
|
 IJCRR
IJCRR 


 This work is licensed under a Creative Commons Attribution-NonCommercial 4.0 International License


