IJCRR - 7(6), March, 2015
Pages: 15-23
Print Article
Download XML Download PDF
A STUDY OF FOOT DEFECTS, DEFORMITIES AND DISEASES AMONG SHOD AND BAREFOOT MIDDLE AND LONG DISTANCE RUNNERS- CROSS SECTIONAL STUDY
Author: Watson Arulsingh, Ganesh S. Pai
Category: Healthcare
Abstract:Objective: To compare foot defects, deformities and diseases in middle, long distance shod and barefoot Runners. Method: 51 barefoot runners, 61 shod runners and 65 healthy controls were screened for foot defects, deformities and diseases in this study using validated clinical tools. Results: Foot defects vary significantly among the three groups compared as p value was 0.001 showed high significance. When foot deformities are concerned, they vary significantly among the three groups compared as the p value was 0.001. Whereas foot diseases vary significantly among the three groups compared as p value was 0.001. Conclusion: The analysis of this study revealed that the prevalence foot defects, deformities and diseases have been found to be highly significant among three groups.
Keywords: Truncated navicular height, Hallux valgus, Foot infection, Corns, Ingrown toe nail
Full Text:
INTRODUCTION
Millions of runners across world take to the streets, tracks and trails every day. People usually run for health, for fitness, for stress relief and for fun. Despite these differences, all runners are susceptible to foot problems. Common foot and ankle conditions in runners include blisters, foot fungus, heel pain, hallux valgus, rigidus, stress fracture and achilles tendonitis, ankle sprain, neuroma, ingrowing toe nail, black toe, plantar wart and burning foot, corns1,2,3. M.kuchi et al4 observed a significant morphological changes in foot between runners and non runners. Aydog et al5 who had explored the morphological features of foot between runners, wrestlers, weight lifters, hand ball, gymnasts players and non runners reported that arch index of foot had varied significantly between wrestlers ,soccer players, handball players, weightlifters, gymnasts, and non-athletic controls. Morimoto and Okada6 had found long distance runners to have lower dorsal arch than throwers, jumpers and sprinters. They had reasoned it to sports specific mechanical stress, the effects of overall body build for the differences observed in foot morphology between long distance runners and non-athletes. Bertrand 7 (2007) found increased occurrence of hallux valgus over time through his study on historical population in France. Researchers8,9,10 reported that athlete’s foot does not occur among people who traditionally go barefoot. They claimed that wearing shoes could facilitate this problem. Some experts believe that most athletic shoes with inflexible soles, structured sides and super-cushioned inserts keep feet so restricted that they may actually be making your feet lazy, weak and more prone to injury. Doud et al 11 reported out of prospective study that habitually rearfoot strike (shod) had approximately twice the rate of repetitive stress injuries than individuals who habitually forefoot strike (barefoot runners). They found hip pain, knee pain, low back pain, tibial stress injuries, plantar fasciitis, and stress fractures were 2.7 times more likely to occur in rearfoot strikers. Yet their study did not explain reason for this general difference. As a result, barefoot training is gaining more attention among coaches, personal trainers and runners. K. D’Aou et al12 stated that footwear that fails to respect natural foot shape and function will ultimately alter the morphology and the biomechanical behaviour of the foot. Till date there was not a study which has exclusively compared the occurrence of foot deformities, defects and diseases among barefoot and shod runners. Thus the purpose of this study to explore the occurrence of defects, deformities, diseases among shod and unshod long, and middle distance runners.
MATERIALS AND METHODS
Materials used in this study were stadiometer, vernier caliper, weighing scale, goniometer ruler and validated life size photographs of hallux valgus deformity and foot diseases, colour ink, graph sheets, colour marker, pencil, knee hammer, scientific calculator and magnifying glass, Sony camera 16 mega fixal(10 optical zoom) 51 barefoot runners, 65 controls and 61 shod endurance runners overall 177 participants were screened for foot defects, deformities and diseases who fit into inclusion criteria across Dakshina kannda district, Karnataka. Alva’s institutional review board ethical approval was obtained. CTRI registration was done (CTRI/2013/06/003776Medical). Adult long, middle distance shod and barefoot runners with minimum three years of participation and age group between 18 to 55 years and controls of same age group were included. Both genders were included. Individual with congenital deformities of foot, trauma in the feet other than sports related, systemic disease affecting lower limb, having a history of diabetic, gout and any other neurologically affected foot were excluded. Screened foot defects were black toenail, thick toenail, Bunions, neuromas, march fracture, jones fracture. tarsal tunnel syndrome, blisters, corns, callosities, fissures, Ingrown toe nail, calcaneal prominence. Screened foot deformities were overriding toe, hallux valgus, curly toe, hammer toe, hallux flexus, hallux rigidus, pes planes, claw toe, mallet toe, foot splaying, calcaneo varus, calcaneo valgus, forefoot valgus, forefoot varus. Screened foot diseases were plantar warts, tinea pidea and toe nail Fungus. Hypothesis was that whether foot defects, foot deformities and foot diseases vary significantly among these three groups.
METHOD
Three groups were stratified for this study namely shod runners, barefoot runners and controls. Subjects were explained about the benefit of this study and procedure. Then consent was taken.
To Identify Hallux valgus deformity
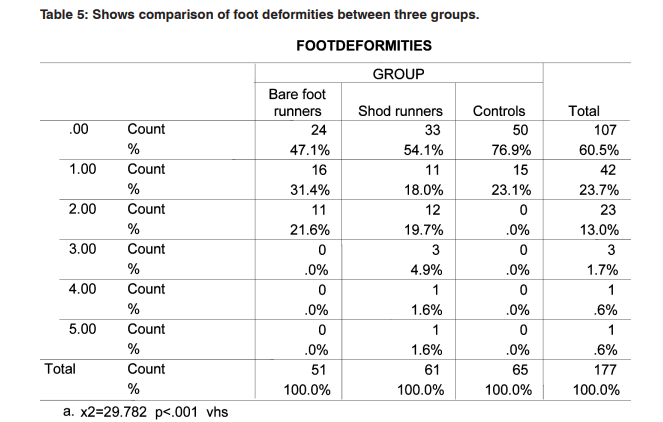
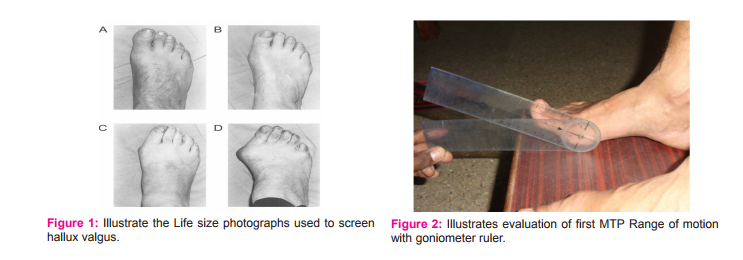
The Manchester Scale13,14 was used to identify hallux valgus deformity. Life-size versions of laminated photographs were used. Subjects were asked to stand on an elevated platform. Life size photographs were kept alongside subject’s weight-bearing feet, and then hallux valgus deformity was confirmed. Figure 1 Illustrate the image of Life size photographs used to screen hallux valgus A. No deformity (grade 1), B. Mild deformity (grade 2), C. Moderate deformity (grade 3), D. Severe deformity (grade4).
To screen hallux rigidus of great toe
Coughlin MJ and his colleague’s criteria to screen hallux rigidus of great toe15 was adapted. To screen hallux rigidus, extension of first MTP (metatarsophalangeal joint) joint was measured with goniometer ruler while foot in plantigrade position. Subject was made to stand on the wooden box while goniometer’s immovable arm was placed parallel to the first metacarpal bone and movable arm placed to the bisection of the proximal and distal phalanx of the great toe. Then subjects were asked to do great toe dorsiflexion (Figure 2). If subject experiences pain with limited (< 450 ) great toe extension, he was sent for radiograph analysis to screen osteophyte formation and changes in MTP joint and was to be diagnosed and conformed by orthopaedic surgeon.
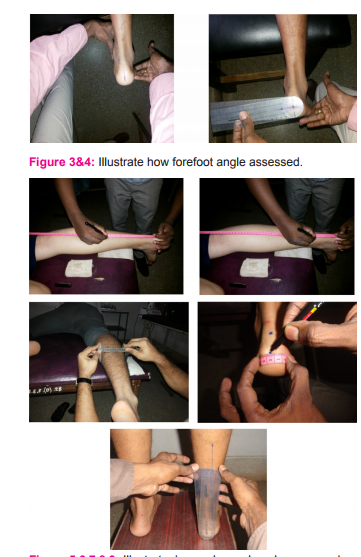
To screen forefoot angle
Kirsten and Irene’s method was used to identify fore foot and rear foot deformities16,17,18 The subject was asked to assume prone lying position with measuring foot and ankle extended approximately 6 inches off the plinth. The opposite extremity will be placed in slight knee flexion and with abduction, flexion and external rotation of the hip. Evaluator’s thumb was used to palpate the medial aspect of the talar head, which is slightly inferior and anterior to the medial malleolus and proximal to the navicular bone of extended foot. The index finger is used to palpate the lateral aspect of talar head, which is anterior to the lateral malleolus and toward the midline of the foot. During pronation and supination of subtalar joint movement, subtalar joint neutral position was obtained where the medial and lateral aspects of the head of the talus become prominent simultaneously. (Figure3). Examiner then applied a dorsiflexion loading force to the forefoot, with the thumb and index finger holding the foot in the toe sulcus across the lesser toes until a firm resistance was felt. Forefoot position at this point was determined by placing the stationary arm of the goniometer perpendicular to the calcaneal bisection and the movable arm parallel to the second to fifth metatarsal heads. If positive degrees obtained that is forefoot varus, neutral if it (0º), or if negative degrees obtained that is forefoot valgus (Figure4). Angle was determined as the angle between the perpendicular to the bisection of the calcaneus and an imaginary line drawn through the metatarsal heads.
To determine rear foot alignment
Subjects were made to assume same position adapted for forefoot angle measurement. The vernier caliper was positioned at the medial and lateral borders of the lower leg at 8 and 6 inches above the calcaneum, and both the midpoints were marked with a water soluble marker. (Figure 5,6,7). A vertical line was drawn between the two midpoints to create the bisection line in calf. To draw a calcaneal bisection line, midpoints at both the superior and inferior aspects of the calcaneum by palpating the medial and lateral borders of the calcaneum and midpoint was located by using a flexible ruler marking a dot at midpoints (Figure8). Then vertically connect this two midpoints to make posterior calcaneal bisection line. Then subject was asked to stand on the wooden box. Evalutor used palpation technique to feel for talar dome congruency, placed the subject’s foot in subtalar joint in neutral position and goniometer ruler was aligned parallel to bisection of lower leg against calcaneal bisection lines, the angle was recorded (Figure 9). More than 6 degree of calcaneal tilt from neutral was considered as rear foot varus and valgus in either direction.
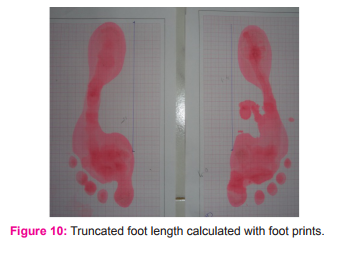
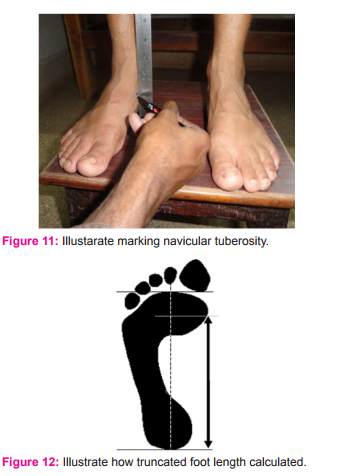
To screen type of foot arch
To screen the type of foot arch, normalized truncated navicular height (NTNH) 19 was measured. Subjects were made to assume relaxed standing position with feet positioned shoulder width apart. Navicular tuberosity was marked with water soluble marker (Figure 11). Navicular height was measured using metal ruler placed perpendicular to navicular tuberosity to the supporting surface. Then subjects were made to stand on two graph sheets placed in front of them after dipping their feet in ink diluted tray for generating foot print (Figure 10). Demarcation of first MTP joint in foot print is made maintaining that position on the graph. To calculate truncated foot length, distance between the two lines perpendicularly drawn from first MTP joint and from the most posterior aspect of the heel calculated (Figure 12). Then navicular height was divided by truncated foot length to derive normalized foot arch height .Values are documented as normal arch foot if NTNH value were 0.22-0.31. If NTNH values were > 0.18 was documented as flat foot. Standardized photographs of various foot diseases which were approved by dermatologist the second author of this study was used to grade various foot diseases and defects are employed20,21Criteria for identifying corns, calluses and verrucas were followed as per guidelines given by Snider RK and others.22,23,24 callosities, corns, warts were differentiated by its location, appearance, type of onset, direct pressure, side to side pressure and confirmed by dermatologist who is the second author of this study. Tinel’s sign was tested to screen if there were tarsal tunnel syndrome (TTS). Figure 13 provides the image of heel wart, Figure 14 the image of callosities. Figure 15 gives the image of ingrown toe nail.Figure 16 shows the image of tinea pedia. Figure 17 shows the image of corn with hallux valgus.
STATISTICAL ANALYSIS AND RESULTS
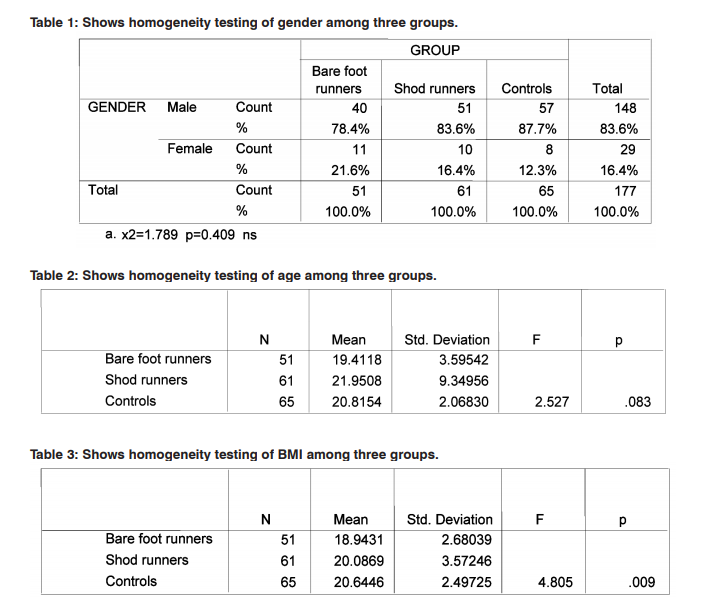
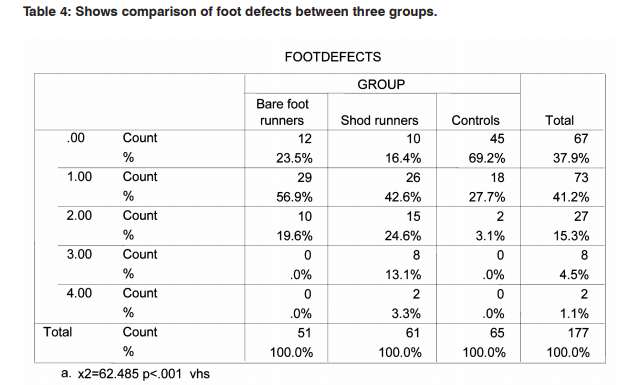
Data was collected and comparison was made between the groups namely barefoot runners, shod runners and controls for screening foot defects, foot deformities and foot diseases using spss version16. To test homogeneity between three groups for gender Chi-square test was used Table 1. To test homogeneity for BMI and age, one way ANOVAs analysis was used Table 2, 3. Then comparison of foot defects, foot deformities and diseases across three groups was carried out Table 4,5,6. Mean values of foot defects, deformities and disease for three groups are given in Table 7.
DISCUSSION
51 barefoot runners were compared against 65 controls and 61 shod runners for foot defects, foot deformities and diseases. There were no other studies exclusively in the past carried out to compare the prevalence of foot defects, foot deformities and diseases among the three groups chosen for this study. All outcome measure tools used in this study are clinically well validated and proven up-to-date. Gender homogeneity was found among three groups as the chi square test p value is 0.409. Age range homogeneity was found among three groups analysed as one way anova test p value is 0.083. BMI has varied significantly among three groups analysed namely barefoot runners, shod runners and controls as one way anova test p value is 0.009. Mean foot defects observed among barefoot runners, shod runners and control were 0.9608±.662, 1.442±.1.02 and 0.338±.53 were found to be highly significant across three groups as one way anova test p value was 0.001. Mean foot deformities observed among three groups were 0.745±.796, 0.868±1.16 and 0.23±.42 were found to be highly significant across three groups as one way anova test p value were 0.001. Mean foot diseases among barefoot runners, shod runners and controls were 0.588±.75, 0.426±.66 and 0.107±.35 were found to be highly significant across three groups as one way anova test p value were 0.001. Thus null hypothesis stands rejected. In this study mean foot defects were more in shod runners to barefoot runners. As for foot deformities were concerned, more occurrences were found with shod runners to barefoot runners. Yet mean number of foot diseases were more with barefoot runners to shod runners group. Surprisingly in controls, very few occurrence of foot defects, deformities and diseases are found. This study results contradict the reports given by researchers8,9,10 in which they reported fungus infection was more with shod group. Yet APMA (2015)25 recommends athletes not to use barefoot pattern generally to avoid acquiring athletic foot, warts. As a result of this study, one can understand the influence of foot wear on the occurrence of foot defects explained by Bertrand 7 . This study results have supported the claims of M.kuchi et al4 and K. D’Aou, T. et al.12 Though there are number of foot conditions common for runners, this study exclusively stratified runners in to shod and barefoot groups in screening various foot disorders in order to shed more light in devising prophylaxis measures. When shod runner’s age and BMI were correlated to the occurrence of foot defects, deformities and diseases exhibited poor correlation. So did with barefoot runners. Number of barefoot runners was comparatively less in this study might be a limiting factor. BMI varied significantly among three groups when age range, gender participation in three groups not varied significantly, thus homogeneity might be compromised to some extent. But when BMI was correlated to the incidence of foot defects, deformities and diseases in each group, it exhibited positive correlation with shod runners group. But with barefoot runners group and controls, BMI negatively correlated. The reason is not known. Equal numbers of samples in each group with larger sample size is recommended for future studies. Though less number of female participated in this study, gender homogeneity was found across three groups analyzed here. Shoe components can be correlated to the occurrence of the foot disorders observed in this study for shod runners group. This study has the advantage of stratifying samples and also has included controls for comparison in order to shed clear light in this area of research.
CONCLUSION
Three groups namely barefoot runners, shod runners and controls were screened in this study for the prevalence foot defects, deformities and diseases. Result of this study revealed that foot defects, deformities and diseases have been found to be highly significant among three groups.
ACKNOWLEDGEMENT
Authors express sincere thanks to Professor A. Joseph Oliver Raj M.P.T. Alva’s college of Physiotherapy and Research center for his support and Professor Radakrishnan M.phil, (PhD) former Physical education coach of Alva’s Physical education college for rendering his full-fledged help in getting samples in due course of time for this study. Self funded project work as well as a part of Major PhD research.

References:
1. Joan M. Bedinghaus, Mark W. Niedfeldt, Over-thecounter foot remedies; Medical college of Wisconsin, Milwaukee,Wisconsin.,www.aafp.org/afp American Family Physician SEPTEMBER 1, 2001 / VOLUME 64, No 5;791- 794.
2. Amanda Maloney, Sameep Chandrani, Defining barefoot running: Recognizing The risks and benefits; A systematic review. NYCPM podiatric medical review. Volume.21 fall 2013.
3. Kelly Murphy • Emily J. Curry • Elizabeth G. Matzkin. Barefoot Running: Does It Prevent Injuries? 08/2013; Sports Med DOI 10.1007/s40279-013-0093-2
4. M. Kouchi, M Aomi, Koto-ku., Mochimaru., The feet of runners: do they differ from the non-runners’ feet? National Institute of Advanced Industrial Science and Technology, 2003. 2-41-6 Tokyo 135-0064.
5. S T Aydog, O Tetik, H A Demirel, M N Doral., “Differences in sole arch . Indices in various sports”British Journal of Sports Medicine.2005;39:e5. doi: 10.1136/bjsm. 2003.011478.
6. Morimoto, M. and M. Okada., Somatometrical features of the foot in male athletes. Jpn. J. Hum. Posture, (1985).5(2):101-105.
7. Bertrand Mafert., Hallux valgus in a historical French population: Paleopathological study of 605 first metatarsal bones; Joint Bone Spine 74 (2007) 166-170. Doi:10.1016/ j.jbspin. 2006. 03. 011.
8. Kátia Sheylla Malta Purim, Gisele Pesquero Fernandes Bordignon and Flávio de Queiroz-Telles Rev Iberoam Micol ; Fungal infection of the feet in soccer players and non-athlete individuals 2005; 22: 34-38.
9. Samuel B. Shulman. “Survey in China and India of Feet That Have Never Worn Shoes.” Journal of the National Association of Chiropodists, Volume 49., 1949.. pp. 26-30.
10. Schaumburg, IL, American Academy of Dermatology. “Athlete’s Foot.” Patient Information Pamphlet, 1994,. American Academy of Dermatology.
11. Daoud AI, Geissler GJ, Wang F, Saretsky J, Daoud YA, Lieberman DE, Foot strike and injury rates in endurance runners: a retrospective study. Med Sci Sports Exerc. 2012 Jul;44(7):1325-34. doi: 10.1249/ MSS.0b013e3182465115.
12. K. D’Aou, T.C. Pataky, D. De Clercq and P. Aerts., The effects of habitual footwear use: foot shape and function in native barefoot walkers, Footwear Science Vol. 1, No. 2, June 2009, 81–94.
13. Adam P. The Grading of Hallux Valgus The Manchester Scale .J Am Podiatr Med Assoc 2001.,91(2): 74-78,).
14. H. B. Menz and S. E Radiographic validation of the Manchester scale for the classification of hallux valgus deformity. Rheumatology 2005;44:1061–1066 doi:10.1093/rheumatology/keh687.
15. Coughlin MJ, Shurnas PS. Hallux rigidus: demographics, etiology, and radiographic assessment. Foot Ankle Int. Oct 2003;24(10):731-43.
16. Kirsten, R. B., and Irene, D. The relationship between forefoot, midfoot, and rearfoot static alignment in pain–free individuals. J Orthop Sports Phys Ther., (2005). 35(9): 559- 566.
17. Shuchi Gupta, Shuchi Gupta, Maman Paul and Dr. Jaspal S. Sandhu., The relationship between forefoot, midfoot and rearfoot static alignment in painfree and painful heel in athletes Serb J Sports Sci 2008.,2(1-4): 67-74 2(3): 67-74.
18. Lattanza L, Gray CW, Kantner RM: Closed versus open kinematic chain measurements of subtalar joint eversion: Implications for clinical practice. I Orthop Sports Phys Ther 1988.9 (9):310-314.
19. George S Murley, A protocol for classifying normal- and flat-arched foot posture for research studies using clinical and radiographic measurements. Journal of Foot and Ankle Research 2009. 2:22 doi: 10.1186/1757-1146-2-22.
20. Kappes UP, Elsner P. Clinical and photographic scoring of skin aging. Skin Pharmacol Appl Skin Physiol 2003;16:100–7.
21. Altman RD, Hochberg M, Murphy WA, Wolfe F, Lequesne M. Atlas of individual radiographic features in osteoarthritis. Osteoarthritis Cartilage 1995;3 (Suppl A):3–70.
22. Snider RK. Corns and Calluses. In: Greene WB, ed. Essentials of Musculoskeletal Care. 2nd ed. Rosemont, Ill: American Academy of Orthopaedic Surgeons; 2001:437-41.
23. DeLauro TM, DeLauro NM. Corns and Calluses. In: Wolff K, Goldsmith LA, Katz SI, Gilchrest BA, Paller AS, Leffell DJ, eds. Fitzpatrick’s Dermatology in General Medicine. 7th ed. New York, NY: McGraw-Hill; 2008:97.
24. Kennedy CTC, Burd DAR. Mechanical and Thermal Injury. In: Burns T, Breathnach SM, Cox N, Griffiths CE, eds. Rook’s Textbook of Dermatology. 7th ed. London, England: Blackwell Science; 2004:22.
25. Foot Health Information; APMA., 2015.
|
 IJCRR
IJCRR 


 This work is licensed under a Creative Commons Attribution-NonCommercial 4.0 International License


