IJCRR - 14(4), February, 2022
Pages: 50-55
Date of Publication: 15-Feb-2022
Print Article
Download XML Download PDF
A Novel Liquid Chromatography-Electrospray Ionization-Mass Spectrometry (LC/ESI/MS/ MS) Method Development and Validation for the Quantification of Erdafitinib in Human Plasma
Author: Yarra Raviteja, G. Suresh
Category: Healthcare
Abstract:Introduction: A new specific, accurate and selective liquid chromatography/tandem mass spectrometry (LC-MS/MS) technique was desirable for the assessment of erdafitinib in human plasma. Aim: To develop an LC\?ESI-MS/MS method for the quantification of anticancer agent erdafitinib in human plasma and its validation as per the USFDA guidelines. Methodology: Propranolol (internal standard) reference drug utilized for the quantification of erdafitinib. Extraction of 250\?L plasma with liquid extraction technique, analyte components were eluted on symmetry (50 × 4.6mm; 5\?m) C18 analytical column. Mass detection system was executed by utilizing MRM (multiple reaction monitoring) with +ve ionization mode and electrospray ionization. Developed procedure was subjected for validation according to FDA guidelines in concentration levels between 69.95\?2798.00ng/mL for erdafitinib with r2 value of 0.9992. Results: The intraday and interday precision were within 4.11% and the assay accuracy was 97.95\?104.91 % of the nominal values. Matrix factor ranges from 95.61\? 103.84 % with a %CV of 3.63 for analyte at HQC and MQC levels, matrix factor range was 94.32\?104.01% with a %CV of 3.89. Conclusion: The developed process can be successfully applied for routine analysis in quality control, pharmacokinetic and forensic studies of biological samples.
Keywords: FGFR tyrosine kinase inhibitor, Erdafitinib, FDA, Accuracy, Linearity, Nominal values
Full Text:
INTRODUCTION
Erdafitinib is an inhibitor of FGFR (pan-fibroblast growth factor receptor) tyrosine kinases that is directed to treat patients with metastatic urothelial or locally advanced cancer which has: i) vulnerable FGFR 3 or FGFR 2 genetic alterations and ii) progressed during or following at least one line of prior platinum having chemotherapy with twelve months of adjuvant or neoadjuvant platinum comprising chemical therapy. Erdafitinib designated as N′-(3,5-Dimethoxy phenyl) -N′- [3- (1-methyl pyrazol -4-yl) quinoxalin -6-yl] -N-propan -2- ylethane-1,2- diamine with molecular formula and weight of C25H30N6O2 and 446.555 g·mol−1 respectively.1-5
FGFR is a transmembrane protein which express universally in normal tissue and also involved in numerous endogenous bio physiological procedures containing homeostasis of phosphate and cell proliferation, cell migration, vitamin D and cell anti-apoptotic signaling in different type of cells. Genetic changes or mutations like FGFR abnormalities like point mutations, gene amplification, and deregulation and chromosomal translocations of FGFR paths have been associated in pathogenesis of urothelial cancer, containing possibilities of such variations to all 4 FGFR-genes (FGFR-1, FGFR-2, FGFR-3, and FGFR-4).3,6,7 Deviations to the FGFRgenes are subsequently thought to stimulate cell propagation, relocation, anti-apoptosis and angiogenesis in many malignances comprising urothelial cancer. Drug is an oral specific pan-FGFR kinase inhibitor that bound and obstructs enzymatic action of expressed FGFR-1, FGFR-2, FGFR-3, and FGFR-4 based on in vitro data. In particular, erdafitinib demonstrates inhibition of FGFR phosphorylation and signaling as well as decreased cell viability in cell lines expressing FGFR genetic alterations, including point mutations, amplifications, and fusions.2,4,7
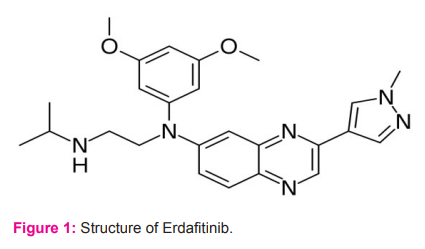
Literature on erdafitinib revealed that few analytical methods were reported on liquid chromatography8 and LC-MS/MS.9 The development of specific method alike LC-MS/MS is very vital for the quantification of erdafitinib in biological matrix.
MATERIALS AND METHODS
Chemicals and reagents
Erdafitinib (98.9 % purity) and propranolol (98.8 % purity) were acquired from Alembic Pharmaceuticals, Hyderabad, India. HPLC grade acetonitrile and methanol, ammonium acetate, ethyl acetate and HCOOH of the high grade quality were procured locally. Purified milli-Q water (Milford, MA) was utilized for entire research work.
Standards preparation
Processing of individual analyte stock solution(1000μg/ml) was done in methyl alcohol. The resulting solution was subjected for serial dilutions to get concentration range of 69.95–2798.00ng/mL with methanol.
Calibration standard solutions
For the processing of calibration standards, 20μl of erdafitinib diluted sample was mixed with 960μl of K2EDTA pooled plasma. To the resultant solution, 20μl of IS dilution was transferred to get final solution. The concentration range, 69.95–2798.00 ng/ml solutions were prepared and stored below −20 °C in a freezer.
Preparation of quality control samples
Quality control standard were processed at 3 dissimilar concentrations of high quality control(HQC) standards, median quality control(MQC) standards and low quality control(LQC) standards. These QC (quality control) solutions were processed as per the calibration standard solutions to get 2098.5, 1399.00 and 195.86, ng/mL for HQC, MQC and LQC correspondingly.
Preparation of solution of internal standards
Propranolol was used as internal standard and 1mg/mL stock concentrations in methyl alcohol were processed in a separate conical flask. Resulting stock was made dilution with methyl alcohol to get 1µg/mL solution.
Sample preparation
Drug solution was executed by relocating 250µl of plasma and 50µL of propranolol (1µg/mL) in to a pre-labeled tube and sonicated for 2.0 min. Erdafitinib and propranolol were isolated with 5.0mL of ethyl acetate solvent system and the solution was subjected for centrifugation at 5000rpm/min for 25min. Organic layer was isolated and dried with lyophiliser. Residue after the drying was made solubilize in 250µl of movable solvent and then translocated to LC-vials. These vials were placed and injected into LC-MS/MS instrument.
Chromatography
10µL of sample was injected on reversed phase symmetry (50 × 4.6mm) 5 μm C18 analytical column with an isocratic movable phase comprising of methyl alcohol and 5mM ammonium acetate in 0.1% HCOOH in Proportion of 80:20, (%v/v) was utilized at a flow rate of 0.80ml/min. Analytical column was retained at 45°C and total chromatographic time was 3.5min. Chromatographic system was equipped with HPLC-Shimadzu combined with API-5000 Mass instrument of Applied Bio systems, America.
Mass instrument
Electro spray ionization technique was utilized and functioned in +ve ionization method for MRM. By injecting dilute stock solution of drug, the operating parameters were improvised as mentioned in Table 1. Auxiliary gas (GS2) and nebulizer gas (GS1) flows were 40 and 45 psi, respectively. Source temperature was set at 250 °C. Q3 and Q1 were monitored under unit resolution. Upon addition of HCOOH to the mobile phase, protonation of analytes were improvised and excellent peak intensities were obtained. MRM mode monitored at: m/z 447.25 → 388.17 for erdafitinib and m/z 260.16 → 72.08 for propranolol. Concentrations of samples were estimated by regression line with the help of analyst software1.5.1. In this peak response ratio method was utilized.

Validation of analytical method
Developed LC–MS/MS work was subjected for validation according to USFDA-guidelines for sensitivity, inter and intraday precision, specificity, linearity, stability and accuracy.10,11
RESULTS AND DISCUSSION
Method validation
Selectivity
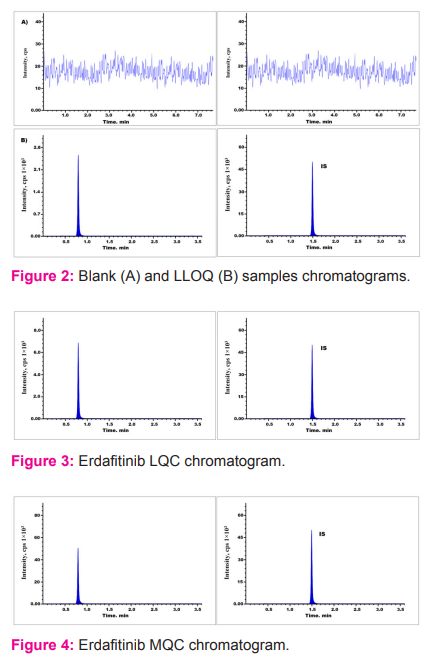
Method selectivity was executed with 8 distinct human K2 EDTA human plasma samples including 1-hemolytic and 1-lipemic lot. Interferences observed were negligible during the analysis of analytes at respective retention times over the spiked response of LLOQ with IS (Fig.2).12-14
Recovery
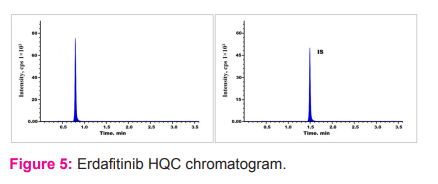
Analyte recovery from extraction sample was evaluated by equating peak responses from six plasma sample solutions spiked prior to extraction against aqueous sample solutions.15, 16 Overall average recoveries of all three quality control standards was 93.15%. The recovery of IS was found to be 96.56 % and the findings were shown in Table 2 (Fig. 3 to 5).
Sensitivity and linearity
Eight points calibration curve was processed with analyte samples from 69.95 ng/ml to 2798.00 ng/ml. Peak response ratio(y) of analyte to IS was taken against nominal concentration(x) of analyte to evaluate linearity. Regression line has r2 value of 0.9992 with equation y= 0.005412 x+ 0.00128.16,17 Erdafitinib LLOQ was 69.95 ng/ml, which indicates the developed method sensitivity.
Accuracy and precision
Inter and intraday accuracy and precision was evaluated by considering 6 replicates for LLOQ, LQC, MQC and HQC standard solutions18, 19. The corresponding erdafitinib concentrations were 69.95, 195.86, 1399.00 and 2098.50 ng/ml. Accuracy and precision findings were represented in Table 3. Inter and intraday precision findings were ≤4.11% and the assay accuracy was 97.95–104.91 %.

Matrix effect
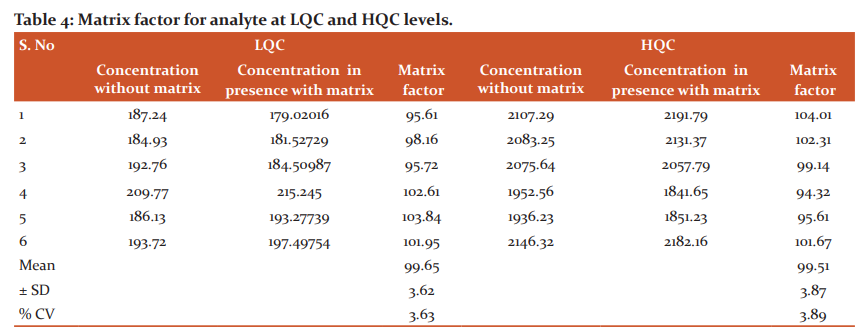
This parameter was evaluated by extracting 8 variable blank plasma samples including 1-lepemic and 1-hemolytic lot. From each blank plasma lot 100 microliters of sample was subjected for processing as per the sample preparation. Individual aqueous sample at HQC or LQC level was mixed to final solution(post-extraction matrix samples).16, 20 In a similar way individual aqueous sample solution at HQC or LQC level was executed with moveable solvent(aqueous sample without matrix).
Above processed solutions were injected six times at HQC and LQC levels and analyte and IS peak responses were compared. This parameter was evaluated by: Matrix effect (%) = A2/A1 × 100(%), where A1 = response of aqueous concentrations and A2 is the response of post-extracted concentrations. Average (n = 6) matrix factor ranges from 95.61– 103.84 % with a %CV of 3.63 for analyte at low and at high QC levels, the matrix factor range was 94.32–104.01% with a %CV of 3.89 (Table 4).
Carryover effect
In this cleaning capability of washing solution utilized for infusion port and needle was evaluated.21 It was evaluated by injecting the samples in order of: LLOQQC, blank and ULOQQC and again blank solution. There was no effect of carryover observed throughout the study.
Dilution integrity
Developed process was subjected for dilution integrity at fourfold and twofold dilution. Six duplicate sample solutions were executed and subjected for evaluation over the fresh spiked standards. Upper limit was expandable upto 2798.00.ng/mL. Average back-calculation concentration values were present in between 94.46–104.52 % with a % CV of ≤2.83 for the analyte.15
Stability
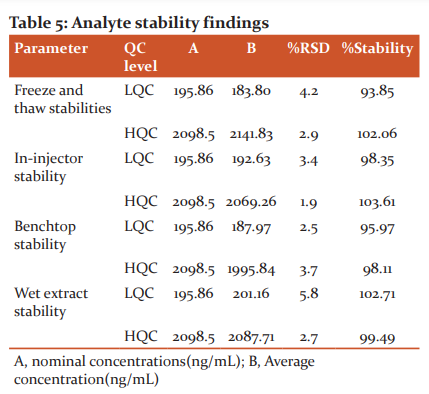
Bench-top, freeze-thaw, in-injector and wet extract stability studies were executed for the evaluation human plasma sample stability. All these studies were evaluated at HQC and LQC levels. To process benchtop stability, standard QC samples were collected from freezer(−20°C) and thawed(25°C) upto 6 hours. The percentage of stabilities were evaluated against the fresh sample solutions and found in between 95.97–98.11 %. To process the freeze-thaw stability, standard QC samples were subjected for freeze and thaw rotations for four times. The percentage of stabilities were evaluated against the fresh sample solutions and found in between 93.85 to 102.06 % .
To process the in-injector stability, standard QC samples were kept in an autosampler at 10°C for 24 hours. The percentage of stabilities were evaluated against the fresh sample solutions and found in between 98.35–103.61 %. Wet extract stability was processed at 8 hours at 25°C and The percentage of stabilities were evaluated against the fresh sample solutions and found in between 99.49–102.71 % (Table 5).
Extended accuracy and precision
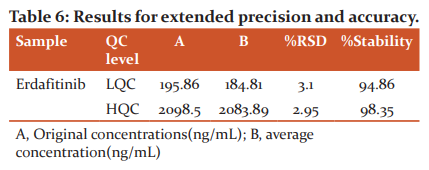
To process the extended accuracy and precision, 1-set of calibration standards and forty sets of HQC and LQC standards, total ninety samples, were injected and subjected for the evaluation. The resultant findings were shown in Table 6. The precision for erdafitinib was <3.2 and stability at HQC and LQC levels were found to be 98.35% and 94.86% correspondingly.
CONCLUSION
A simple, specific and sensitive LC–MS/MS process for quantification of Erdafitinib in plasma samples was developed successfully and subjected for the validation as per the USFDA guidelines. Linearity was processed in between 69.95–2798.00ng/mL for erdafitinib with regression coefficient value of 0.9992. The intraday and interday precision were within 4.11% and the assay accuracy was 97.95–104.91 % of the nominal values. Matrix factor ranges from 95.61– 103.84 % with a %CV of 3.63 for analyte at HQC level and at LQC level, the matrix factor range was 94.32–104.01% with a %CV of 3.89. Stabilities revealed that the method has high degree of stability. The developed process can be utilized in bioequivalence and bioavailability studies for the quantification of erdafitinib in biological matrices.
ACKNOWLEDGEMENT
Authors acknowledge immense help received from the scholars whose articles are cited and included in reference to the manuscript. The authors are grateful to all the authors/ editors/publishers of those articles, journals, and books from where the literature of this article has been reviewed and discussed.
Source(s) of funding: No funding is involved.
Conflicts of interest: The authors declare no conflicting interest.
Author’s contribution: All the authors contributed equally.
References:
-
Nishina T, Takahashi S, Iwasawa R, Noguchi H, Aoki M, Doi T. Safety, pharmacokinetic, and pharmacodynamics of erdafitinib, a pan-fibroblast growth factor receptor (FGFR) tyrosine kinase inhibitor, in patients with advanced or refractory solid tumors. Invest New Drugs. 2018;36(3):424-434.
-
Perera TPS, Jovcheva E, Mevellec L, Vialard J, De Lange D, Verhulst T, Paulussen C, Van De Ven K, King P, Freyne E, Rees DC, Squires M, Saxty G, Page M, Murray CW, Gilissen R, Ward G, Thompson NT, Newell DR, Cheng N, Xie L, Yang J, Platero SJ, Karkera JD, Moy C, Angibaud P, Laquerre S, Lorenzi MV: Discovery and Pharmacological Characterization of JNJ-42756493 (Erdafitinib), a Functionally Selective Small-Molecule FGFR Family Inhibitor. Mol Cancer Ther. 2017 Jun;16(6):1010-1020.
-
Tabernero J, Bahleda R, Dienstmann R, Infante JR, Mita A, Italiano A, Calvo E, Moreno V, Adamo B, Gazzah A, Zhong B, Platero SJ, Smit JW, Stuyckens K, Chatterjee-Kishore M, Rodon Peddareddigari JV, Luo FR, Soria JC. Phase I Dose-Escalation Study of JNJ-42756493, an Oral Pan-Fibroblast Growth Factor Receptor Inhibitor, in Patients With Advanced Solid Tumors. J Clin Oncol. 2015;20;33(30):3401-8.
-
Wesche J, Haglund K, Haugsten EM. Fibroblast growth factors and their receptors in cancer, Biochem. J. 2011;437:199–213.
-
Eswarakumar VP, Lax I, Schlessinger J. Cellular signaling by fibroblast growth factor receptors, Cytokine Growth Factor Rev. 2005;16:139–149.
-
Ahmad I, Iwata T, Leung HY. Mechanisms of FGFR-mediated carcinogenesis, Biochim. Biophys. Acta. 2012; 1823: 850–860.
-
Touat M, Ileana E, Postel-Vinay S, Andre F, Soria JC. Targeting FGFR signaling in cancer, Clin. Cancer. Res. 2015; 21: 2684–2694.
-
Maithani M, Dwivedi D, Hatwal D, Bansal P. Development and validation of a RP-HPLC method for determination of erdafitinib in marketed formulations. (JBPR). 2020;9(3):29-32.
-
Elawady T, Khedr A , El-Enany N , Belal F. LC-MS/MS determination of erdafitinib in human plasma after SPE: Investigation of the method greenness. Microchem J, 2020; 154:1-6.
-
FDA Guidance for Industry, Bioanalytical Method Validation, US Department of Health and Human Services, Food and Drug Administration, Centre for Drug Evaluation and Research (CDER), Center for Veterinary Medicine (CVM) May 2001.
-
European Medicines Agency, Guideline on bioanalytical method validation 2011.
-
Henion J, Brewer E, Rule G. Sample Preparation for LC/MS/MS: Knowing the Basic Requirements and the Big Picture of an LC/MS System can Ensure Success in Most Instances. Anal Chem. 1998;70:650A-656A.
-
Chambers EE, Woodcock MJ, Wheaton JP. Systematic development of an UPLC–MS/MS method for the determination of tricyclic antidepressants in human urine. J Pharm Biomed Anal., 2014; 88:660–665.
-
Patel DS, Sharma N, Patel MC. Development and validation of a selective and sensitive LC–MS/MS method for determination of cycloserine in human plasma: application to bioequivalence study, J Chromatogr B. 2011; 879:2265–2273.
-
Murphy AT, Kasper SC, Gillespie TA, DeLong AF. Determination of Xanomeline and Active Metabolite, N-Desmethylxanomeline, in Human Plasma by Liquid Chromatography-Atmospheric Pressure Chemical Ionization Mass Spectrometry. J Chromatogr B. Biomed Appl. 1995;668:273-280.
-
Richard Hoetelmans MW, Marjolijn Van Essenberg , Pieter Meenhorst L, Jan Mulder W, Jos Beijnen H. Determination of saquinavir in human plasma, saliva, and cerebrospinal fluid by ion-pair high-performance liquid chromatography with ultraviolet detection. J. Chromatogr. B Biomed. Appl.. 1997; 698:235-241.
-
Zhong G, Bi H, Zhou S, Chen X, Huang M. Simultaneous determination of metformin and gliclazide in human plasma by liquid chromatography–tandem mass spectrometry: application to a bioequivalence study of two formulations in healthy volunteers. J Mass Spectrom. 2005;40:1462–1471 31.
-
Cheruku S, Bhikshapathi DVRN. Method development and validation for the quantification of pexidartinib in biological samples by LC-MS/MS. IJPR. 2021;13(1):6522-30.
-
Nagalakshmi V, Srinivas Rao G, Gayathri Devi N, Mohan S. RP-HPLC method for simultaneous estimation of vildagliptin and metformin in bulk and pharmaceutical formulations. IJCRR. 2021;13(7):112-117.
-
Kalluru H, Vinodhini C, Srinivas SK, Rajan SM, Chitra K, Mangathayaru K. Validated RP-HPLC method for quantification of paclitaxel in human plasma – eliminates negative influence of cremophor EI. IJCRR. 2018;10(13):5-10.
-
Kumar PP, Murthy TE, Basaveswara Rao MV. Development, validation of liquid chromatography–tandem mass spectrometry method for simultaneous determination of rosuvastatin and metformin in human plasma and its application to a pharmacokinetic study. J Adv Pharm Technol Res.2015;6:118–124 32.
|


 This work is licensed under a Creative Commons Attribution-NonCommercial 4.0 International License