IJCRR - 14(4), February, 2022
Pages: 01-06
Date of Publication: 15-Feb-2022
Print Article
Download XML Download PDF
Patients' Gratification Towards Service Delivery Among Government Hospitals with Particular Orientation Towards Primary Health Centres
Author: Ajai Krishnan Gopalakrishnan, Athira K Nair
Category: Healthcare
Abstract:Introduction: The quality-of-service delivery in health care system is a foremost apprehension in most of hospitals especially primary health centres. The study discusses about the patient's satisfaction towards service delivery in government hospitals, especially with the primary health centres. Materials and Methods: This study employed a descriptive research design. The data were collected using a structured questionnaire and was conducted among the patients of a primary health centre. Patients' responses were collected and are grouped under various factors and listed out and analysed. Results: The results of the study demonstrated that participants had diverse levels of expectation about the service delivery factors of primary health centre based on their age, income and educational qualification level. There is a significant influence of patient's hospital visit and availability of medicines in the pharmacy on reason for the service delivery satisfaction(p=0.000). The study further revealed that primary health centres need to take care of their service delivery factors like waiting area, parking facilities, patient care, space in OPD, toilet facilities, feeding rooms, and cafeteria, for improving the patient's service delivery satisfaction. Conclusion: The study showed that the majority of the patients are not satisfied with service delivery factors of the primary health centre. So, the government need to take immediate initiatives for improving the facilities in the primary health centres and upgrade it to the next level.
Keywords: Hospital Care, Patients Satisfaction, Primary Health Centres, Service Delivery, Primary Care, Service Quality
Full Text:
INTRODUCTION
The enhancement of health of a country’s population is the result of its upgraded economy and a robust improved economy is based on a healthy population. This is factual because advancement of the citizen’s health can be directly associated to constructive economic growth as a greater number of people in good health will be active to conduct productive activities in the workforce. Simultaneously higher-level healthcare also affects the standard of life more than any other service sector.1,2 Nowadays quality of service delivery in health care has become a major concern for patients in all over the world especially in Kerala. So, it is very much important for the service delivery providers in health care sector like hospitals to emphasize the importance of service delivery quality that will satisfy their patients and retain them to their hospitals or healthcare centres. That is why customer satisfaction being observed as the key factor that leads to sustainable opulence for the respective organization.3 The Primary Health Centre (PHC) is the elementary structural and everyday unit of the public health services of a Country. PHCs were established to deliver accessible, reasonable and obtainable primary health care to public, in harmony with the Alma Ata Declaration of 1978 by the member nations of the World Health Organization. Kerala is a perfect model to other States of India in the Health care sector and has been able to accomplish attainments akin to the developed countries. The health indicators like The Child Mortality Rate, Maternal Mortality Rate, and Life expectancy highlight this based on Government of India Ministry of Health and Family welfare, Bulletin of Rural Health Statistics 2016-17.4 And all these activities are executed through the Primary Health Centres at the grassroots level.
Right is not based so much on the individual’s guest’s standing as it is upon the fact that the guest is a human being, and life itself is an ethical power.5 That is citizens have a genuine right to equal access to services, and public servants must not suppress that right from them. Technical quality falls petite of being a truly valuable measure for unfolding how patients assess the quality of a medical service encounter.6 Since most of patient’s dearth the essential knowledge for assessing the technical quality of services, their assessment of quality is based on the medical care process. Quality of service stimulates consumer loyalty and the quality of service is characteristically a point of reference for consumer loyalty.7 Perceived health care quality has a positive weight on customer satisfaction.8 That is, overall perceived service quality has a positive relationship with patient satisfaction. Most of the research on dealing customer perceived service quality in the private healthcare sector has been partial to developed countries.9 There is a deficiency of evidence in knowing the customer perceived service quality; customer perceived value with arbitrating role of customer satisfaction to customer loyalty and behavioural intention in the context of exclusive private healthcare sector in India.
The staff observes quality as the core for customer satisfaction.10 That is, co-operative and helpful staffs are able to inculcate confidence among the customer of the industry. Private hospitals had lesser gaps than public hospitals in three of the services quality dimensions, that is, reliability namely confidence, empathy and tangible.11 Service quality has noteworthy and positive influence on student satisfaction, and the majority of students are satisfied with the amenities provided by the universities.12
MATERIALS AND METHODS
Objectives of the study
To study the demographic profile of patients visiting the Primary Health Centres in Kottayam District, to study the Patients medical treatment experience towards Primary Health Centres, and to assess the Patients Service Delivery Satisfaction towards the Primary Health Centres.
Hypothesis of the study
With regard to the objectives mentioned, the following null hypothesis were developed.
-
H0: There is no significant influence of hospital visit and availability of medicines in the pharmacy on reason for the service delivery satisfaction.
-
H0: There is no significant difference in the visit to different types of clinics among the various age groups of patients.
-
H0: There is no significant difference in the service delivery satisfaction among the various age groups of patients and various income groups of patients.
Methodology
The study is descriptive in nature. The population comprises of primary health centre’s patients in Kottayam district. The study was conducted at a primary health centre in Kottayam for a period of two months. The total number of samples drawn was 250 and the fully responded samples were 223 patients from the primary health centre. Judgement sampling is used for the study. The data were collected with the help of a questionnaire, contains questions on the facets about their demographic and socio-economic background, influencing factors, and other associated facets. The questionnaire was subjected to reliability testing and the Cronbach’s coefficient Alpha was calculated to test the reliability of questionnaire and the result of the reliability analysis is 0.79. The secondary data has been composed from diverse sources of literature like journals, textbooks and internet. The standard statistical tools such as tables, percentages, pie charts, bar charts, chi-square test, and ANOVA are used for analysing the data and reaching the conclusion.
DATA ANALYSIS
Table 1 reveals that, 35 percent respondents are male and 65 percent are female. 8 percent respondents belong to the age group of below 20 years, 11 percent respondents belong to the age group of 20 to 34 years, 14 percent respondents belong to the age group of 35 to 49 years, 31 percent respondents belong to the age group of 50 to 64 years, and 36 percent respondents are above 64 years of age. 72 percent of respondents are married and 28 percent of respondents are single. 61 percent of respondents are school level, 31 percent of respondents are graduates, and 8 percent are postgraduates. 64 percent of respondents are having yearly income up to 1,00,000, 25 percent are from the income group of 1,00,001-3,00,000 rupees, 9 percent are from the income group of 3,00,001-5,00,000 rupees, and 2 percent are having yearly income above 5,00,000. 96 percent of respondents are Keralites and 4 percent of respondents belong to non-Keralites.
Figure 1 reveals that, 20 percent of respondents are showing one time visit to the hospital and 80 percent of respondents showing repeat visits to the hospital.
Figure 2 reveals that, 9 percent of respondents visit antenatal clinics, 16 percent of respondents visit immunization clinics, 31 percent of respondents visit general clinics, and 44 percent respondents visit NCD clinics.
Figure 3 reveals that, 8 percent respondents say it takes more than 2 hours to meet the doctor, 14 percent respondents says that within 2 hours they can meet the doctor, 39 percent respondents says that within 1 hour they can meet the doctor, 25 percent respondents says that within 30 minutes they can meet the doctor, and 14 percent respondents says that within 15 minutes they can meet the doctor.
Figure 4 reveals that, 11 percent respondents says that medicines are very much available in the pharmacy, 41 percent of respondents says that medicines are available in the pharmacy, 16 percent respondents says that medicines availability in the pharmacy is average, 26 percent of respondents says that medicines are not available in the pharmacy, and 6 percent respondents says that medicines are not at all available in the pharmacy.
Figure5 reveals that, majority of the respondents having an overall opinion that they are getting sufficient time with medical officer (48 percent), majority of the respondents having an overall opinion that they get respect and dignity (50 percent), majority of the respondents having an overall opinion that they get good quality of healthcare (57 percent), majority of the respondents having an overall opinion that medical officer is displaying promptness (71 percent), majority of the respondents having an overall opinion that staff nurse is displaying promptness (64 percent), majority of the respondents having an overall opinion that pharmacist is displaying promptness (63 percent).
Figure6 reveals that, majority of the respondents having an overall opinion that hospital staff are polite in their behaviour (75 percent), majority of the respondents having an overall opinion that hospital staff are willing to help (80 percent), majority of the respondents having an overall opinion that hospital staff are not rude in their behaviour (84 percent), majority of the respondents having an overall opinion that hospital staff are not having attitude problem (80 percent), and majority of the respondents having an overall opinion that hospital staff are normal in their behaviour (79 percent).
Figure7reveals that, majority of the respondents having an overall opinion that they are not satisfied with the waiting area (76 percent), majority of the respondents having an overall opinion that they are not satisfied with the parking facilities (83 percent), majority of the respondents having an overall opinion that they are satisfied with the staff communication (66 percent), majority of the respondents having an overall opinion that they are satisfied with the patient care (69 percent), majority of the respondents having an overall opinion that they are satisfied with the space in OPD (70 percent), majority of the respondents having an overall opinion that they are satisfied with the cleanliness of waiting area (65 percent), majority of the respondents having an overall opinion that they are not satisfied with the toilet facilities (81 percent), majority of the respondents having an overall opinion that they are not satisfied with the facilities for people with special needs (89 percent), majority of the respondents having an overall opinion that they are not satisfied with the feeding rooms (71 percent), and majority of the respondents having an overall opinion that they are not satisfied with the cafeteria (90 percent).
Figure8 reveals that, 11 percent respondents says that they are highly satisfied with the service delivery, 12 percent respondents says that they are having neutral opinion towards the service delivery, 22 percent respondents says that they are satisfied with the service delivery, 27 percent respondents says that they are dissatisfied with the service delivery, and 28 percent respondents says that they are highly dissatisfied with the service delivery.
Table 2 reveals that calculated value is 148.500 and p-value is less than 0.05 (p=0.000) at 5% level of significance. Hence the null hypothesis is rejected. It means that there is a significant influence of patients hospital visit on reason for the service delivery satisfaction.
Table 3 reveals that calculated value is 453.764 and p-value is less than 0.05 (p=0.000) at 5% level of significance. Hence the null hypothesis is rejected. It means that there is a significant influence of availability of medicines in the pharmacy on reason for the service delivery satisfaction.
Table 4 reveals that, the F value of 301.295 at 5% level of significance (p=0.000). So, the null hypothesis is rejected (p<.05). It means that there is a significant difference in the visit to different types of clinics among the various age groups of patients.
Table 5 reveals that, the F value of 512.617 at 5% level of significance (p=0.000). So, the null hypothesis is rejected (p<.05). It means that there is a significant difference in service delivery satisfaction among the various age groups of patients.
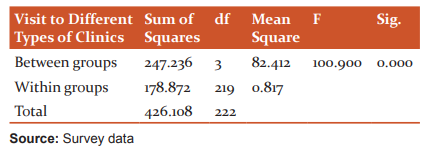
Table 6 reveals that, the F value of 100.900 at 5% level of significance (p=0.000). So, the null hypothesis is rejected (p<.05). It means that there is a significant difference in service delivery satisfaction among the various income groups of patients.
RESULTS
From the results it was evident that 65 percent of the patients were female, majority 36 percent of the patients were above 64 years of age, 72 percent of the patients were married, 61 percent of the patients were school level educated, 64 percent of the patients were having yearly income up to 1,00,000, 96 percent of the patients were Keralites, 80 percent patients showed repeat visits to the hospital, majority 44 percent patients visited NCD clinics, majority 39 percent patients said that within one hour they could meet the doctor, 52 percent patients said that medicines were available in the pharmacy, majority 48 percent of the patients had an overall opinion that they got sufficient time with medical officer in the hospital, majority 50 percent of the patients had an overall opinion that they got respect and dignity from the hospital staff, 57 percent of the patients had an overall opinion that they got quality healthcare from the hospital, 71 percent of the patients had an overall opinion that medical officer displayed promptness, 64 percent of the patients had an overall opinion that staff nurse displayed promptness, 63 percent of the patients had an overall opinion that pharmacist displayed promptness, 75 percent of the patients had an overall opinion that hospital staff were polite in their behaviour, 80 percent of the patients had an overall opinion that hospital staff were willing to help, 84 percent of the patients had an overall opinion that hospital staff were not rude in their behaviour, 80 percent of the patients had an overall opinion that hospital staff were not having attitude problem, 79 percent of the patients had an overall opinion that hospital staff were normal in their behaviour, 76 percent of the patients had an overall opinion that they were not satisfied with the waiting area of the hospital, 83 percent of the patients had an overall opinion that they were not satisfied with the parking facilities of the hospital, 66 percent of the patients had an overall opinion that they were satisfied with the hospital staff communication, 69 percent of the patients had an overall opinion that they were satisfied with the patient care by the staff of the hospital, 70 percent of the patients had an overall opinion that they were satisfied with the Out Patient Department (OPD) space in the hospital, 65 percent of the patients had an overall opinion that they were satisfied with the cleanliness of waiting area in the hospital, 81 percent of the patients had an overall opinion that they were not satisfied with the toilet facilities in the hospital, 89 percent of the patients had an overall opinion that they were not satisfied with the facilities provided for people with special needs in the hospital, 71 percent of the patients had an overall opinion that they were not satisfied with the feeding rooms in the hospital, 90 percent of the patients had an overall opinion that they were not satisfied with the cafeteria in the hospital, majority 45 percent of the patients said that they were dissatisfied with the overall service delivery of the hospital. It was clear from the study that there was a significant influence of patients hospital visit and availability of medicines in the pharmacy on reason for the service delivery satisfaction. Study also revealed that, there was a significant difference in the visit to different types of clinics among the various age groups of patients. And there was a significant difference in the service delivery satisfaction among the various categories of age of the patients and the various categories of income of the patients.
CONCLUSION
The study mainly focused on the patient’s gratification towards service delivery among government hospitals with particular orientation to primary health centres. The present study reveals several observations of patients and their satisfaction towards service delivery among primary health centres in Kerala with special reference to a primary health centre in Kottayam district. Majority of the patients are not satisfied with the service delivery factors like parking facilities, toilet facilities, waiting area, facilities for people with special needs, feeding rooms, and cafeteria. But the majority are satisfied with the services offered by medical officer, staff nurse, pharmacist and other hospital staff of the primary health centres. So, government need to take immediate initiatives for improving the facilities in the primary health centres and upgrade it to the next level like family health centres. From the study we have seen that there is a significant influence of patient’s hospital visit and availability of medicines in the pharmacy on reason for the service delivery satisfaction, so the medicines have to be available in the pharmacy in required quantity. Majority of the patients visiting the PHC are above 64 years of age, so PHC’s need to give extra care for the patients based on their age. So, it is concluded from the study that primary health centres need to take care of their service delivery factors like, waiting area, parking facilities, patient care, space in OPD, cleanliness of waiting area, toilet facilities, facilities for people with special needs, feeding rooms, and cafeteria for improving the patients service delivery satisfaction towards the PHC.
ACKNOWLEDGEMENT
The authors are very much grateful to authors/editors/publishers of all those articles and journals from where the literature for this article has been reviewed and discussed.
Conflicts of interest: There are no conflicts of interest.
Source of Funding: None.
Authors’ Contribution: Dr. Athira K Nair helped in framing the questions and collecting the data. Dr. Ajai Krishnan Gopalakrishnan conceptualized, analysed the data and wrote the manuscript. All authors reviewed the final manuscript.
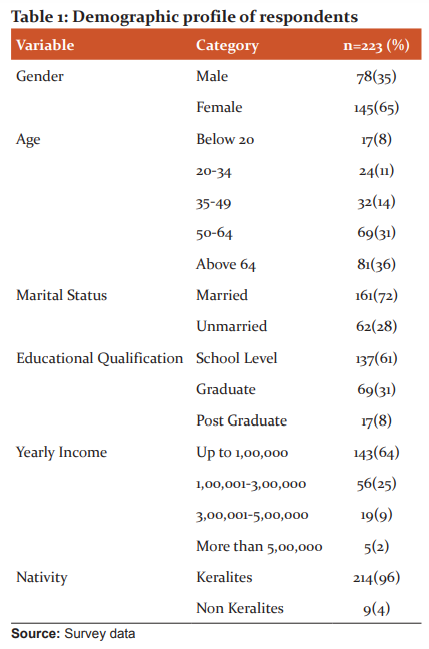
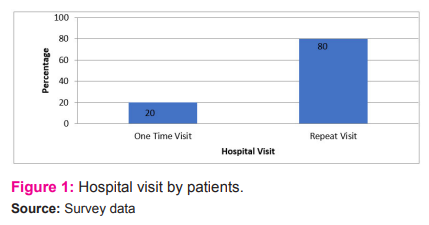

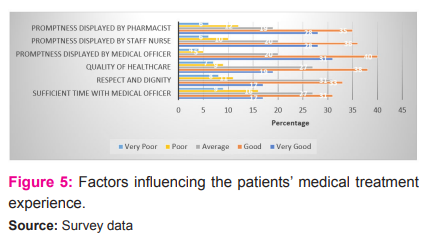
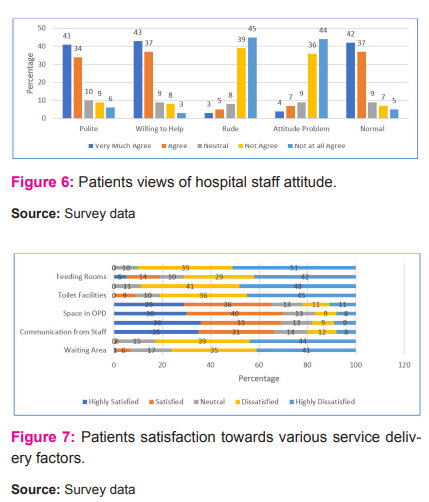
Table 2: Influence of patient’s hospital visit on reason for the service delivery satisfaction
H0: There is no significant influence of hospital visit on reason for the service delivery satisfaction.
H1: There is a significant influence of hospital visit on reason for the service delivery satisfaction.
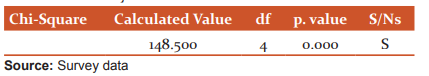
S-Significant Ns-Not significant
Table 3: Influence of availability of medicines in the pharmacy on reason for the service delivery satisfaction
H0: There is no significant influence of availability of medicines in the pharmacy on reason for the service delivery satisfaction.
H1: There is a significant influence of availability of medicines in the pharmacy on reason for the service delivery satisfaction.

S-Significant Ns-Not significant
Table 4: ANOVA – The visit to different types of clinics and various age groups of patients
H0: There is no significant difference in the visit to different types of clinics among the various age groups of patients.
H1: There is a significant difference in the visit to different types of clinics among the various age groups of patients.
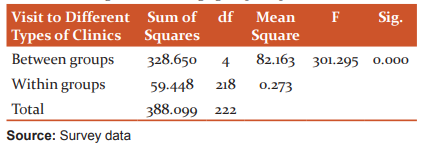
Table 5: ANOVA – The service delivery satisfaction and various age groups of patients
H0: There is no significant difference in the service delivery satisfaction among the various age groups of patients.
H1: There is a significant difference in the service delivery satisfaction among the various age groups of patients.
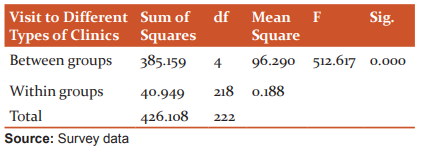
Table 6: ANOVA – The service delivery satisfaction and various income groups of patients
H0: There is no significant difference in the service delivery satisfaction among the various income groups of patients.
H1: There is a significant difference in the service delivery satisfaction among the various income groups of patients.
References:
-
Berry LL, Bendapudi N. Health care a fertile field for service research. J Serv Res 2007, 10(2), 111-122.
-
Padma P, Rajendran C, Sai Lokachari P. Service quality and its impact on customer satisfaction in Indian hospitals: Perspectives of patients and their attendants., Benchmarking: An Int J 2010, 17(6), 807-841.
-
Athanassopoulos A, Gounaris S, Stathakopoulos V. Behavioural responses to customer satisfaction: an empirical study. Eur J Mark. 2001, 35(5), 687-707.
-
Bulletin of Rural Health Statistics (2016-17). Government of India Ministry of Health and Family welfare. Health Centres in India 2017.
-
Whitney LD. Ethics in the Hospitality Industry: With a focus on Hotel Managers. Int J Hosp Manag 1990,9(1), 59-68.
-
Bowers MR, Swan JE, Koehler WF. What Attributes Determine Quality and Satisfaction with Health Care Delivery? Health Care Manag. Rev.1994, 19 (4), 49-55.
-
Gilbert GR, Veloutsou C. A cross-industry comparison of customer satisfaction. J. Serv. Mark. 2006,20(5), 298-308.
-
Badri MA, Attia S, Ustadi AM. Healthcare quality and moderators of patient satisfaction: testing for causality. Int J Health Care Qual Assur 2009,22(4), 382-410.
-
Sodani PR, Kumar RK, Srivastava J, Sharma L. Measuring patient satisfaction: A case study to improve quality of care at public health facilities. Indian J. Community Med. 2010, 35(1), 52-56.
-
Kiran K. Service quality and customer satisfaction in academic libraries Perspectives from a Malaysian University. Library Rev. 2010, 59(4), 261-273.
-
Yesilada F, Direktor E. Health care service quality: A comparison of public and private hospitals. Afr J Bus Manag 2010, 4(6), 962-971.
-
Dhar KB, Sikder RM. Influencing Factors of Service Quality on Students’ Satisfaction at University Sains Islam Malaysia (USIM), Malaysia. Int J Bus Soc 2018, 2(12), 1-11.
|
 IJCRR
IJCRR 


 This work is licensed under a Creative Commons Attribution-NonCommercial 4.0 International License


