IJCRR - 14(3), February, 2022
Pages: 24-30
Date of Publication: 01-Feb-2022
Print Article
Download XML Download PDF
Formulation of Ice Cream from Sweet Pearl F1 as Affected by Three Levels of Corn Starch and Its Corresponding Nutritional Analysis
Author: Christina T. Alfiler, Cristina B. Natividad, Celia Flor R. Ferrer
Category: Healthcare
Abstract:Ice cream is a popular treat that is known to everyone. The goal of this study was to produce ice cream from the sweet pearl F1 variety, which was affected by three different levels of maize starch. It was founded by a group of academics from the College of Education, namely from the BTLEd department, to empower young people to spread technology and livelihood education in rural regions. Because we are an agricultural country, farmers are at the forefront of our economy. As a consequence, we must pay careful attention to how livelihood education is spread among our corn families. The aim of this study was to develop three ice cream formulations and use sensory assessment to assess their nutritional quality and appeal. The flavor and color criteria for sensory evaluation in ice cream did not differ substantially among the three treatments tested, according to the study's results. ANOVA revealed that the treatments were substantially different in terms of ice cream texture and palatability. According to the nutritional research, only T3 surpassed the USDA's fat limit of no more than 10%. The three different quantities of starch did not make a significant difference in taste or color among the treatments tested, but they did make a significant difference in texture and palatability. To ensure great palatability and texture, the researchers recommend utilizing one teaspoon (T3) commercial corn starch, as well as a fat level of no more than 10%. More study on the melting ability of the ice cream after it hardens in the ice cream maker is also recommended.
Keywords: Sweet Pearl F1, Nutritional analysis, Ice cream, Palatability, Texture, Flavor
Full Text:
Introduction
Bachelor in Technology and Livelihood Education (BTLEd) prepares young adults to spearhead the diffusion of technology and livelihood education in the countryside. Being an agricultural country, farmers are the forefront of our economy. Hence, livelihood education among our corn household needs due attention.
According to the annual report 2018 of the Department of Agriculture, the national production of corn attained 7,771,918.6 MT. Almost 21% of this volume was contributed by Cagayan Valley. However, in an interview from a local farmer in Gattaran, some farmers abandon their standing cornfield without harvesting the corn ear due to the very low buying price of corn grains that can no longer compensate the effort of harvesting. Moreover, the activities of the corn household in the field are seasonal. Hence, there is more slack time as compared to productive time. It is for this reason to divert some of household time to engage them into corn processing such as but not limited to ice cream. Although ice cream is already known to the consuming public, there is a need to revisit the sources of raw materials to make it more competitive in term of price and nutritional quality.
Ice cream has a high nutritional value consisting of small air cells dispersed in a partially frozen, continuous aqueous phase. The desired quality is achieved by both proper processing and formulation of the different ingredients, Goff & Hartel (2013).1 Corn syrup is an indispensable element in ice cream making. Technically speaking, corn syrup is commonly referred to as ‘glucose syrup’ or ‘corn starch hydrolysate syrup. Corn syrup are classified by their dextrose equivalence (DE), which indicates its degree of hydrolysis from starch to dextrose. The higher the DE, the sweeter the corn syrup will be until complete conversion with a DE of 100 is achieved. However, ice cream manufacturers usually used liquid or dry corn syrup products with a 28 -42 DE, Goff & Hartel (2013).1
This technology would increase the utilization of corn specifically the sweet pearl white corn (F1) variety grown in the region. It likewise opens the opportunity for product diversification resulting to additional income for the farmers and the household. The technology shall develop optimum corn (white corn /f1) ice cream preparation process that can be adopted by micro, small, and medium enterprises (MSMEs), LGUs and even existing ice cream makers in the region. This technology will also produce safe, nutritious, acceptable and all-natural ice cream products that will be available to individuals who are fond of sweets or desserts.
Objectives of the Study
Generally, this study aimed to formulate and test corn ice cream. In particular, it aimed to:
-
Formulate ice cream product
-
Determine the nutritional content of the processed ice cream
-
Determine the acceptability of the product thru sensory evaluation
Statement of the Null Hypothesis
There is no significant difference on the effect of starch content of the different treatments in terms of taste, texture, color and palatability.
Related Literature
Corn, technically known as Zea mays Lynn, is one of the Cagayan Valley's secondary crops. Corn production is critical since corn farming is many farmers' primary source of income. Cornice cream offers a lot of benefits. The absence of a well-established and efficient corn ice cream process in the area, on the other hand, restricts the range of goods that producers may provide to local and international customers. Sweet Pearl F1 is a rare hybrid waxy-sweet white maize with milky white kernels and high amylose content. It is a 60-65 day early maturing variety. Because of its great drought tolerance, it is ideal for planting in the dry season.
Ice cream is defined as a frozen product produced from a combination of dairy components that has at least 10% milkfat (Marshall and others 2003)2 before the addition of bulk ingredients such as flavorings and sweeteners, according to the United States Federal Regulations (21CFR135.110). Furthermore, (AM Abd El-Rahman et al.,1997)3viscosity of the ice cream mixes is affected by the source of milk fat and the addition of emulsifiers.Textural characteristics of ice (Syed QA, etal.)4 are the main variables influencing the product's commercial success. Furthermore, ice creams are characterized for particle size distribution of fat globules, melting resistance and amount of proteins in the aqueous phase (Granger C. 2004).5 Moreover,(M.M.R.Koxholt etal. 2001)6 the meltdown is dependent on the fat agglomerate sizes in the unfrozen serum phase. According to Buyck JR et.al (2011)7, ice cream production costs may be decreased by increasing the temperature of the storage freezer as a way of lowering energy costs. They also discovered that stabilizers and emulsifiers enhance ice cream texture by increasing viscosity and restricting free water molecule mobility. Nonetheless, their abundance may result in reduced melting and whipping capabilities. Sugar gives ice cream a sweet flavor and enhances thickness and bulkiness, but too much of it may cause it to become mushy if the solid percentage exceeds 42 percent.
According to Arbuckle (2000)8, ice cream must include less than 10% milkfat and 20% total milk solids to meet US regulatory requirements. It can't have more than 0.5 percent stabilizers and can't have less than 1.6 pounds of total food solids per gallon. Fat is 12 percent, milk solids non-fat (MSNF) is 11 percent, sugar is 15 percent, stabilizers and emulsifiers are 0.3 percent, and TS is 38.3 percent in an excellent average ice cream. Stabilizers enhance water binding capacity, thus they have no impact on taste or product value. In addition, stabilizers in ice cream smooth the texture, increase viscosity, and offer resistance to melting. Furthermore, flavor perception is determined by the nature and quantity of the flavor compound and its availability to the sensory system as a function of time(Li Z. 1997)9.
METHODS AND PROCEDURES
Materials
The materials used in this study were corn grits (hard dough stage) of sweet pearl (F1), whole milk, heavy cream, vanilla extract; sweetener table salt; and commercial corn starch.
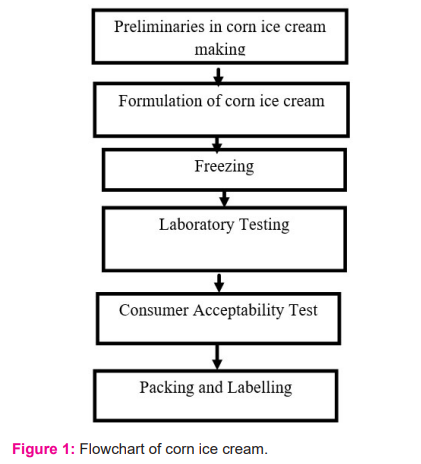
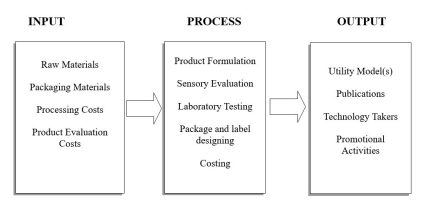
Experimental Procedures
Preliminaries in corn ice cream making. The raw materials were purchased from the local public market. However, the corn was taken from Alcala due to the desired variety. Other materials and ingredients were sorted according to the desired quantity. Different pre-treatment activities such as grinding, crushing and pressing were employed to facilitate the extraction of the aroma of corn and obtain the maximum starch. Suspended particles from corn liquid were removed through filtration using cheesecloth. This prevents the inclusion of unnecessary particles that will destroy the desired texture in the treatments.
Formulation of Corn Ice Cream. The following ingredients except corn starch were used at a constant amount in the product formulation, namely; desired level of corn kernels (sweet pearl-F1), whole milk, heavy cream, vanilla extract, sweetener, and table salt. Three formulations were made and were subjected to sensory evaluation with common parameters.
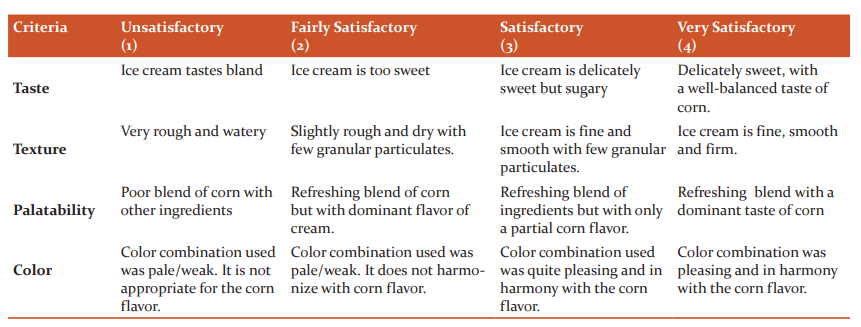
Consumer Acceptability Test or Sensory Analysis. The physical parameters include taste, texture, palatability, and color. The fifteen panels of evaluators were clustered into three to cover the three treatments. Each cluster evaluated the three treatment formulations and conducted three evaluations per treatment. A 10-point hedonic scale was used to determine the level of each of attribute namely taste, texture, palatability and color.The rubrics for the sensory evaluation are shown below;
Laboratory Testing. Treatments that are properly packed were submitted to FAST laboratory in Quezon City for Nutritional Analysis.
Packaging and Labeling. The developed products were packed in cups and labeled following the FDA label requirements in the containers.
Statistical Tool
The rubrics served as the source of raw data. The mean obtained in the score sheet were used to process the data and were analyzed using the One way ANOVA (Analysis of Variance). F-computed and F-tabular values were used to compare the level of significance among treatments at 1% and 5% level of significance.
RESULTS
Table 1 shows the result of sensory evaluation on the taste parameter of ice cream. The obtained mean of 3.27 falls within the level of satisfaction while 3.67 is nearly very satisfactory. In other words, the effect of starch in the formulation gave more than satisfactory result to consumer. However, using the ANOVA as revealed in Table 1a, showed that treatments were not significantly different from each other. The variable amount of starch from ¼ tsp to 1 tsp did not give any substantial difference in terms of taste among the treatments tested.
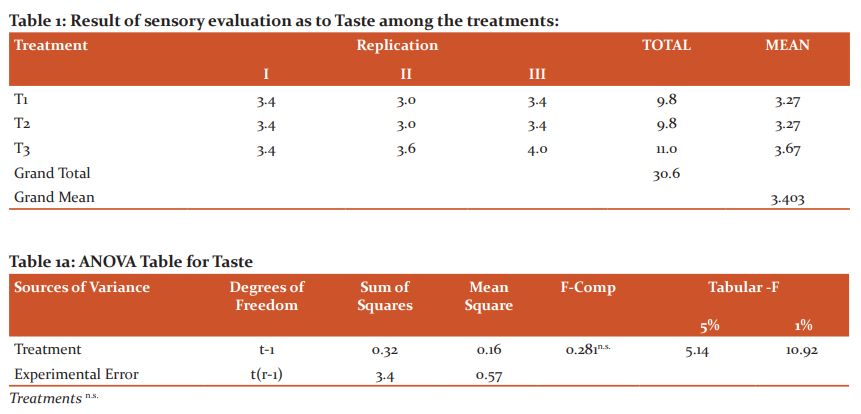
Table 2 shows the result of sensory evaluation on the texture parameter of the ice cream. The obtained mean of 3.27 and 3.20is nearly described it as satisfactory while that of 3.47 is nearly very satisfactory. In other words, the effect of the three levels of starch in the formulation gave satisfactory results to the consumer. Furthermore, ANOVA reveals as shown in Table 2a that the treatments gave highly significant differences among each other. The one teaspoon level of starch gave a substantial difference in term of texture as compared to the other treatments. Considering the findings of Syed et al., textural attributes of ice cream are the key factors determining the market success of the product. We can safely say therefore that T1& T2 did not give a comparable result to T3. Hence, one teaspoon is highly favorable compared to the other treatments.
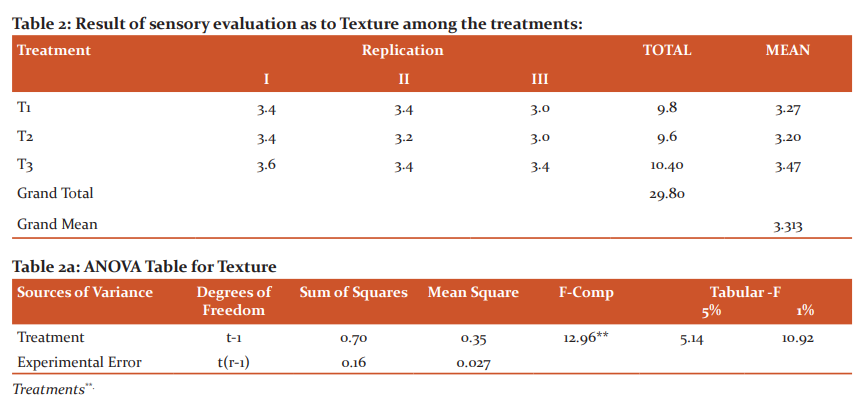
Table 3 shows the result of sensory evaluation on the color parameter of ice cream. The mean obtained of 3.27, 3.20, & 3.47 were described it as more than satisfactory. In other words, the effect of starch in the formulation gave more than satisfactory results to the consumer. However, using the ANOVA as revealed in Table 3a, the treatments were not significantly different from each other. The three amounts of starch did not give any substantial difference in terms of color among the treatments tested. Nonetheless, color combination used was quite pleasing and in harmony with the corn flavor as manifested in the rubrics.
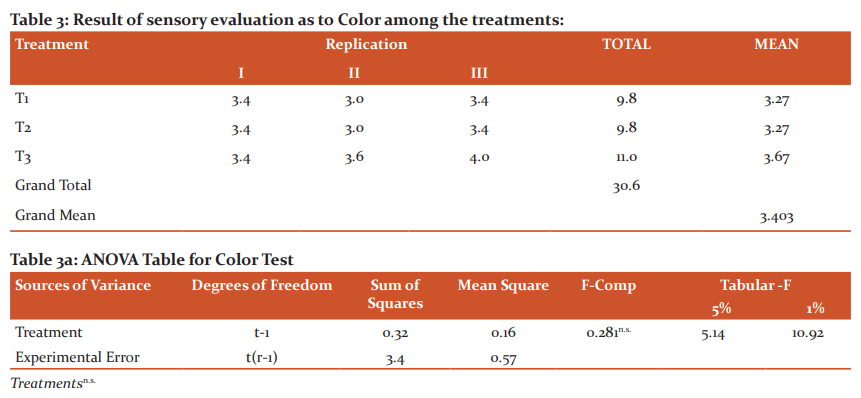
Table 4 shows the result of sensory evaluation on the palatabilityparameter of ice cream. The mean obtained of 3.13 and 3.07 is described as satisfactory while that of 3.87 is nearly very satisfactory. Looking at the rubrics, the effect of starch in the formulation gave more than a refreshing blend of ingredients but with only a partial corn flavor as observed by the consumer. Moreover, using the ANOVA as shown in Table 4a, it showed that the results gave a highly significant difference among the treatments tested. The varied amount of starch (as stabilizer) gave highly substantial difference in terms of palatability among the treatments tested. Hence, the overall palatability of T3 among the other treatments was highly commendable. The findings runs parallel to the statement of Syed et al. that stabilizers improve the viscosity of the ice cream as it enters the palate of the taster or evaluator.
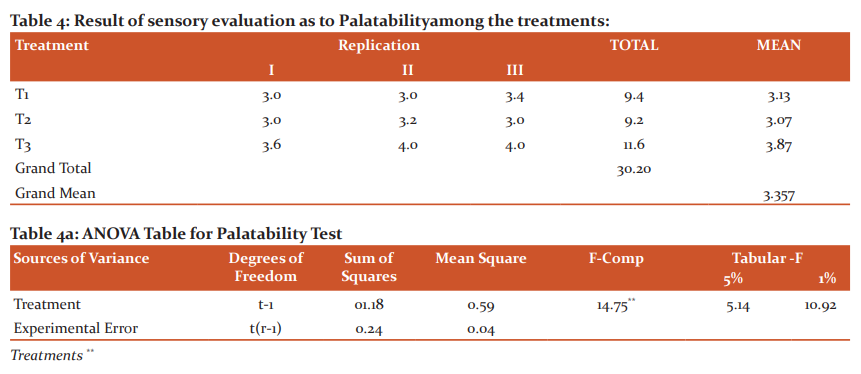
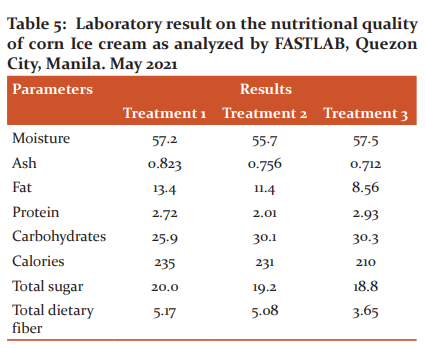
Table 5 shows that Treatment three (T3) had fat content of 8.56% which is way below T2 & T1. The findingsis inconsonant with the recommended level of the US Federal Regulations of fats of not more than 10% as mentioned by Marshall et al. (2003). The rest of the parameters exceeded the recommended values. The minimum sugar content of the treatments was recorded in T3 at 18.8%. However, this value is little bit higher than 15% as recommended by Arbuckle (2000). Nonetheless, this nutritional content could be managed during packaging so as to meet the recommended body daily allowance by the consumer.
DISCUSSION OF FINDINGS
The result of sensory evaluation on the taste parameter of ice cream. The obtained mean of 3.27 falls within the level of satisfactory while 3.67 is nearly very satisfactory. In other words, the effect of starch in the formulation gave more than satisfactory result to consumer. However, using the ANOVA as revealed in Table 1a, showed that treatments were not significantly different from each other. The variable amount of starch from ¼ tsp to 1 tsp did not give any substantial difference in terms of taste among the treatments tested.
The result of sensory evaluation on the texture parameter of the ice cream. The obtained mean of 3.27 and 3.20 is nearly described it as satisfactory while that of 3.47 is nearly very satisfactory. In other words, the effect of the three levels of starch in the formulation gave satisfactory results to consumer. Furthermore, ANOVA reveals as shown in Table 2a that the treatments gave highly significant differences among each other. The one teaspoon level of starch gave a substantial difference in terms of texture as compared to the other treatments. Considering the findings of Syed et al., textural attributes of ice cream are the key factors determining the market success of the product. We can safely say therefore that T1& T2 did not give a comparable result to T3. Hence, one teaspoon is highly favorable compared to the other treatments.
The result of sensory evaluation on the color parameter of ice cream. The mean obtained of 3.27, 3.20, & 3.47 described it as more than satisfactory. In other words, the effect of starch in the formulation gave more than satisfactory result to consumer. However, using the ANOVA as revealed in Table 3a, the treatments were not significantly different from each other. The three amount of starch did not give any substantial difference in terms of color among the treatments tested. Nonetheless, color combination used was quite pleasing and in harmony with the corn flavor as manifested in the rubrics.
The result of sensory evaluation on the palatability parameter of ice cream. The mean obtained of 3.13 and 3.07 is described as satisfactory while that of 3.87 is nearly very satisfactory. Looking at the rubrics, the effect of starch in the formulation gave more than a refreshing blend of ingredients but with only a partial corn flavor as observed by the consumer. Moreover, using the ANOVA as shown in Table 4a, showed that the results gave a highly significant difference among the treatments tested. The varied amount of starch (as stabilizer) gave highly substantial difference in terms of palatability among the treatments tested. Hence, the overall palatability of T3 among the other treatments was highly commendable. The findings run parallel to the stabilizers that improve the viscosity of the ice cream as it enters the palate of the taster or evaluator3.
Treatment three (T3) had fat content of 8.56% which is way below T2 & T1. The findings is inconsonant with the recommended level of the US Federal Regulations of fats of not more than 10% 2. The rest of the parameters exceeded the recommended values. The minimum sugar content of the treatments was recorded in T3 at 18.8%. However, this value is little bit higher than 15% 4. Nonetheless, this nutritional content could be managed during packaging so as to meet the recommended body daily allowance by the consumer.
CONCLUSIONS
The study, therefore, closes that the;
-
Three levels of starch did not give any substantial difference in terms of taste and color among the treatments tested;
-
The three levels of starch gave highly significant difference in terms of texture and palatability among the treatments tested; and
-
Treatment three (T3) surpassed the USDA recommendation of not more than 10% fat.
RECOMMENDATION
Based on the above findings of the study, the researchers recommend:
-
The use of one teaspoon (T3) commercial corn starch to ensure good results on palatability and texture; and
-
The use of treatment 3 (T3) due to its ideal level of nutritional analysis for fats in terms of recommended value.
-
Further study on the melting ability as it hardens in the ice cream maker.
-
More flavors or variants may be tested for nutritional value
ECONOMIC/ FINANCIAL IMPLICATIONS
Many culinary inventions are currently available on the market. Culinary scientists are overly preoccupied with finding food trends that both elderly and young people would like and become the finest in town (food trends). There are many various types of desserts available on the market, but the nutritional content of these meals is particularly important to consumers. People like ice cream as one of their favorite meals. While there are several commercial ice creams on the market, this research focuses on the palatability and nutritional value of its sources while not compromising the quality of its type. With the economic assistance of this kind of business, many food grabbers would utilize such business, which in turn would prove to be economically or financially beneficial to the company owners. When there is more company like this, there will be economic stability or financial independence. Similarly, smart consumers would be able to purchase goods with great nutritional value as well as those that are reasonably priced.
As asserted by Karaman et al.(2014)10 Frozen dessert producers have numerous options for changing the content, ingredients, shape, quality, and packaging of their goods. With such a diverse range of ingredients and techniques at one's disposal, the possibility for creating a plethora of delectable frozen desserts is almost limitless.
Acknowledgment: We acknowledge the immense help received from the researchers whose articles are cited and included in the references of this paper. Special thanks is also accorded to the laboratory facility for the analysis and to the group of expert who composts the panel for the sensory evaluation. The authors acknowledge the patience of those people who improved the composition of the study.
SOURCE OF FUNDING:
The researcher appreciates the assistance of the university research department for the financial support in conducting the study.
CONFLICT OF INTEREST:
The authors declare no conflicts of interest in preparing this article.
AUTHORS’ CONTRIBUTION:
Dr. Alfiler designed and conducted the study, and prepared the manuscript with important intellectual input from Dr. Natividad and Dr. Rodriguez. Cagayan State University provided funding for the study, statistical support in analyzing the data with input from Dr. Alfiler. We would like to thank Dr. Alma Manera for her editorial support during the publication of the study.
References:
-
Goff D.H. & Hartel R.W.(2013). Ice cream 7thedition, Springer, Boston, MA publisher New York 2013
-
Marshall RT, Goff H.D. 2003. Formulating and manufacturing ice cream and other frozen desserts. Food Technol. 57(5): 32-45.
-
El-Rahman AA, Madkor SA, Ibrahim FS, et al.(1997) Physical characteristics of frozen desserts made with cream, anhydrous milk fat, or milk fat fractions. J Dairy Sci, 80(9):1926–1935
-
Qamar Abbas Syed, Saba Anwar, Rizwan Shukat, Tahir. 2018. Effects of different ingredients on the texture of ice cream. https://medcraveonline.com/JNHFE/effects-of-different-ingredients-on-texture-of-ice-cream.html Received: October 02, 2018, | Published: November 20, 2018
-
Granger C, Leger A, Barey P, et al. (2005) Influence of formulation on the structural networks in ice cream. Int Dairy J. 15(3):255–262
-
Koxholt MMR, Eisenmann B, Hinrichs J. Effect of the fat globule sizes on the meltdown of ice cream. J Dairy Sci. 2001;84(1):31–37.
-
Buyck JR, Baer RJ, Choi J.(2011). Effect of storage temperature on quality of light and full-fat ice cream. J Dairy Sci. 94(5):2213–2219.
-
Arbuckle, W.S. 2000. Development of ice cream industry. Springer Science + Business Media New York.
-
Li Z, Marshall R, Heymann H, et al. Effect of milk Fat content on flavor perception of vanilla Ice cream J Dairy Sci. 1997;80(12):3133–3141
-
Karaman S, Toker OS, Yüksel F, et al.(2014). Physicochemical, bioactive, and sensory properties of persimmon-based ice cream: Technique for order preference by similarity to ideal solution to determine optimum concentration. J Dairy Sci. 2014;97(1): 97–110.
|
 IJCRR
IJCRR 


 This work is licensed under a Creative Commons Attribution-NonCommercial 4.0 International License


