IJCRR - 13(22), November, 2021
Pages: 43-49
Date of Publication: 20-Nov-2021
Print Article
Download XML Download PDF
Assessing the Risk Factors of Malnutrition in Uttar Pradesh
Author: Mishra S, Dubey A, Srivastava M, Singh R
Category: Healthcare
Abstract:Introduction: Malnutrition among under-five children is a topic of major concern for the health authorities in India. Uttar Pradesh is the most populous state of India which contributes 16.50% of India's total population. There is no improvement in the nutritional status of children in Uttar Pradesh over the years. Aim: The present paper aims to assess the risk factors associated with malnutrition among under five-year children in Uttar Pradesh. Materials and Methods: This analysis is based on the data from the National Family Health Survey (NFHS-4, 2015-16). Stunt�ing, wasting and underweight act as dependent variables. Various socio-economic and demographic factors like age, literacy, schooling, religion, caste/tribe, etc were taken as independent variables. The logistic regression technique is used to estimate the odds of being malnourished. Results: Age of child and mother's education, wealth index and preceding birth interval had a significant association with stunting and underweight. The result shows that age (odds ratio>1) had a positive and preceding birth interval, mother's education and wealth index had a negative relation with stunting. Conclusion: The deeper the roots the greater the fruits. Similarly, the more healthy, more educated and more aware the mother will be, the more nourished the baby will be. Therefore the government should spread awareness of birth spacing among parents and should enhance the medical facilities for mothers and their newborn children so that they can be assessable to people belonging to poor families.
Keywords: Chi-square test, Logistic regression, NFHS, Stunting, Underweight, Wasting
Full Text:
INTRODUCTION:-Malnutrition, according to the World Health Organization (WHO), refers to deficiencies, excesses, or imbalances in a person's intake of energy and/or nutrients. Malnutrition among under-five children is a topic of major concern for the health authorities in India. According to a study, low birth weight is the major factor among all indicators of malnutrition. The World Bank reported India as one of the highest-ranking countries in the world is malnutrition. The prevalence of underweight children in India is nearly double that of Sub-Saharan Africa which have a serious effect on mobility, mortality, productivity and economic growth. 1 According to the 2019 Global Hunger Index (GHI) report, out of 117 countries India ranked 102th with a serious issue of child wasting. Nearly 20% of children under five years of age in India are wasted.
Uttar Pradesh, with a population of nearly 200 million, is the most populous state of India. According to census 2011, Uttar Pradesh is contributing 16.50% of India’s total population. So our state’s poor performance in health indicators can affect our country a lot. That’s why it is a cause of concern for the country. According to the NitiAayog Health indicator report of 2019, the overall score of Uttar Pradesh in health declined from 33.69 in 2015-16 to 28.61 in 2017-18. 2 One of the important causes of this decline is low birth weight. The lack of the right amount of nutritional intake leads to various forms of malnutrition. Studies show that Uttar Pradesh is one of the highest malnutrition states in the country. There is no improvement in the nutritional status of children in Uttar Pradesh over the years. Though the percentage of stunted declined over the year in U.P. however it is higher than the national average.
Mother's nutritional status, lactation behaviour, women's education, and sanitation are some factors responsible for malnutrition in the country. Here we will analyze our data using three indicators of malnutrition, termed stunting, wasting and overweight. According to a study done by Dessie et al. (2019) in Ethiopia, it was found that maternal education, nutritional status, anaemia, place of delivery, and preceding birth interval were associated with malnutrition among children of age 6-59 months.3 The studies of Rao and Rao (1994) also showed that there is some association of malnutrition with socio-economic factors, nutritional intake, mother’s education, climate, and religion.4 The study of Hong et al. (2006) on children of Bangladesh showed that household wealth inequality has a strong association with childhood adverse growth rate stunting.5 In their study Saha et al. (2008) showed that the current infant feeding practices have a positive effect on the growth of infants and young children.6 In this paper, we will analyze the nutritional status of under 5 age children in Uttar Pradesh through height-for-age, weight for age and weight for height.
AIM: - The present paper aims to assess the risk factors associated with malnutrition among under five-year children in Uttar Pradesh.
OBJECTIVE:-The objectives of the study are:
(1) To assess the category-wise prevalence of stunting, wasting and underweight in children of 0-5years of age in Uttar Pradesh,
(2) To analyze the associations of socio-economic and demographic factors at the individual and household level with child malnutrition.
LITERATURE REVIEW: -One of the most important public health problems in India is malnutrition in children. Malnutrition harms future human performance. A recent study estimated that about 53% of all deaths in young children are attributable to being underweight.7According to a study on the nutritional status of school-age children, the risk of malnutrition was significantly higher among children living in joint families, children whose mother's education was (less than or equal to) 6th standard and children with working mothers.8In their study Best C. et al. found that underweight and thinness was most prevalent in populations from South-East Asia and Africa, whereas in Latin America, it was generally below 10%.9The anthropometric results of a study in QwaQwa also indicated that 2.8% of the total group of respondents was severely stunted and that 11.3% were stunted.10 In South Africa, stunting and underweight remain a public health problem in children, with a prevalence of 20% stunting and almost 10% underweight. 11 Inthe Dietary Diversity and Nutritional Status of Adolescent Girls in Selected Urban Slum of Dhaka City, A study was conducted to assess the relationship between nutritional status and individual dietary diversity. It was found that about 80% had normal weight, 3.3% of the girls were severely thin, 10% of the girls were moderately thin, and 6.7% were overweight. Again 10% of the girls were found severely stunted and 24% of girls were found to be mild to moderately stunt. The nutritional status and individual dietary diversity of the adolescent girls were positively related. 12
METHODOLOGY:-
DATA SOURCE:-
This analysis is based on the data from the National Family Health Survey (NFHS-4, 2015-16) which is fourth in the series of NFHS. International Institute for Population Sciences (IIPS), Mumbai conducts this survey in collaboration with many other organizations as ORC Macro, Calverton, Maryland, USA and the East-West Center, Honolulu, Hawaii, USA. The International Institute for Population Sciences (IIPS) acts as the nodal agency for this project by the Ministry of Health and Family Welfare, Govt. of India New Delhi which provides coordination and technical guidance for NFHS.
The NFHS-4 sample is a stratified two-stage sample. Four rounds of NFHS has been done till now NFHS-1 for 1992-93, NFHS-2 for 1998-99, NFHS-3 for 2005-06 and NFHS-4 for 2015-16. Unlike NFHS-3, NFHS-4 provided data on Human Immunodeficiency Virus (HIV) prevalence for all 29 states and union territories including 640 districts. NFHS-4 also collected data from a slum population of 8 big cities, namely Delhi, Chennai, Hyderabad, Mumbai, Kolkata, Indore, and Meerut. The NFHS-4 sample covered 699,686 women aged 15-49 and 112,122 menage 15-54 residing in all the states and union territory. The survey collected data on men and women’s background characteristics e.g., age, literacy, schooling, religion, caste/tribe, etc. the Information on nutritional status, maternal factors of fertility, marriage, family planning, and women’s empowerment, HIV or Acquired Immune Deficiency Syndrome (AIDS) etc. is also provided by NFHS-4.
Mothers having at least one child of fewer than 5 years of age were taken as units for our study. The survey collected data on the height and weight of children of less than 60 months. The socio-economic and demographic factors influencing child malnutrition which we have taken in our study are Age group: "<1 year", and ">=1" years; Place of residence: Rural, and urban; Religion: Hindu, Muslims, and others; Caste: SC, ST, and others; Sex: male and female; Breastfeeding: more than 6 months and up to 6 months; Preceding birth interval: "<24 months" and ">=24 months"; Mother's education level: >=primary, secondary and higher; Wealth index: low, medium, high; Working status: Currently working, and not currently working; Place of residence: Rural, and urban; Religion: Hindu, Muslims, Christian and others; and Caste: SC/ST, OBC and others.
METHOD: The present study focuses on the effect of all socio-economic and demographic factors on child stunting, wasting and underweight. In this study, the nutritional status of the children is analyzed using three indicators of malnutrition: stunting, wasting and underweight. Stunting is measured by height-for-age z-scores (HAZ), wasting is measured by weight-for-height Z-score (WHZ) and underweight is measured by weight-for-age Z-score (WAZ). According to WHO criterion based on standard deviation(SD) units, a child is termed as ‘severely stunted’ if the children’s height for age Z-score below–3, ‘moderately stunted’ if the child has Z-scores greater than or equal to –3 and less than –2. ‘Well nourished’ children are those whose height for age Z-scores are greater than or equal to –2. A child is said to be severely wasted if the children’s weight for height Z-score is below –3SD, moderately wasted if the child weights height Z-scores greater than or equal to –3 and less than –2. Otherwise, he/she will be termed as normal. Similarly, a child is termed as underweight if he/she weights age z-score below -2 SD, overweight if the weight for height Z score is above +2SD. Otherwise, he/she will be termed as normal.
In the second step of the analysis, the logistic regression technique is used to estimate the odds of being malnourished of the groups that have a higher or lower risk of malnutrition in the study population. An odds ratio (OR) measures the strength of the association between two events. The odds ratio represents the ratio of the odds of an outcome in the presence of a particular exposure and the odds of that outcome in the absence of that exposure. In the logistic regression table, the exponential function of the regression coefficient (EXPB) is the odds ratio associated with a one-unit increase in exposure. To create the dependent variable, children whose z-scores are below–2 are coded 1 and those with z-scores of –2 or higher are coded 0. The predictor (independent) variables are entered into the regression equation, thus the results obtained are compared with the reference category. In this paper statistical software package SPSS (20 version) is used for the statistical analysis. P< 0.05 is considered statistically significant.
RESULT: - In NFHS-4, 41751 children (from Uttar Pradesh) under the age of 5 years were surveyed out of which 5286 were missing cases. In our study, 78.1% of the cases belonged to the rural area and 21.9% belonged to the urban area. The percentage of males was 52.5% and females were 47.5%. 57% of the mothers had ≤primary education and 10.2% of the mothers had higher education. The percentage of children who belong to poor families was 55.3%. 78.1% of the children belong to the Hindu religion.
.png)
Table 1 displays the age-wise distribution of stunted, wasted and underweight children. The overall percentages of stunting, wasting and underweight children in Uttar Pradesh were 45.9%, 17.8%, and 38.9% respectively which means the prevalence of stunting in children was higher than wasting and underweight. An increasing trend in the percentage of stunted children in Uttar Pradesh was observed up to the age of 24 months and thereafter it decreased. The same trend was found in the case of underweight children up to the age of 24 months after that it oscillates. The percentage of wasted children showed a decreasing trend throughout the ages. Prevalence of stunting and underweight was found to be the highest in the age group 18-24 months (56.1% and 42.7% respectively) whereas the maximum prevalence of wasting was found in the age group 0-3 months (31.1%).
Differentials of malnutrition among 0-5 year children in Uttar Pradesh had been observed by taking child, mother and household level factors. Here we had seen the relationship of these factors with height for age, weight for height and weight for age. Table 2 shows the percentage distribution of 36465 children of less than 60 months by selected child, mother, and household-level characteristics. Table 2 clearly shows that there was no difference between females and males in terms of percentage of stunted and underweight but wasting was higher for males (19%).
Percentage of stunted, wasted and underweight children in Uttar Pradesh among illiterate or primary level educated mothers were 53.4%, 18.1% and 44.8% respectively which dropped rapidly to 24%, 16.9% and 22.2% among higher-educated mothers. Children living in rural areas had a higher prevalence of stunting (47.9%), wasting (17.9%) and underweight (40.4%) as compared to children of the urban area. Similarly, the children having a low wealth index had a percentage of 54.2% stunted, 18.6% wasted and 45.5% underweight which falls to 31.1%, 16.3% and 27.6% respectively among children having a higher wealth index. Schedule caste and schedule tribe had higher stunting (51.8%), wasting (19.2%) and underweight (44.1%) percentages. The prevalence of stunting and underweight were highest in Muslims which is 46.8% and 39.1% respectively whereas wasting was highest in Hindu (18%). This clearly shows that the percentage of stunted, wasted and underweight children decreases with an increase in levels of mother's education, household condition index and changing the place of residence.
.png)
Table 3 shows the results of the logistic regression of stunting, wasting and overweight respectively on the socio-economic and demographic characteristics of the children aged less than 60 months in Uttar Pradesh. The table gives standard errors, odds ratio and the level of significance along with the coefficients. It shows that among all individuals and household level factors, the age of children, preceding birth interval, mother’s education level, and household condition index are the most important factors affecting malnutrition.
It was found that there was a significantly higher risk of stunting and underweight among children with the increasing age, children with preceding birth interval <24months, children whose mother had low educational attainment (<=primary), and children with low Household condition index, whereas the risk of wasting was significantly higher in children having higher age i.e. as the age of the children increases, the risk of stunting and underweight decreases whereas the risk of wasting increase with increasing age.
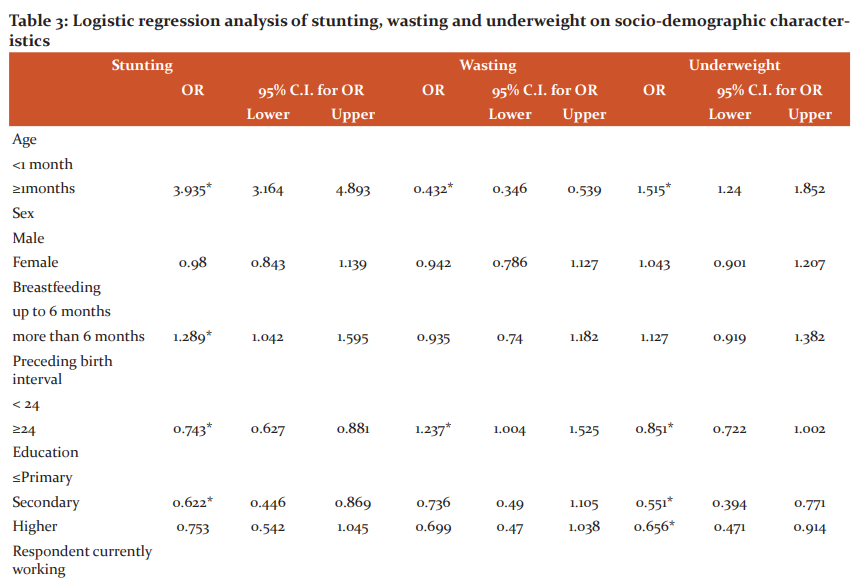
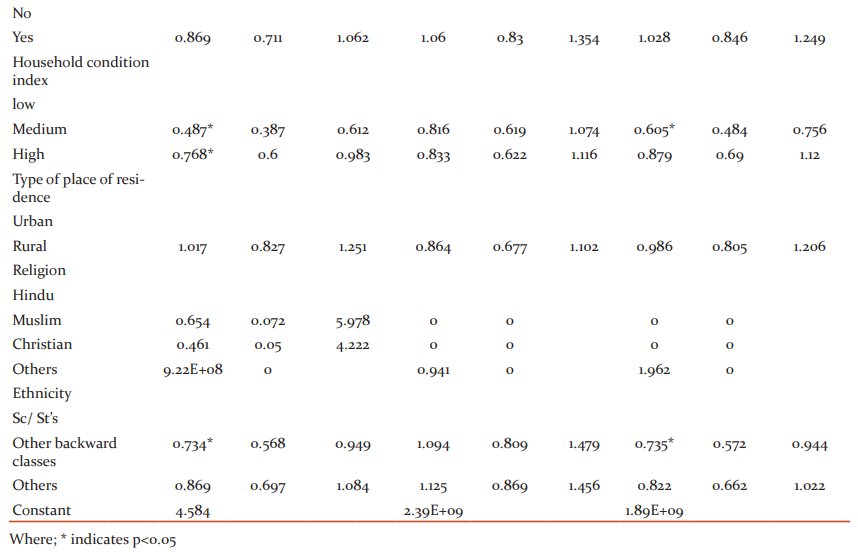
This leads to the conclusion that the child’s age and mother’s education, wealth index and preceding birth interval had a significant association with stunting and underweight whereas wasting only had a statistically significant association with the age of the children. Some remaining factors like gender, place of residence and work of parents did not have a significant association with stunting, wasting and underweight whereas breastfeeding and ethnicity were showing a mixed effect on malnutrition.
As we know if the odds ratio is greater than 1, the relationship is positive and if it is less than 1, the relationship is negative. Thus age (odds ratio=3.935, C.I= (3.164, 4.893)) had a positive and preceding birth interval (odds ratio=0.743, C.I= (0.627, 0.881)), mother’s education (odds ratio=0.622, C.I= (0.446, 0.869)) and wealth index (odds ratio=0.768, C.I= (0.600, 0.983)) had a negative relation with stunting. The same was also true for underweight but in case of wasting, age of children (odds ratio=0.432, C.I= (0.346, 0.539)) had a negative relation and preceding birth interval (odds ratio=1.237, C.I= (1.004, 1.525)) had a positive relation
DISCUSSION:-Uttar Pradesh is the most populous state of India where the problem of malnutrition is very big. According to NFHS-4, in rural U.P. the children of age 6-23 months not receiving an adequate diet is only 5%. Among the malnutrition indicators, stunting wasting and being underweight are some of the biggest contributors to disease burden. The state and Central governments have adopted several interventions to tackle the problem of malnutrition, such as the State Nutrition Mission (SNM-UP), Integrated Child Development Services (ICDS) and the National Nutrition Mission (NNM). In India, 706 thousand children died in 2017 only due to malnutrition. Uttar Pradesh accounts for 15% of these deaths which implies a loss of over 100 thousand children.
In our study, it was seen that there is no statistically significant difference between females and males in terms of percentage of stunted and underweight which is similar to those of Kaur et al. and Chuc et al.13,14It was found that the risk of stunting and underweight increases with age and attains its maximum value between the age 18-24 months and then goes downward which was also found by Martorell et al.15
Preceding birth interval is one of the important factors affecting malnutrition in children. Studies show that if pregnancies and births are spaced too closely, women may not have the opportunity to replenish their nutritional stores stressed during pregnancy and/or breastfeeding, which results in predisposing infants and children to adverse outcomes, including preterm birth, low birth weight, as well as stunting and underweight.16 It is clear from our study that the risk of stunting and being underweight was significantly higher in the case of the short birth interval which was also found by Gribble et al. (2008).17 According to their study, the odds of stunting significantly increases in the birth intervals less than 24 months and intervals of 24–35 months in comparison to intervals of 36–59 months (<1.30; 95% CI: 1.05–1.64) = 1.52; 95% confidence interval (CI): 1.21–1.92; 25–36 months OR = 24 months Odds Ratio (OR).
Maternal education is highly associated with the health of a child. A child born to a well-educated mother suffers less from malnutrition. Increasing parental education had a positive effect on child nutrition. Parents with high levels of schooling provide their children with a better environment to grow and have a good knowledge of nutrients. Results from the present study showed that the mother's education had a significant association with stunting and underweight with an odds ratio>1 which means the risk of malnutrition decreases with the increase in the mother's educational status. This finding was similar to those of Som et al., Dubey et al., Abuya et al. and by many others.18, 19, 20
Poor household condition of children is also a factor for poor nutritional status in children. In our study, Household Condition Index (HCI) was negatively associated with stunting and underweight which was found similar to the study done by Kasay et al.21According to their study, the poorest wealth index had a higher risk of malnutrition. Their result was based on data from the Ethiopian Demographic and Health Survey (EDHS) 2016 conducted by the Central Statistical Agency (CSA) of Ethiopia. All other factors except for mother’s education, HCI, preceding birth interval and child age, fail to significantly explain the health status of children.
CONCLUSION: Health is the first need of our country. The Lack of the right amount of nutritional intake leads to various forms of malnutrition therefore the government should make various policies to eradicate the problem of malnutrition and should improve the health status of children. Improving women's status in the country should be a necessary step taken by the health authorities. Results show that the risk of stunting and underweight is highest in the age group 18-24 months therefore the government should focus on providing better nutrition to children of nearly 2 years of age. The government should spread awareness of birth spacing among parents and should encourage them by making policies. Many policies and interventions should be made to give the children a better environment to grow. This paper inspires us for the better education of girl children. Government should enhance the medical facilities for mothers and their newborn children so that they can be assessable to people belonging to poor families. The deeper the roots the greater the fruits similarly the more healthy, more educated and more aware the mother will be, the more nourished the baby will be.
CONFLICT OF INTEREST: -No conflict of interest was reported by all authors.
SOURCE OF FUNDING: -Self-finance study, no second-party funding involved. The authors alone are responsible for the writing of this article.
AUTHORS CONTRIBUTION: - Dr Arun Kumar Dubey and Dr Manushi Srivastava conceived the presented idea. Sadhana Mishra wrote the manuscript with support from Rashmi Singh. Dr Arun Kumar Dubey and Dr Manushi Srivastava supervised the findings of this work. All authors discussed the results and contributed to the final manuscript.
ACKNOWLEDGEMENT: -We acknowledge Dr Manushi Srivastava (Assistant professor in IMS, BHU) and Rashmi Singh (Research Scholar) for the total support and necessary permission required for the article.
References:
1. Gragnolati M, Shekar M, Gupta MD. India’s undernourished children: A call for reform and action [Internet]. Washington, D.C., DC: World Bank Publications; 2006. Available from: http://dx.doi.org/10.1596/978-0-8213-6587-8
2. NITI Aayog, The World Bank M of H& FW. Healthy States, Progressive India: Report on the Ranks of States and Union Territories. Heal States, Progress India Rep Rank States Union Territ. 2019;
3. Dessie ZB, Fentie M, Abebe Z, Ayele TA, Muchie KF. Maternal characteristics and nutritional status among 6–59 months of children in Ethiopia: further analysis of demographic and health survey. BMC Pediatr [Internet]. 2019;19(1):83. Available from: https://doi.org/10.1186/s12887-019-1459-x
4. Rao DH, Rao KM. Levels of Malnutrition and Socio-economic Conditions Among Maria Gonds. J Hum Ecol [Internet]. 1994 Jul 1;5(3):185–90. Available from: https://doi.org/10.1080/09709274.1994.11907096
5. Hong R, Banta JE, Betancourt JA. Relationship between household wealth inequality and chronic childhood under-nutrition in Bangladesh. Int J Equity Health [Internet]. 2006;5(1):15. Available from: https://doi.org/10.1186/1475-9276-5-15
6. Saha KK, Frongillo EA, Alam DS, Arifeen SE, Persson LA, Rasmussen KM. Appropriate infant feeding practices result in better growth of infants and young children in rural Bangladesh. Am J Clin Nutr [Internet]. 2008 Jun;87(6):1852–9. Available from: https://pubmed.ncbi.nlm.nih.gov/18541577
7. Bharati S, Pal M, Bharati P. Determinants of Nutritional Status of Pre-School Children in India. J Biosoc Sci [Internet]. 2008/11/01. 2008;40(6):801–14. Available from: https://www.cambridge.org/core/article/determinants-of-nutritional-status-of-preschool-children-in-india/DA0E8F55A5A4F0DC103044C3EB7AA57F
8. Srivastava A, Mahmood SE, Srivastava PM, Shrotriya VP, Kumar B. Nutritional status of school-age children - A scenario of urban slums in India. Arch Public Heal [Internet]. 2012;70(1):8. Available from: https://doi.org/10.1186/0778-7367-70-8
9. Best C, Neufingerl N, van Geel L, van den Briel T, Osendarp S. The Nutritional Status of School-Aged Children: Why Should We Care? Food Nutr Bull [Internet]. 2010 Sep 1;31(3):400–17. Available from: https://doi.org/10.1177/156482651003100303
10. Oldewage-Theron W, Egal A. Nutrition knowledge and nutritional status of primary school children in QwaQwa. South African J Clin Nutr [Internet]. 2010 Jan 1;23(3):149–54. Available from: https://doi.org/10.1080/16070658.2010.11734329
11. Labadarios D, Swart E, Maunder E. Executive summary of the National Food Consumption Survey Fortification Baseline (NFCS-FB-I) South Africa, 2005. South African J Clin Nutr. 2008 Jan 1;21:245–300.
12.Alam S, Rahman N, Mia A, Islam K, Rahman MN. Dietary Diversity and Nutritional Status of Adolescent Girls in Selected Urban Slum of Dhaka City in Bangladesh. 2018.
13. Kaur H, Biswas M, Malik P. Assessment of Nutritional Status of Under-5 Children Using WHO Growth Standards. Int J Sci Res. 2018 Jul 1;7:30.
14. Chuc D Van, Hung NX, Trang VT, Linh DV, Khue PM. Nutritional Status of Children Aged 12 to 36 Months in a Rural District of Hungyen Province, Vietnam. Tran BX, editor. Biomed Res Int [Internet]. 2019;2019:6293184. Available from: https://doi.org/10.1155/2019/6293184
15. Martorell R, Young MF. Patterns of stunting and wasting: potential explanatory factors. Adv Nutr [Internet]. 2012 Mar 1;3(2):227–33. Available from: https://pubmed.ncbi.nlm.nih.gov/22516733
16. Conde-Agudelo A, Belizán JM, Breman R, Brockman SC, Rosas-Bermudez A. Effect of the interpregnancy interval after an abortion on maternal and perinatal health in Latin America. Int J Gynecol Obstet [Internet]. 2005 Apr 1;89(S1): S34–40. Available from: https://doi.org/10.1016/j.ijgo.2004.08.003
17. Gribble JN, Murray NJ, Menotti EP. Reconsidering childhood undernutrition: can birth spacing make a difference? An analysis of the 2002–2003 El Salvador National Family Health Survey. Matern Child Nutr [Internet]. 2009 Jan 1;5(1):49–63. Available from: https://doi.org/10.1111/j.1740-8709.2008.00158.x
18. Som S, Pal M, Bharati P. Role of individual and household level factors on stunting: A comparative study in three Indian states. Ann Hum Biol [Internet]. 2007 Jan 1;34(6):632–46. Available from: https://doi.org/10.1080/03014460701671772
19. Dubey P, Tiwari N, Jha R. Regional Disparity in Nutritional Status in India: An Examination. 2018 Jun 1;8.
20. Abuya BA, Ciera J, Kimani-Murage E. Effect of mother’s education on child’s nutritional status in the slums of Nairobi. BMC Pediatr [Internet]. 2012;12(1):80. Available from: https://doi.org/10.1186/1471-2431-12-80
21. Kasaye HK, Bobo FT, Yilma MT, Woldie M. Poor nutrition for under-five children from poor households in Ethiopia: Evidence from 2016 Demographic and Health Survey. PLoS One [Internet]. 2019 Dec 20;14(12):e0225996. Available from: https://doi.org/10.1371/journal.pone.0225996
|
 IJCRR
IJCRR 


 This work is licensed under a Creative Commons Attribution-NonCommercial 4.0 International License


