IJCRR - 13(20), October, 2021
Pages: 46-51
Date of Publication: 24-Oct-2021
Print Article
Download XML Download PDF
Study on Correlation of Visual Acuity and Foveal Thickness in Diabetic Macular Edema Patients
Author: Singh Punit, Mehta Niklank, Vora Jainam, Modi Samiksha, Dholu Suchi, Malhotra Devika
Category: Healthcare
Abstract:Introduction: The purpose of this study was to clinically diagnose and quantify the Diabetic macular oedema in terms of Central Foveal Thickness (CFT) and Central Subfield Thickness (CST) on a 3D-OCT scan and its correlation with the visual acuity of subject patients enrolled in the study. Aims: • To Diagnose Diabetic macular oedema and its correlation with Visual Acuity. • To Quantify Diabetic macular oedema in terms of Central Foveal Thickness and Central Subfield Thickness. Methodology: In total 50 patients that met the inclusion and exclusion criteria were enrolled on the study, All patients underwent detailed ophthalmological examination. A complete ophthalmic examination including Visual acuity, Intraocular pressure, Anterior segment examination using slit-lamp biomicroscopy, dilated fundus examination through spectral-domain 3-D OCT and was assessed for the presence of diabetic macular oedema, changes in the fundus and its correlation with CFT (central foveal thickness) and CST (Central Subfield Thickness) were measured by OCT. Result: Mean BCVA was 0.59\? 0.58 ranging from 0.02 to 3.0 on Log MAR. Macular thickness measured as CFT had a mean of 353.5\?152.5 µ ranging 202 to 765 microns, whereas CST showed a mean of 370.5\?144.4 microns ranging 231 to 770 microns. The BCVA had a moderate correlation with CST. Correlation of BCVA was better with CFT(spearman's r=0.532;p=0.000)than that of CST(spearman's r=0.586;p=0.000). Conclusion: We concluded that CFT is more accurate to predict the prognosis of visual outcome in cases of Diabetic macular oedema suggesting the worst visual outcome in cases with diffuse retinal thickening with increased CFT.
Keywords: Best-corrected visual acuity, Diabetic macular oedema, 3D-OCT scan, Central Foveal thickness, Central Subfield Thick�ness, Diffuse retinal thickenin
Full Text:
INTRODUCTION:
Diabetic macular oedema (DME) and Diabetic retinopathy (DR) are among the most common ocular complications of diabetes leading to blindness in the older age population in most of the developed countries.
Diabetes mellitus is a fast-growing global health problem that has huge social and economic consequences. It is estimated that in 2000, there were globally 171 million people aged more than 20 years suffering from this disease. This number is estimated to increase to 366 million by 2030. An ageing population and obesity are two main reasons for the increase in prevalence. The majority of this population resides in India and China.1
India remains top on ranking with estimates of about 31.7 million of the above population in 2000 and this would be expected to rise to 79.4 million by 2030.2
DR occurs both in type 1 and type 2 diabetes mellitus and has been shown that nearly all type 1 and 75 per cent of type2 diabetes will develop DR after 15 yr duration of diabetes.
In the developed country population, Diabetic retinopathy is the cause of visual disability in and in 33 % of Type-II DM (Diabetes mellitus) and 86 % of Type-I DM3
Due to diversified presentations of Diabetic macular oedema (DME), objective assessment by 3D spectral-domain optical coherence tomography (3D SD-OCT) have become a valuable tool.
Over the years, treatment options for DME have evolved and been studied, including grid laser photocoagulation, vitrectomy, intravitreal injection of bevacizumab,avastatin& corticosteroids.
The efficacy of this therapy has been evaluated by assessing the best-corrected visual acuity (BCVA) of patients and correlating with their macular thickness of affected using optical coherence tomography (OCT).
A correlation between BCVA and the OCT- measured macular thickness has been reported but its significance is variable.4
Through these studies, authors have found that eyes with Diabetic macular oedema have poor visual prognosis and outcomes despite complete successful treatment and resolution of oedema.
In this study, we assessed the macular thickness and correlated it with the best corrected visual acuity of study subjects. The patient’s macular thickness was calculated using 3D-OCT and quantified in terms of central foveal thickness and central subfield thickness and both the variables were compared in different population groups. Each population group in terms of age and sex were randomized and statistical analysis were done.
METHODS AND MATERIALS:
Study setting
The study was conducted in the Department of Ophthalmology, Dhiraj Hospital, SBKS Medical Institute and Research Centre, Piparia, Vadodara from May 2016 to April 2017
After getting approval from the ethical committee SBKS MI&RC,
Ethical clearance no: SVIEC/ON/MEDL/BNPG20/2115
Study design:
Prospective, Non-Randomized and Observational Study
Sample size: 50 diabetic cases
Patient selection was random
Study population:
Total 60 patients with diabetes that visited the Ophthalmology Department, Dhiraj hospital from the date of approval of the Ethics Committee till April 2018 were enrolled in the study. Out of all enrolled patients underwent detailed fundus examination and OCT of both eyes for clinical diagnosis of diabetic macular oedema and their correlation with central foveal thickness was assessed. The patient was enrolled in this cross-sectional study after informed consent was approved by the ethical committee.
Inclusion criteria:
-
Patients of average age >40 years
-
Any type of Diabetes Mellitus, irrespective of the duration of disease and clinical control.
-
VA and refraction with spherical equivalent between +5.00 to -5.00 D,
-
Diabetic retinopathy with clinically significant macular oedema.
-
The OCT retinal thickness of at least 230µm in the central subfield (CST)..
Exclusion criteria:
-
Marked retinal swelling: It attenuates the measurement beam and causes shadowing of the outer retinal layers. Thus, such eyes are to be excluded from the study.
-
Eyes with hard exudates: It causes intense shadowing effects, on horizontal and vertical OCT scan lines across the central fovea.
-
The presence of any other macular abnormality such as an epiretinal membrane or vitreomacular traction.
-
Significant media opacities (eg. Cataract of Grade III or more on LOCS grading, vitreous haemorrhage, corneal opacity) can result in a poor OCT signal.
Method of data collection:
All subjects went through an ophthalmological examination. This consisted of, medical history (including ocular and family histories), visual acuity, refraction, OCT testing of both the macula and peripapillary Nerve fibre layer using the 3D OCT unit on the same day.
Assessment of the patient:
It is a prospective cross-sectional study on patients from MAY 2016 to MAY 2017 attending, Dhiraj general hospital, SBKS MIRC, Sumandeep Vidyapeeth, Piparia, Vadodara who will satisfy all inclusion and exclusion criteria.
-
Firstly, based on history and lab reports, I found all the patients with diabetes.
-
Then patient’s visual acuity was noted and the patient was examined through slit-lamp biomicroscopy for anterior segment evaluation and fundus examination by direct and indirect ophthalmoscopy.
-
When diabetic retinopathy was confirmed by slit lamp and ophthalmoscopy finding, the fundus was examined on a 3D OCT machine.
-
On OCT machine thorough examination of the fundus was done, and a clear picture of the optic disc, macula, fovea will be taken and studied.
-
Then we correlate visual acuity and foveal thickness in the number of diabetic retinopathy patients and changes that will be seen after taking treatment in these parameters.
-
The macular thickness map was divided into nine sections, and it displayed as 3 concentric circles, I). the central circle, II). Inner ring and III) outer ring, with each ring divided into four quadrants. The central circle, inner ring, and outer ring are in the macular thickness map with diameters of 1 mm, 3 mm, and 6 mm, respectively.
-
The central disc, inner ring, and outer ring diameters will be taken as 1 mm, 2.22 mm, and 3.45 mm, respectively.
-
Retinal thickness maps were colour-coded, with brighter colours for thicker retinal areas and darker colours for thinner ones.
Result and analysis: -
We find 51 eyes from 31 patients who had clinically significant macular oedema which was demonstrated by a 3D-OCT scan.
Of this 9 eyes were excluded from the study: 3 patients had a vitreous haemorrhage, one had a cataract, 2 were with hard exudates and 3 patients had epiretinal membrane.
So we studied, 42 eyes from 50 patients contributed by 19 males and 9 females with a mean age of 58.7 years, ranging from 45-94 years
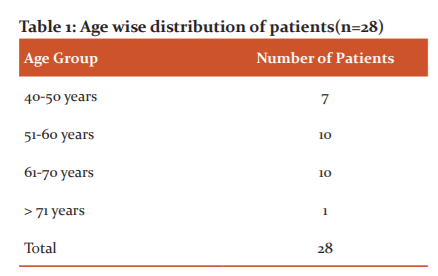
Table no.1 denotes a total of 28 patients who were randomized in terms of their age to remove age bias that can affect the causal relationship of the study population and its result.
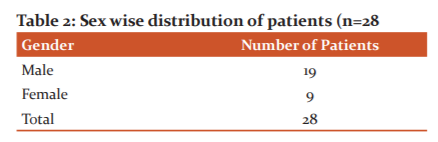
Table no.2 denotes a total of 28 patients who were randomized in terms of their sex to remove sex bias that can affect the causal relationship of the study population and its result. After removing study subjects who were not fit for this study total of 28 patients were enrolled among which 19 were male subjects and 9 were female.
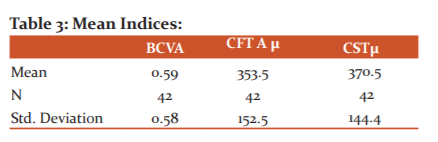
Table no:3 denotes the mean indices calculated from the study and this data were analysed statistically which were found to be significant.
-
Mean BCVA was 0.59± 0.58 ranging from 0.02 to 3.0 on Log MAR. Macular thickness measured as CFT had a mean of 353.5±152.5 µ ranging 202 to 765 microns, whereas CST showed a mean of 370.5±144.4 microns ranging 231 to 770 microns.
-
The BCVA had a moderate correlation with central subfield thickness.
-
Correlation of BCVA was better with Central foveal thickness (spearman’s r=0.532;p=0.000) than that of central subfield thickness (spearman’s r=0.586;p=0.000).
DISCUSSION:
OCT is a quick, non-invasive, daycare procedure with little expertise and good reproducible procedure of producing cross-sectional and high-resolution images of the retina.5,6,7,8,9,10Oct was specifically being utilized for years in the practice of ophthalmology for analysing diabetic macular oedema in terms of its morphology and it helps in analysing its severity and other associated retinal abnormalities. It helps in detecting the amount of Subretinal fluid if present and helps in guiding the treatment protocol for the disease.11,12
In the current study, CFT(central foveal thickness) had a mean of 353.5±152.5 µ ranging from 202 to 765 microns. Though there was a correlation there was also substantial variation in visual acuities at any given retina thickness. Some eyes with thickened macula also had good visual acuity and vice versa.
The patients who took part in this study were of diverse settings and were representative of patients with DME seen throughout developing countries like India. The population data of current study subjects are similar to other studies of diabetic macular oedema In developed countries.13-16 However, unlike the ETDRS, In this study people older than 70years of age were not excluded.17
It has been already established by many studies that, Decreased visual acuity and central macular thickness are correlated.18
The study by Kim et al.19 stated that the mean visual acuities and mean retinal thickness also varied among different study groups, groups with worse visual acuities was high retinal thickness as compared to other groups, and Otani et al.20,21 in their study, also reported that the central foveal thickness and the best-corrected visual acuity are intermediate negative correlated regardless of the different tomography features.
More recent studies have evaluated the relationship between visual function and microstructural changes in the fovea IS/OS (Inner segment and outer segment) junction and ELM(external limiting membrane) in DME (Diabetic macular oedema). In their study, Uji et al22,23 concluded that if a hyperreflective focus is present in the outer retina it has been found on SD-Oct that there is disruption of External limiting membrane and junction line of Inner segment /outer segment as well associated decreased best-corrected visual acuity in patients with diabetic macular oedema.
The retina is a compact tissue composed of a neural element and glial cell.24 Because glial cells occupy all the interneuron space, extracellular sniipace is virtually absent. Previous Histopathological studies by Yanoff et al25 indicate that the development of fluid accumulation within Muller's cells is the reason for the initiation of the development of macular oedema. Due to the accumulation of fluid inside muller’s cells it represents as sponge-like cystic swelling on 3D-OCT and due to accumulation of fluid in muller’s cells in long terms mat lead to liquefactive necrosis of muller’s cells as an immune response and adjacent neural cells leads to cystoid cavity formation in the retina.26In the histopathologic study of CME, Tso et al.27 demonstrated that cystoid spaces were located in the outer plexiform, inner plexiform, granular layers and the ganglion cell layer.
The results may be supported by histopathological findings of Yamamoto et al.,6 which suggests worse visual outcomes when compared with other subgroups of Diabetic macular oedema are associated with eyes with CME. Recently, Sun et al.28 have also found that disorganization of the retinal inner layers in the 1-mm foveal area is associated with worse VA.
The current study also investigated the Central foveal thickness and its correlation with Visual acuity in eyes with CME, the height of the cystoid space was not significantly correlated with VA or AMT but the correlation with CFT was significantly positive.
With the help of 3D-OCT, the Diabetic macular edema was studied in detail and quantified including sponge-like cystic swelling of the macula, cystoid macular oedema and central foveal thickness analysed. Central foveal thickness and diffuse retinal thickening were the most common feature and CME had the worst visual outcome.
This study provides the result that OCT may not be a single tool for visual acuity for the primary outcome in diabetic macular oedema studies.
The correlation of visual acuity and central retinal thickness measured by OCT is roughly linear. Other studies results were also similar; however, the strength of correlation varies among different studies.
Assessment of central macular thickness using Oct is certainly helpful clinically as it gives a lot of other information about the patient’s clinical outcomes and benefits.
Conclusion:
In our study, we analysed patients of diabetic macular oedema in terms of OCT parameters such as Central Foveal thickness, Central subfield thickness and correlated with the Best-corrected visual acuity of patients.
As there are many parameters available in OCT to analyse for different forms of retinal pathology. The accurate parameters to be studied are still a challenging task for most ophthalmologists in today’s world. Diabetic macular oedema is also the most common retinal pathology which requires OCT imaging as the most reliable modality for diagnosis, but variable parameters and newer technologies in OCT made it difficult for most of the practitioners to choose a single parameter and its correlation with disease entity, which is almost always essential for deciding a treatment plan.
We concluded that our OCT findings showed a correlation between visual acuity and diabetic macular oedema based on the CFT and CST values.
CFT is more accurate to predict the prognosis of visual outcome in cases of DME suggesting the worst visual outcome in cases with diffuse retinal thickening with increased CFT.
So from my study, I would like to conclude that CFT can be used as a single best parameter for assessing Diabetic macular oedema, In terms of its severity, quantification, progression and treatment plan of action. CFT is a highly reliable indicator for the plan of action to decide the treatment and prognosis of patients with DME.
Acknowledgement:
The Journey of doing research and analysis is never being easy as it requires teamwork. I am very grateful to all authors for their valuable contribution to every part of this study. I would sincerely like to thank Dr Punit Singh the principal author of this article, he is currently is working as a professor in the department of ophthalmology and he has achieved many milestones in life while practising as an Ophthalmologist. He has done fellowship in Glaucoma, cataract surgeries, Cornea and refractive surgeries as well in Medical retina. His knowledge about the Subject has been a valuable part of this study. He along with all other authors guided me in each step of obstacles and difficulties. I would also like to thank Dr Niklank Mehta the second author as a part for this article currently, Working as a resident in the Department of Ophthalmology. He provided immense support and motivation throughout study, He always helped and guided and rectified my errors and mistakes without any hesitancy. His knowledge about the OCT and parameters that he earned from his different sources of studies and hard work brought the idea of Doing this article.
The Other author Dr Samiksha Modi, Working as a resident of the department of Ophthalmology as a constant source of emotional support for all of us when we needed it. Her knowledge and experience about the field of research guided me on the way to finish an article on time, without her contribution and skills it would have been very difficult for me to complete the article.
I would Like to thank Dr Jainam Vora, Dr Devika Malhotra for their support and doing analysis work for this article they have very good skills in Statistical analysis and research. They can be called good mathematicians and good colleagues as well who helped anytime when they were asked for.
I Dr Suchi Dholu the corresponding author of this article, have been working as a resident in the department of ophthalmology, I contributed to this article with the workup of all patients and collecting the data and documentation. I took the consent of all the patients and their relatives to participate in this study.
Financial Disclosures: None
Conflicts of interests: No
References:
-
Brussels, Atlas D. International Diabetes Federation. IDF Diabetes Atlas, 7th and. Brussels, Belgium: International Diabetes Federation, 2015.
-
Guariguata L, Whiting D, The International Diabetes Federation diabetes atlas methodology for estimating global and national prevalence of diabetes in adults. Diabetes research and clinical practice. 2011 Dec 1;94(3):322-32.
-
Lin S, Rocha VM, Taylor R. Artefactual inflation of type 2 diabetes prevalence in WHO STEP surveys. Tropical Medicine & International Health. 2019 Apr;24(4):477-83.
-
Basit A, Fawwad A, Qureshi H, Shera AS. Prevalence of diabetes, pre-diabetes and associated risk factors: second National Diabetes Survey(NDS), 2016–2017. BMJ Open. 2018 Aug 1;8(8):e020961.
-
Hee MR, Puliafito CA, Duker JS, Reichel E, Coker JG, Wilkins JR, et al. Topography of diabetic macular oedema with optical coherence tomography. Ophthalmology 1998; 105:360-370.
-
Hee MR, Puliafito CA, Wong C, Duker JS, Reichel E, Rutledge B, et al. Quantitative assessment of macular oedema with optical coherence tomography. Arch Ophthalmol 1995; 113:1019-1029.
-
Huang D, Swanson EA, Lin CP, Schuman JS, Stinson WG, Chang W, et al. Optical coherence tomography. Science 1991; 254(5035): 1178-1181.
-
Puliafito CA, Hee MR, Lin CP, Imaging of macular diseases with optical coherence tomography. Ophthalmology 1995; 102:217-229.
-
Hee MR, Puliafito CA, Wong C, Optical coherence tomography of central serous chorioretinopathy. Am J Ophthalmol 1995; 120:65-74
-
Hee MR, Puliafito CA, Wong C, Duker JS, Optical coherence tomography of macular holes. Ophthalmology 1995; 102:748-756.
-
Yamamoto S, Yamamoto T, Morphological and functional analyses of diabetic macular oedema by optical coherence tomography and multifocal electroretinograms. Graefes Arch Clin Exp Ophthalmol 2001; 239:96-101
-
Kang SW, Park CY, Ham DI. The correlation between fluorescein angiographic and optical coherence tomographic features in clinically significant diabetic macular oedema. Am J Ophthalmol 2004; 137:313-322
-
Browning DJ, Zhang Z, Benfield JM, The effect of patient characteristics on response to focal laser treatment for diabetic macular oedema. Ophthalmology. 1997;104:466–72.
-
Andaman L, Olk RJ. Laser photocoagulation of diabetic macular oedema. Ophthalmic Surg Lasers. 1997;28:387–408
-
Lee CM, Olk RJ. Modified grid laser photocoagulation for diffuse diabetic macular oedema. Long-term visual results Ophthalmology.2014;23(3):162-165.
-
Bailey CC, Sparrow JM, Grey RHB, he national diabetic retinopathy laser treatment audit. I. Maculopathy. Eye. 1998;12:69–76.
-
Early Treatment Diabetic Retinopathy Study Research Group. Early treatment diabetic retinopathy study design and baseline patient characteristics. ETDRS report number 7. Ophthalmology. 1991;98:741–56.
-
Kim BY, Smith SD, Kaiser PK. Optical coherence tomographic patterns of diabetic macular oedema. Am J Ophthalmol. 2006; 142:405-412
-
Browning DJ, Glassman AR, Aiello LP, Beck RW, Brown DM, Fong DS, et al. Diabetic Retinopathy Clinical Research Network Relationship between optical coherence tomography-measured central retinal thickness and visual acuity in diabetic macular oedema. Ophthalmology. 2007; 114:525-536
-
Otani T, Kishi S, Maruyama Y. Patterns of diabetic macular oedema with optical coherence tomography. Am J Ophthalmol. 1999; 127:688-693
-
Murakami T, Nishijima K, Sakamoto A, Ota M, Horii T, Yoshimura N. Association of path morphology, photoreceptor status, and retinal thickness with visual acuity in diabetic retinopathy. Am J Ophthalmol. 2011; 151:310-317
-
Uji A, Murakami T, Nishijima K, Akagi T, Horii T, Arakawa N, et al. Association between hyperreflective foci in the outer retina, status of photoreceptor layer, and visual acuity in diabetic macular oedema. Am J Ophthalmol 2012; 153:710-717.717.e1
-
Hogan MJ, Alvarado JA,histology of the human eye. Philadelphia: WB Saunders. 1971; 492
-
Yanoff M, Fine BS, Brucker AJ,. Pathology of human cystoid macular oedema. Surv Ophthalmol 1984; 28(Suppl):505-511.
-
Fine BS, Brucker AJ. Macular oedema and cystoid macular oedema. Am J Ophthalmol 1981; 92:466-481
-
Tso MOM. Pathology of cystoid macular oedema. Ophthalmology. 1982; 89:902-915
-
Sun JK, Lin MM, Lammer J, Disorganization of the retinal inner layers as a predictor of visual acuity in eyes with centre-involved diabetic macular oedema. JAMA Ophthalmol. 2014; 132:1309-1316.
-
Murakami T, Yoshimura N., Structural changes in individual retinal layers in diabetic macular oedema. J Diabetes Res. 2013; 2013:920713.
|
 IJCRR
IJCRR 


 This work is licensed under a Creative Commons Attribution-NonCommercial 4.0 International License


