IJCRR - 13(18), September, 2021
Pages: 144-150
Date of Publication: 26-Nov-2021
Print Article
Download XML Download PDF
Nutritional Status Based on Anthropometry of Tribal Children aged 3-11 Years of Paschimanchal Area in West Bengal, India
Author: Ujjwal Mollah, Samiran Bisai, Dilip Kumar Nandi
Category: Healthcare
Abstract:Introduction: Nutritional status of tribal population of India is not agreeable. Therefore, present study was embraced to survey
the nutritional status among tribal children aged 3-11years of Paschimanchal area in West Bengal, India.
Methods: Present cross-sectional study was undertaken in two tribal concentrated blocks of Bankura and Purulia district during
May, 2018 \? October, 2019. An aggregate of 637 (301 girls and 336 boys) children aged 3-11 years were contemplated. Weight,
height, MUAC measurements were measured and recorded by standard techniques. Body mass index (BMI) was computed by standard equation. Children were considered as underweight, thin, and stunting of their weight-for-age, BMI-for-age, and height-
for-age Z-scores
Keywords: Under nutrition, Thinness, Tribe, children, Paschimanchal, West Bengal
Full Text:
Introduction:
Undernutrition is a stern public health problem in developing country including India. An earlier report assessed that around 165 million children worldwide were stunted, 101 million underweight, and 52 million children were wasted and assessed that approximately 70.0% of the world's undernourished children live in Asia, giving that the region with highest concentration of childhood undernutrition worldwide. 1 In the same way, a large-scale survey in India reported that 58.8% and 42.3% of preschool children were found to be stunted and underweight2. Particularly in agricultural nations like India; women, newborns, and children are more affected with malnutrition3,4,5, in light of their high nutritional requirements for physical growth and development. This may be a reason for half of all child deaths before they reach age of 5 year due to malnutrition or malnutrition persuades infections.6
India is home to around 705 tribal groups and subgroups including 75 particularly vulnerable tribal groups (PVTGs). They comprise approximately 8.6% of the total population in India.7 About 5.8% of the total population of West Bengal is indigenous and the greater part of them live in the forests region of the ‘Chhotanagpur’ plateau which we have known as 'Jungle Mahal'.8 The Paschimanchal region comprises of a huge piece of Paschim Medinipur, Jhargram, Bankura, Purulia, and a small part of Paschim Burdwan and Birbhum districts. The major tribal communities of the Paschimanchal area are Santal, Oraon, Munda, Bhunij, Kora, Lodha, Mahali, Savar and Birhar, etc. Among them, Lodha and Birhor are notified as Particularly Vulnerable Tribal Groups(PVTG). Besides this enormous number of tribal people reside in rural areas; a large portion of them were illiterate and very low-wage unskilled laborers. The tribal populations of this region are perceived as socially and financiallyinsecure.5, 9, 10Their ways of life and food propensities are not the same as those of their neighbors.11Living strategies is unique and fully dependent on settled cultivation, forest product collection, hunting, fishing, along with a small sector of Government service and business. When all is said in done, tribal populations are viewed as oppressed in India.4,12
For the most part, the tribal people are found in rural and inaccessible areas of the country and various minimum facilities are not accessed by them due to remoteness. Prior studies detailed very high rates of child malnutrition in this region.5,.10,13Therefore, the current investigation was attempted to assessed sex variations of anthropometry and nutritional status in the form of underweight, thinness, and stunting among tribal children aged 3-11years of the Paschimanchal area of West Bengal, India.
Methodology:
Study area and people:
This cross-sectional investigation was led from May 2018 to October 2019in Ranibandh block of Bankura and Bandwan block of Purulia district, West Bengal. Ranibandh block situated at 22?52'N and 86?47'E and is 83 meters above the sea level and Bandwan block located at 22?53'N and 86?30E and is 283 meters above the sea level. Ranibandh block is situated approximately 60 km south from the Bankura district headquarter and 216 km from Kolkata and Bandwan block is 61 km south-east from the Purulia district headquarter and 257 km from Kolkata, the provincial capital of West Bengal. As per the census of India 2011, the Ranibandh block had a total population of 119,089, among them 47.0% were Scheduled Tribes and Bandwan block had a total population of 94,929, among them 51.9% were Scheduled, Tribes. These two blocks are "Heartland” of ST populations of Jungle Mahal. There are two PHC in each block and the mobile health checkup facility is also available in Bandwan block. The vast majority of the adult population in the studied household is engaged in unskilled manual labor; like cultivation, wood-cutting and leaf collection, etc. So, they belong to lower socio-economic classes. The present study covered for data collection from Santal, Oraon, Bhumji, Kora, Mahali, and Savar community. Data on age, sex, family member, height, weight and mid upper arm circumference (MUAC) was measured and recorded on a pre-test questionnaire by one-to-one interview through house to house visit. Children's age was recorded from their birth certificates. Parents were informed about the objectives of the study and their written consent was obtained. The institutional ethics committee was approved the study protocol before initiation of the study.
Sample Size:
Overall 637 children, 336 boys and 301girls aged 3-11 years, were measured to evaluate the prevalence of underweight, thinness and stunting. The minimum estimated sample size was 423 calculated using a standard formula (n=z2pq/d2) found elsewhere. The calculation [(2.172×34×66) / (52)] was based on 34% prevalence (p) of stunting in rural area of West Bengal with desired precision (d) of ±5%. Where q=p-1 and value of Z is 2.17 at 97% confidence interval.
Anthropometric measurements and evaluation of nutritional status:
Anthropometric measurements, i.e. height and weight of each subject, were taken according to the standard procedures 14. Weight and height were measured using a weighing scale and anthropometric rod to the nearest 0.1 kg and 0.1 cm, respectively. An average value of three times measurements of weight, height and MUAC was considered for present analysis. Body mass index was computed following standard formula as weight in kg divided by square of height in meter. Nutritional status has been determined based on the Z-score analysis. WHO Anthro-plus software was used for monitoring growth and nutritional status of children and adolescents. Children were considered with underweight, thinness (wasting), and stunting of their weight-for-age, BMI-for-age and height-for-age Z-scores below -2 SD of the latest WHO reference standards. While severe and moderate nutritional status was categorized as Z-score below -3 and z-score between -3 to below -2, respectively. We followed the WHO criteria for assessing the severity of malnutrition by percentage prevalence ranges of these three indicators among children.15
Statistical analyses
An understudy student t-test was employed to evaluate the sex differences in height, weight and MUAC. Both One-way & two-way ANOVA was utilized to test age-sex variations of height, weight and MUAC, respectively. The proportion/chi-square test was performed to test for differences in the prevalence of underweight, thinness, and stunting between sexes. Odds ratio (OR) and 95% confidence interval (CI) were also calculated following standard methods. All statistical analyses were performed by utilizing MedCalc statistical software version 19.6. A p-value under 0.05 is viewed as statistically significant.
Result:
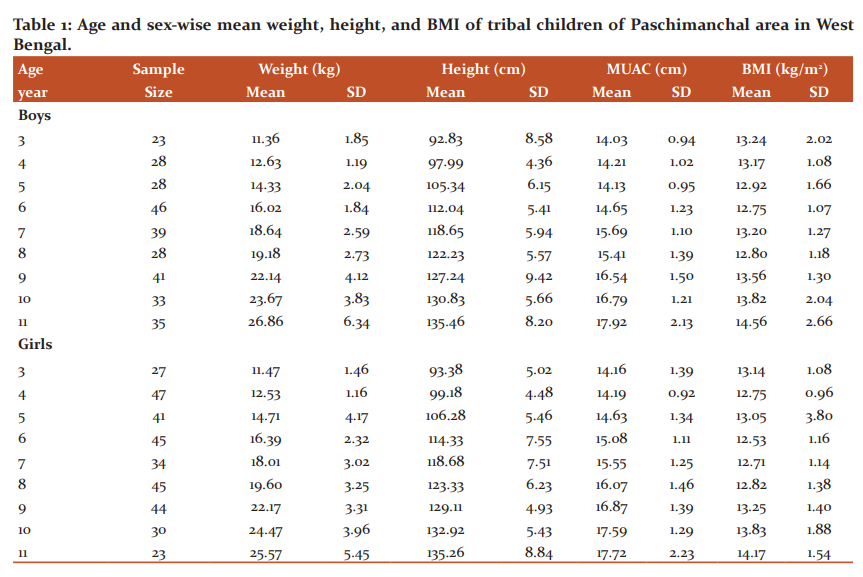
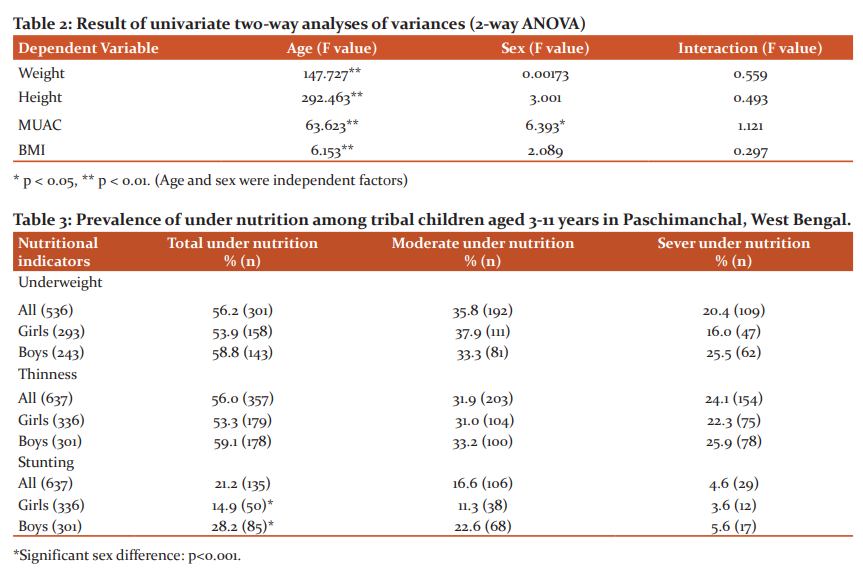
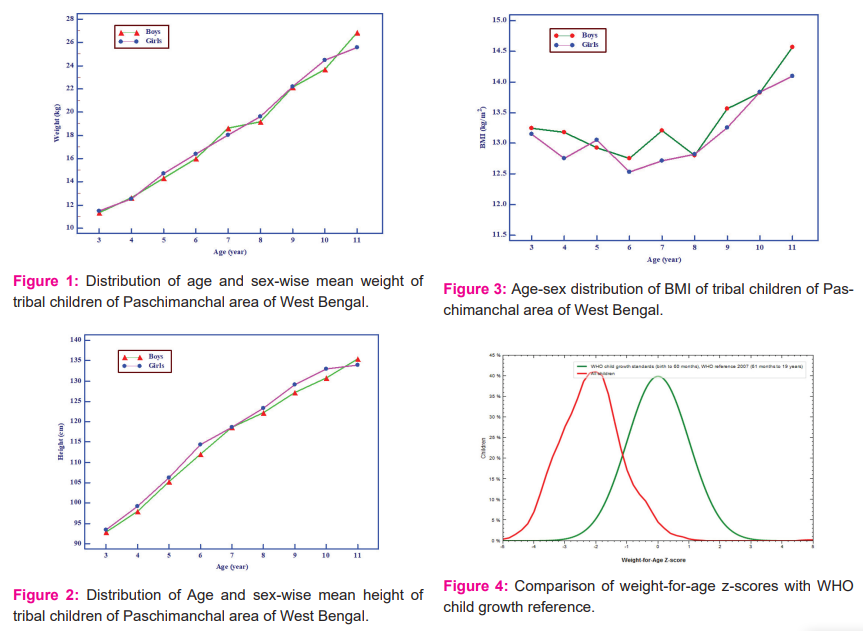
The age and sex-specific means of weight, height, MUAC and BMI was analyzed and introduced in table 1. After-effects of one-way analysis of variance show that average weight, height, MUAC and BMI were increased significantly with move on age in both sexes. Table 2 present results of two-way analysis of variance test to determine the effect of age, sex and age-sex interaction on weight (figure 1), height (figure 2), and BMI (figure 3). All anthropometric indicators of nutritional status showed significant effect of age. On the other hand, sex and age-sex interaction had no significant effect on all anthropometric indicators except MUAC (Table 2).
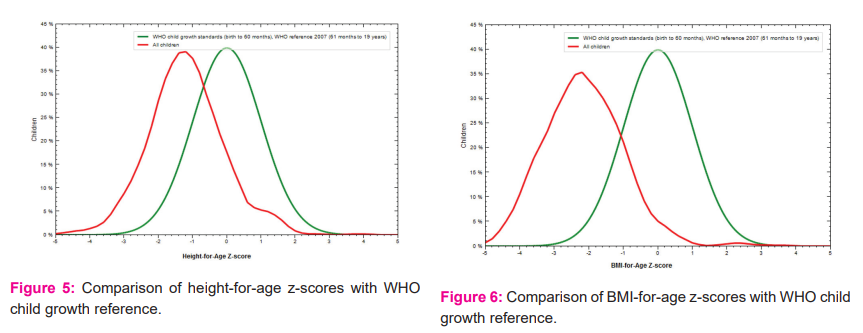
To assess the nutritional status age and sex-specific z-scores were computed by using Anthro Plus software. Age-sex combined z-scores of weight-for-age, height-for-age and BMI-for-age were presented in figure 4-6.
The prevalence of underweight (low weight-for-age), thinness (low BMI-for-age), and stunting (low height-for-age) of the studied children are presented in Table 3. Age and sex combined prevalence of underweight, thinness, and stunting was 56.2%, 56.0%, and 21.2%, respectively. Among them, the prevalence of severe underweight, thinness, and stunting was 20.4%, 24.1%, and 4.6%. The rates of stunting was significantly higher among boys (28.29%) compared with girls (14.9%). The boys had 2.25 (OR=2.25, 95% CI: 1.52-3.32) times greater risk to be developing stunted or shortness.
Discussion:
Lack of healthy sustenance is a significant health problem for coordinated advancement in India and thus many developing nations. The occurrence of a very high range of malnutrition in rural areas in India is a major public health challenge3. Undernutrition keeps on being a reason for ill health and premature mortality among children in agricultural nations including India 16. Poverty and contrasts in financial conditions are viewed as the major hidden reasons for such far and widespread malnutrition in India 12,16,17. It is by and large acknowledged that high prevalence of undernutrition in developing countries is attributed to poor socio-economic conditions, ethnicity, demographic disparities, nutrient deficiencies, and environmental issues in populations.5,9,18 In India, a range of studies were conducted to assess the nutritional of tribal children based on anthropometry. Since, anthropometry is considered a minimal expense and non - invasive tools.
In this study, overall prevalence of underweight, thinness, and stunting was 56.2%, 56.0%, and 21.2%, respectively. According to NFHS-4, the rate of underweight and stunting of rural children in India was 38.3% and 41.2%19 and West Bengal was 33.6% and 34.0% 20. Present study found the prevalence of underweight, thinness, and stunting of girls were 53.9%, 53.3%, and 14.9% and for boys it was 58.8%, 59.1%, and 28.2%. The rates of stunting were significantly higher among boys than girls, which reject male child preponderance of food allocation and or better care. A previous review reported there is presence of sex difference of childhood malnutrition.21
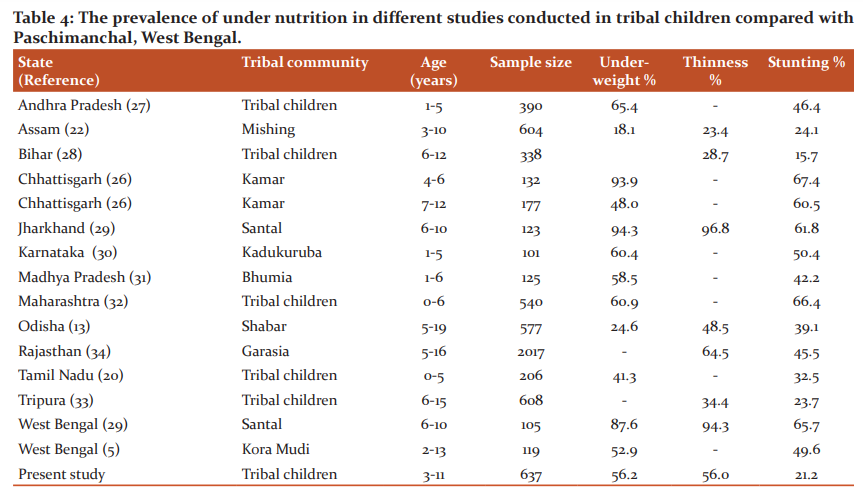
Studies from the 21st century in India, documented overall prevalence of underweight of tribal children ranges from 18.5% to 94.3% as tabulated in Table 4. The prevalence of underweight in the present study is much greater than the national and state average (NFHS-4) and also higher than Mishing 18 tribal children in Assam, Shabar 9 tribal children in Odisha, tribal children in Tamil Nadu 16, Kamar tribal children in Chattrishgarh22. Conversely, the prevalence of underweight of this study is lower than tribal children of Andhra Pradesh 23, Bihar 24, Santal children of Jharkhand and West Bengal 25, Kadukuruba26 of Karnataka, Bhumia of Madhya Pradesh27 and tribal children of Maharashtra.28
It is noteworthy to mentioned that the rate of stunting in the present study is lower than all the studies documented in table 4, except tribal children of Bihar 24, indicating that the rate of height growth of their age of tribal children of this area is comparatively better than tribal children as revealed others parts of India (table 4).
Moreover, the prevalence of thinness of tribal children in India fluctuated somewhere in the range of 23.4% and 96.7% (Table 4), this study found by and large pace of thinness was 56.0%. The rate is higher than Mishing tribal children of Assam18, tribal children in Bihar 24, children in Tripura 29 and Shabar of Odisha.9 In contrast, the prevalence of thinness was lower in studied children than the Santal children of Jharkhand and West Bengal 25 and Garasia children of Rajasthan.30
Also, undernutrition assumes a significant part in child mortality and morbidity in agricultural nations including India. An undernourished child is more risk of getting infection consequently impede their normal development and advancement. Numerous investigations from India reported nutritional status of the children affected by socioeconomic condition and food habits. In this way, improvement of their financial status is prime goal at national and sub-national level.
Conclusion:
Present investigation tracked down a high prevalence of underweight and thinness among the tribal children around here. Thus, further investigation in larger augmentation is required to validate the present findings.
Acknowledgement: Authors are grateful to the authority of Raja Narendra Lal Khan Women’s College (Autonomous), Vidyasagar University and Sidho-Kanho-Birsha University, Purulia for providing logistics support.
Source of funding: Partially borne by investigator.
Conflict of interest: None
Author contributions: UM collects the data. SB developed the study design and analysis of data. UM and SB contributed to writing of the manuscript; DKN critically revised the manuscript.
Ethical Clearance Letter No.: IEC/ICMR/02/IEC-ICMR/RNLKWC/2019
References:
-
United Nations Children’s Fund, World Health Organization & World Bank. 2012. UNICEF–WHO–The World Bank: Joint Child Malnutrition Estimates. New York/Geneva/Washington, DC. UNICEF, WHO and World Bank: 9-10, 2012.
-
The HUNGAMA Survey Report. 2011. Fighting Hunger & Malnutrition. Available from http://www. hungamaforchange.org/HungamaBKDec11LR.pdf [Assessed October 12, 2012.
-
Debnath S, Mondal N, Sen J. Prevalence of thinness among rural children of West Bengal, India. Human Biol Rev. 2018;7(4): 362-85.
-
Sinha R, Sharma B. Impact of Nutritional Intervention on the Selected Tribes in Jharkhand. Indian Res J Ext Edu.2013;13(1): 123-25.
-
Bisai S, Mallick C. Prevalence of undernutrition among Kora-Mudi children aged 2-13 years in Paschim Medinipur District, West Bengal, India. World J Pediatr2011. 7(1): 31-36.
-
World Health Organization. 2006. The WHO Child Growth Standard. Geneva: WHO 2006.
-
Primary census abstract data highlights, census of India -2011, web site of the registrar general, India, 2011.
-
West Bengal, data highlights:-“The scheduled Tribes census of India-2001”. Office of the registrar general, India, 1-4.
-
Chakrabarty S, Bharati P. Nutritional status among the Shabar tribal children living in urban, rural and forest habitats of Orissa, India. Italian J Public health.2010;7(3):303-10.
-
Mahapatra B, Dey J, Pal S Bose K. Prevalence of undernutrition among Santal Preschool Children of Two Districts of West Bengal, India. Human Biol Rev.2019;8(2): 179-96.
-
Divakar SV, Balaji PA, Poornima S, Varne SR, Ali SS, Puttaswamy M. A comparative assessment of nutritional and health status between tribal and nontribal under five children of Mysore, India. Mullar J Med Sci Res.2013;4(2): 82-85.
-
Bhandari S, Ghosh M, Bose K. Socio-Demographic Characteristics and Prevalence of Under Nutrition among Adult Sabars of Bankura District, West Bengal, India. Int J Adv Life Sci Res. 2019; 1: 01-10.
-
Mukhopadhyay DK, Biswas AB. Food security and anthropometric failure among tribal children in Bankura, West Bengal. Indian Pediatr.2011;48(4): 311-14.
-
Lohman TG, Roche AF, Martorell R. Anthropometric Standardization Reference Manual. Chicago: Human Kinetics Books, 1988.
-
World Health Organization. Physical Status: The Use and Interpretation of Anthropometry. Technical Report Series no. 854. WHO: Geneva1995.
-
Senthilkumar SK, Chacko TV, Suvetha K. Nutritional status assessment of children aged 0-5 years and its determinants in a tribal community of Coimbatore district. Int J Community Med Public Health.2018;5(28): 35-45.
-
Gopalan C. The changing nutrition scenario. Indian J Med Res.2013;138:392-97.
-
Basu D, Islam G, Gogoi R, Dey S, Deori J. Child's growth and nutritional status in two communities-Mishing tribes and Kaibarta caste of Assam, India. Int J Sociol Anthropol.2014;6(2): 59-69.
-
International Institute for Population Sciences (IIPS) and ICF. National Family Health Survey (NFHS-4), 2015-16: India. Mumbai: IIPS, 2017.
-
International Institute for Population Sciences (IIPS) and ICF. National Family Health Survey (NFHS-4), India, 2015-16: West Bengal. Mumbai: IIPS, 2017.
-
Marcoux A. Sex differentials in undernutrition: a look at survey evidence. Popul Dev Rev.2002; 28:275-84.
-
Mitra M, Kumar PV, Chakraborty S, Bharati P. Nutritional status of Kamar tribal children in Chhattisgarh. Indian J Pediatr. 2007; 74:381-384.
-
Laxmaiah A, Rao MK, Kumar RH, Arlappa N, Venkaiah K, Brahmam GNV et al. Diet and nutritional status of tribal population in ITDA project areas of Khammam district, Andhra Pradesh. J Hum Ecol. 2007; 21:79-86.
-
Kumar H, Kumar D, Kumar B, Sinha RK, Singh R. Nutritional assessment of rural children (6–12 years) of north Bihar: A cross-sectional study. Indian J Child Health. 2019;6(1):25-29.
-
Chakraborty U, Chowdhury SD, Dutta G, Ghosh T. A Comparative Study of Physical Growth and Nutritional Status in Santal Children of Ghatsila and Bolpur. Kamla-Raj Enterprises, Tribes & Tribals. 2008; 2: 79-86.
-
Manjunath R, K JK, Kulkarni P, Begum K, Gangadhar MR. Malnutrition among under-five children of kadukuruba tribe: need to reach the unreached. J Clin Diagn Res. 2014; 8(7):1-4.
-
Jaiswal A. Health and Nutritional Status of a Primitive Tribe of Madhya Pradesh: Bhumia. Global JHuman Soc Sci Hist Archaeol &Anthropol. 2013;13(1): 15-19.
-
Talapalliwar MR, Garg BS. Nutritional status and its Correlates among Tribal Children of Melghat, Central India. Indian J Pediatr. 2014; 81(11):1151–57.
-
Sil SK, Sarkar SR, Saha S, Roy S. Assessment of nutritional status of rural tribal children in Tripura. Indian J pediatr.2011;48(6):488-89.
-
Mandot S, Mandot D, Sonesh JK. Nutritional Status of Tribal (Garasia) School Children of Sirohi District, Rajasthan. Indian Pediatr. 2009; 46 (5): 437-38.
|
 IJCRR
IJCRR 


 This work is licensed under a Creative Commons Attribution-NonCommercial 4.0 International License


