IJCRR - 13(18), September, 2021
Pages: 87-93
Date of Publication: 26-Sep-2021
Print Article
Download XML Download PDF
To Assess The Ability of CBCT in Evaluating Osteoporotic Bone Changes in Type 2 Diabetes Mellitus Patients in Comparison to Bone Mineral Density using DEXA
Author: Deepti Awasthi, Upasana Sethi, Nidhi Puri, Akshay Rathore, Manu Dhillon, Seema Ahuja
Category: Healthcare
Abstract:Purpose: This study assessed the ability of CBCT in evaluating osteoporotic bone changes in comparison to bone mineral den�sity by using a DEXA scan in type 2 diabetes mellitus patients. Methodology: Thirty diabetic patients (15 males and 15 females) and thirty healthy control subjects (15 males and 15 females) were included in this study. The CBCT images were obtained from the left mental foramen region using New Tom GIANO (CEFLA)-SC Dental CBCT system. The axial, sagittal and coronal sections had been prepared. The t-value was taken as a gold standard to determined BMD (bone mineral density) of the lumbar vertebrae by dual-energy X-ray absorptiometry (DEXA) using a DEXA scanner LUNAR DPX NT (GE, USA). The intra-observer agreement and relationship between the CBCT measurements and BMDs relationship had assessed. Results: The result of the study showed a statistically significant difference in the mean values of CTIS, CTII, CTMI indices measured on CBCT in the diabetic group and control group. Mean 't- scores' in both diabetic males and females are lesser as compared to the mean 't- score' in the control group. A positive correlation has been observed between t-score and CTIS, CTII and CTMI indices. The intra-observer variability between CTIS, CTII, CTMI and CTCI reveal strong agreement among various radio morphometric indices. Conclusion: The various radio morphometric indices such as computed tomography mandibular index superior (CTI(S)), comput tomography mandibular index inferior (CTI(I)), and computed tomography cortical index (CTCI) and computed tomogra�phy mental index(CTMI) on CBCT can be used as an ancillary tool for the early detection of osteoporotic bone changes in type 2 diabetic patients.
Keywords: CBCT, BMD, DEXA scan, osteoporosis, radio-morphometric indices, type 2 diabetes mellitus.
Full Text:
Introduction
Diabetes mellitus (DM) is an ametabolic disorder1characterized by persistent hyperglycemia. It may be due to resistance to peripheral actions of insulin, impaired insulin secretion, or both. An important complication of type 2 diabetes is osteoporosis, which is characterized by low bone mass2 and deterioration of bone micro-architecture3. According to World Health Organization (WHO), osteoporosis is defined as a bone mineral density t-score value of − 2.5 or lower4 at any one location or having a previous fracture. Due to changes in lifestyle and sedentary habits, even males are found to be prone to osteoporotic changes. Dual-energy x-ray absorptiometry (DEXA scan) is the best non-invasive5technique for bone mineral density measurement. But in few cases for instance impaction, implant placement and curved canals 3D imaging such as CBCT is used for better treatment planning as it provides 3-dimensional representation6 of the maxillofacial skeleton. Therefore, this study was conducted with the purpose to assess the ability of CBCT to evaluate osteoporotic bone changes in type 2 diabetes mellitus patients in comparison to bone mineral density using a DEXA scan.
Methodology
The prospective study (ITSCDSR/IIEC/2017-20/OMR/01) was performed at the Centre for Advanced Imaging in the Department of Oral Medicine and Radiology, I.T. S Centre for Dental Studies and Research, Ghaziabad, Uttar Pradesh, India from June 2018 to July 2019. The study group involved 30 diabetic patients (15 males and 15 females) within the age range between 50 to 80 years with a known history of type II diabetes, of more than 10 years of duration who had undergone CBCT imaging for various reasons.
The control group included 30 healthy subjects (15males and 15 females) aged 50 to 80 years with no history of the systemic disease who underwent CBCT scans for different reasons.
Patients with other systemic disorders such as hyperparathyroidism, hyperparathyroidism, osteomalacia, thyrotoxicosis, renal disease or any disorder known to cause osteoporosis and with a history of taking any long-term medications for any other systemic problem were excluded. Consent was taken from the participants who had joined this study. The study was approved by the institutional ethical board.
All those patients who were suffering from diabetes underwent blood sampling by venipuncture of the antecubital vein to establish fasting and postprandial glucose values in a fully automated clinical chemistry analyzer.
Patients and healthy subjects were subjected to DEXA scan [DEXA Scanner LUNAR DPX (GE,
USA)] of lumbar vertebrae (L1-L4) for the measurement of bone mineral density. Based on the
lumbar spine bone mineral density measurement t- score value (‹-2.5) was classified as osteoporotic and a t- score value (›-1.0) was classified as normal7.
CBCT images of the left mandible were obtained using CBCT Unit-New Tom GiANO (CEFLA)-SC, CEFLADENTAL GROUP, ITALY with a voxel size of 150 microns, tube voltage -85-90kvp, tube current-10 mA, exposure time- 9 seconds and field of view-5x5cm.
Axial, sagittal and coronal images were reconstructed on the multiplanar reformation screen (MPR) using NNT software (New Net technologies Ltd. Naples) version by scrolling through sequential axial slices the mental foramen was identified and the slice with the widest mesiodistal dimension of the mental foramen was utilized. Two experienced maxillofacial radiologists recorded the measurements and readings were repeated after 2 weeks.
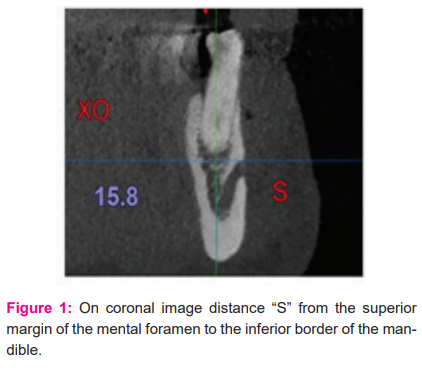
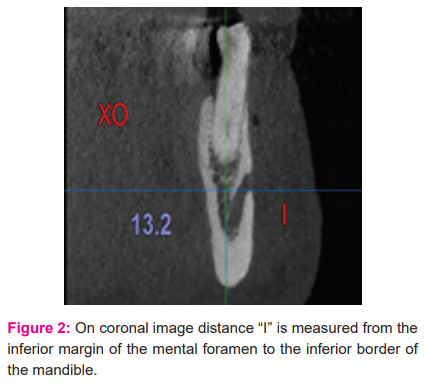
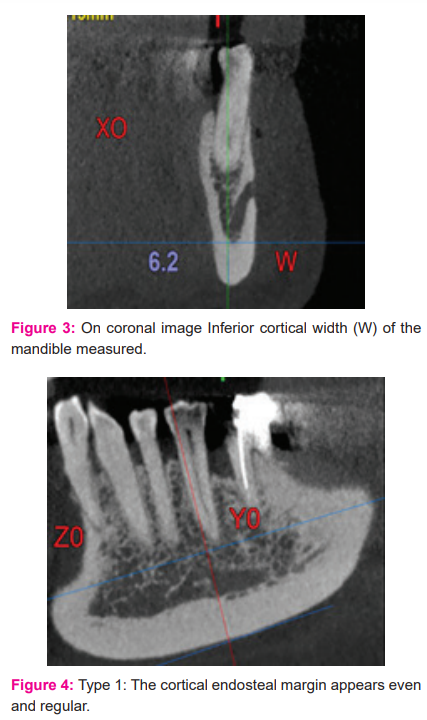
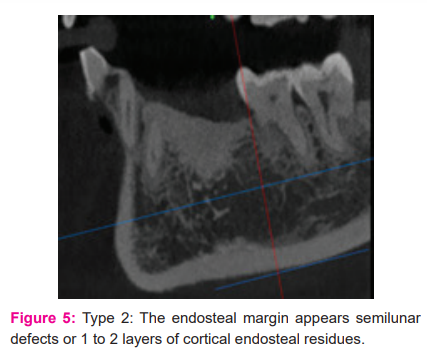
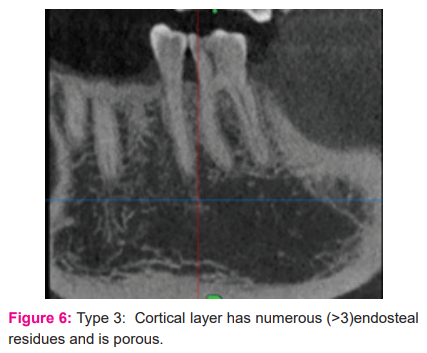
As per recommendation by Koh and Kim20118, the radio-morphometric indices, were recorded on the angled coronal sections, the computed tomography mandibular index superior (CTI(S)), computed tomography mandibular index inferior (CTI(I)), computed tomography mental index (CTMI) (Fig1, 2and 3) and computed tomography cortical index (CTCI) (Fig4, 5 and6). On angled sagittal sections the CTCI score was measured using a modification of the Klemetti et al.,19949 scoring system.
Statistical analysis
All the data were analyzed on the statistical software SPSS 16.0 (SPSS Inc, Chicago, IL, USA) for Windows. The descriptive statistics like mean, median, SD and frequency distribution of data was calculated. P-value <0.05 considered as significant. The correlation coefficient between CTI(S), CTI(I), CTMI and CTCI and t-score was calculated by using Spearman’s rho correlation coefficient. Intra-observer agreement between various radio-morphometric indices based on Cronbach Alpha was determined.
Results
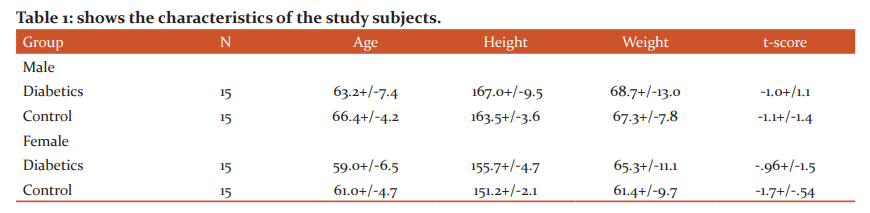
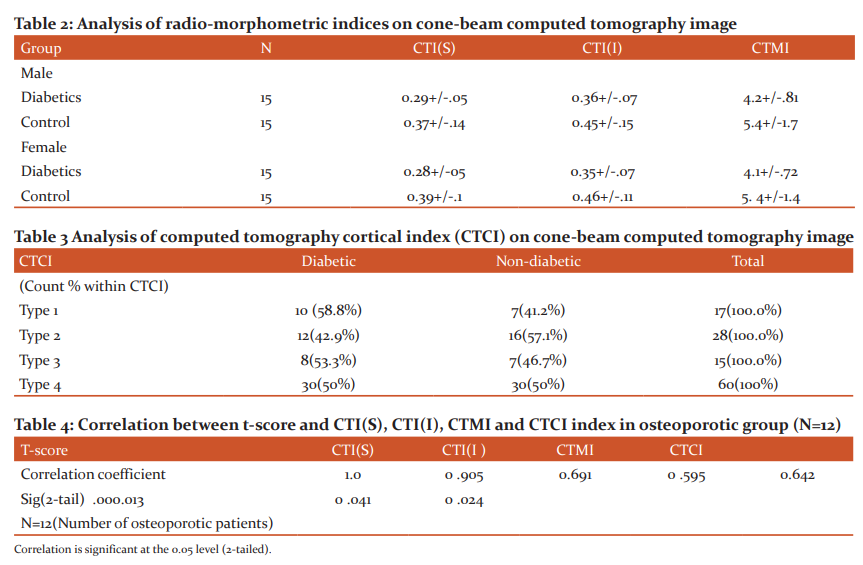
The study sample comprised of thirty diabetic patients (15 males and 15 females) with a known history of type II diabetes, of more than 10 years of duration and thirty healthy control subjects (15 males and 15 females). The mean age of the diabetic population was 63.2+/-7.4 years in the male group and 59.0+/-6.5years in the female group. The mean height and weight were 167.0+/-9.5cm and 68.7+/-13.0kg in the male group and155.7+/-4.7 cm and 65.3+/-11.1 kg in the female group. -1.0+/-1.1 and -.96+/-1.5 was mean lumbar t-scores in the male and female diabetic group respectively(Table 1).The mean values of CTI(S), CTI(I) and CTMI in T2DM males and females were .29+/-.05, .36+/-.07, 4.2+/-.81 and .28+/-.05, .35+/-.07, 4.1+/-.72. The mean values of all the indices were greater in the males as compared to the females and the difference was statistically significant (P-value <0.05) except CTI(S)(Table 2). 8 (53.3%) patients with diabetes had TYPE 3 CTCI, 12 (42.9%) patients had TYPE 2 CTCI and TYPE I CTCI was observed in 10(58.8%) patients. The difference between the diabetic and non-diabetic groups was an insignificant p-value (.558) (Table 3).
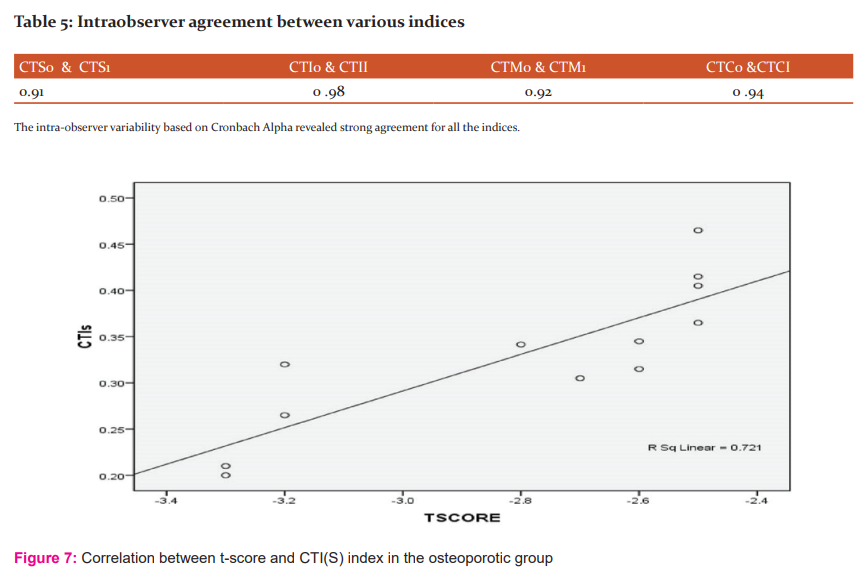
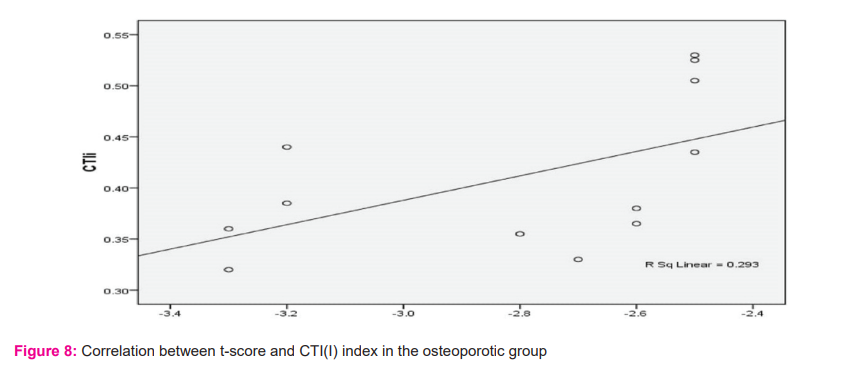
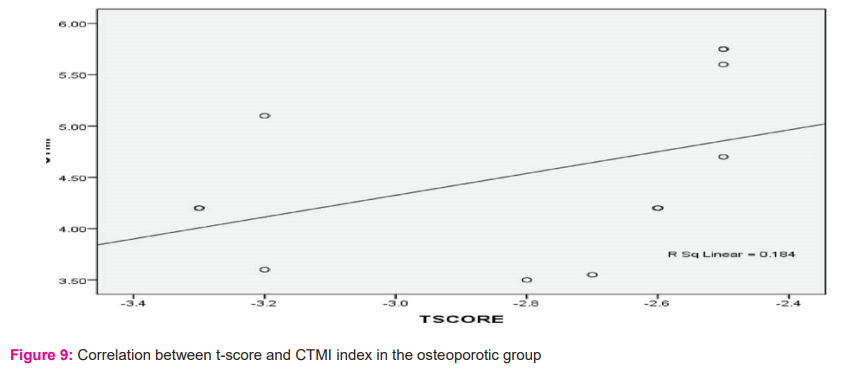
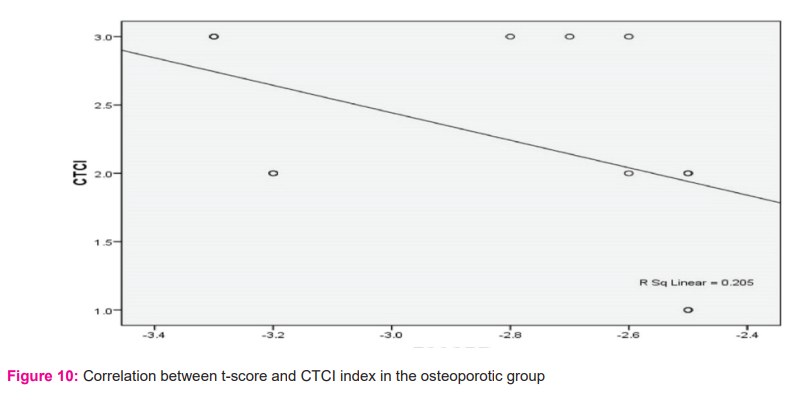
Positive correlation between t-score and CTI(S), CTI(I) and CTMI indices (+0.905, +0.691, +0.595 respectively) with p-value of 0.00, .013, .041 which was statistically significant for all the indices (Table 4 & fig 7, 8 & 9). A negative correlation coefficient between t-score and CTCI (R= -0.642) was statistically significant with a p-value of .024(Table 4 & fig 10). Intraobserver agreement revealed strong agreement between various indices (Table 5).
Discussion
The study examined the feasibility of CBCT in radio-morphometric analysis to detect osteoporotic changes in type2 diabetes mellitus patients and compare them with the healthy control group and correlate the findings with bone mineral density measured by DEXA scan. Osteoporotic changes in males and females were also assessed as males are often neglected for evaluation of osteoporosis. In the current study, DEXA is considered as a gold standard 10 for the BMD measurements in the lumbar region for diagnosis of osteoporosis and prediction of fracture risk. BMD is reported as a t-score value, defined as the difference in the number of standard deviations (SDs) from the mean BMD of a normally distributed, healthy adult reference population, it is expressed as a negative number.11
Apart from DEXA, conventional radiology such as panoramic radiographs has utilized various quantitative and qualitative indices to evaluate the osteoporosis cases and can be used as an indicator of osteoporosis. Taguchi A. et. al., 1996 12study revealed that panoramic radiography can be reliable in screening for osteoporosis. Further, Pallagatti S. et al., 201713 concluded that panoramic radiographs can be used as a screening tool for the evaluation as well as early detection of osteoporosis.
Bosky Gauret al., 201314 study shows that panoramic radiograph plays a vital role in screening patients with osteoporosis, among post-menopausal women whereas a study by Vijay et al., 201515 concluded that radio-morphometric indices on panoramic radiographs can be used as an alternative method in the diagnosis of osteoporosis. Image distortion, magnification, overlapping of the osseous structures are the few drawbacks of panoramic radiographs for the diagnosis of osteoporosis.
In the present study, the mean values of CTI(S), CTI(I) and CTMI indices on CBCT images were lower in the diabetic group than in the control group and the difference was found to be statistically significant where asKayipmazet al.,201616study showed no significant difference between the mean values of CTI(S), CTI(I) and CTMI indices between the diabetic and non-diabetic group. The mean values of all the indices were greater in the diabetic males as compared to the diabetic females and the difference was statistically significant for CTI(I), CTMI except for CTI(S).
Our study is in correlation with the study conducted byKayipmazet al., 201616on CTCI that no significant difference was established between the diabetic groups and control groups. The bone quality and quantity assessment revealed that females are more prone to osteoporotic changes and have poor bone quality.
Based on the T-score osteoporosis was observed more in type 2 diabetic females as compared to males. Our results are in correlation with the study conducted by Sharma B et al., 201717study revealed that a large proportion of females had osteoporosis and osteopenia at both spines (p < 0.0001) and hip (p< 0.0001) compared to males.
A positive correlation between t-score and CTI(S), CTI(I) and CTMI indices were found and it was statistically significant for all the indices. The current study agrees with a study conducted by Mostafa et al., 201618 who found a highly significant positive correlation between CTMI and CT(I) with lumbar spine BMD measured by DEXA (t-score) (p < 0.5).
A negative correlation coefficient was present between t-score and CTCI (R= -0.642) in osteoporotic patients which was statistically significant with a p-value of .024. As the t-score reduces, the likelihood of the patients belonging to TYPE III CTCI progressed. Mostafa et al.,201618 study suggested the highly significant negative correlation between CTCI and lumbar spine BMD in the osteoporotic group measured by DEXA. The intra-observer variability between CTI(S), CTI(I), CTMI and CTCI indices revealed strong agreement for all the indices.
Conclusion
Our study concluded that the diabetic population is more prone to osteoporosis as low bone mineral density was observed in the diabetic group in comparison to the non-diabetic group. The various radio-morphometric indices studied on CBCT can be used as an ancillary tool to identify patients at risk of osteoporosis and further refer the patient for densitometry analysis to the medical practitioner. The limitation of the study was a small sample size, thus further studies should be performed with a larger sample to evaluate the ability of CBCT to assess the osteoporotic bone changes in type 2 diabetes mellitus patients.
Conflict of interest: None
Acknowledgement: Nil.
Financial support: Nil
Author’s contribution section:
Dr. Upasana Sethi, Dr.Nidhi Puri & Dr. Deepti Awasthi - designed the study, wrote the protocol, and wrote the first draft of the manuscript.
Dr. Akshay Rathore, Dr. Nidhi Puri & Dr. Deepti Awasthi performed the statistical analysis and managed the analyses of the study.
Dr. Deepti Awasthimanaged the literature searches. All authors read and approved the final manuscript.
References:
1. American Diabetes Association. Diagnosis and classification of diabetes mellitus. Diabetes Care. 2010 Jan;33 Suppl 1(Suppl 1): S62-9.
2. Jackuliak P, Payer J. Osteoporosis, fractures, and diabetes.Int J Endocrinol. 2014 Oct;2014.
3.Sözen T, Özisik L, Basaran NÇ. An overview and management of osteoporosis. Eur J Rheumatol. 2017 Mar;4(1):46.
4. Unnanuntana A, Gladnick BP, Donnelly E, Lane JM. The assessment of fracture risk. J Bone Joint Surg Am. 2010 Mar;92(3):743.
5. Garg MK, Kharb S. Dual-energy X-ray absorptiometry: Pitfalls in measurement and interpretation of bone mineral density. Indian J Endocrinol Metab. 2013 Mar;17(2):203.
6. John GP, Joy TE, Mathew J, Kumar VR. Fundamentals of cone-beam computed tomography for a prosthodontist. J Indian Prosthodont Soc. 2015 Jan;15(1):8.
7. Blake GM, Fogelman I. The role of DXA bone density scans in the diagnosis and treatment of osteoporosis. Postgrad Med J.2007 Aug 1;83(982):509-17.
8. Koh KJ, Kim KA. Utility of the computed tomography indices on cone-beam computed tomography images in the diagnosis of osteoporosis in women.Imaging Sci Dent. 2011 Sep 1;41(3):101-6.
9. Klemetti E, Kolmakov S, Kröger H. Pantomography in the assessment of the osteoporosis risk group.Scand J Dent Res.1994 Feb;102(1):68-72.
10. Humadi A, Alhadithi RH, Alkudiari SI. Validity of the DEXA diagnosis of involutional osteoporosis in patients with femoral neck fractures. Ind J Orthop. 2010 Feb;44(1):73-8.
11.Kling JM, Clarke BL, Sandhu NP. Osteoporosis prevention, screening, and treatment: a review. J Womens Health (Larchmt). 2014 Jul 1;23(7):563-72.
12. Taguchi A, Suei Y, Ohtsuka M, Otani K, Tanimoto K, Ohtaki M. Usefulness of panoramic
radiography in the diagnosis of postmenopausal osteoporosis in women. Width and morphology of
inferior cortex of the mandible. Der Med Res.1996 Nov;25(5):263-7.
13. Pallagatti S, Parnami P, Sheikh S, Gupta D. Suppl-1, M3: Efficacy of Panoramic Radiography in the Detection of Osteoporosis in Post-Menopausal Women When Compared to Dual Energy X-Ray Absorptiometry. Open Den J. 2017;11:350.
14. Gau RB, Chaudhary A, Wanjari PV, Sunil MK, Basavaraj P. Evaluation of panoramic radiographs as a screening tool of osteoporosis in postmenopausal women: a cross-sectional study. Journal of clinical and diagnostic research: J Con Den Res. 2013 Sep;7(9):2051.
15. Vijay G, Chitroda PK, Katti G, Shahbaz S, Baba I. Prediction of osteoporosis using dental radiographs and age in females. J Mid-life Health. 2015 Apr;6(2):70.
16.Kayipmaz S, Akçay S, Sezgin ÖS. Osteoporotic mandibular changes caused by type 2 diabetes mellitus: a comparative study by cone-beam computed tomography imaging. Oral Radiol. 2017 May;33(2):108-16.
17. Sharma B, Singh H, Choudhary P, Saran S, Mathur SK. Osteoporosis in otherwise healthy patients with type 2 diabetes: a prospective gender-based comparative study, Indian J Endocr Metab. 2017 Jul;21(4):535.
18.Mostafa RA, Arnout EA, Abo el-Fotouh MM. Feasibility of cone-beam computed tomography radio-morphometric analysis and fractal dimension in assessment of postmenopausal osteoporosis in correlation with dual X-ray absorptiometry.Den Med Res. 2016 Sep;45(7):20160212.
|
 IJCRR
IJCRR 


 This work is licensed under a Creative Commons Attribution-NonCommercial 4.0 International License


