IJCRR - 2nd Wave of COVID-19: Role of Social Awareness, Health and Technology Sector, June, 2021
Pages: 194-200
Date of Publication: 11-Jun-2021
Print Article
Download XML Download PDF
Estimation of the Basic Reproduction Number (R0) for Covid-19 Epidemic at District Level in Rewa, Madhya Pradesh
Author: Singh S., Sharma A., Mishra A., Patel M., Derashri G., Modi A.
Category: Healthcare
Abstract:Introduction: COVID-19 was announced as a global pandemic by World Health Organization (WHO) owing to its highly contagious and pathogenicity that has been rapidly spreading throughout the world since its first reported outbreak in China in December 2019. Aim: To estimate the basic reproduction number (R0) and forecast the situation to understand the future transmission dynamics of the COVID-19 outbreak in the Rewa district. Materials and Methods: It was a retrospective cohort study. We used two data sources for the study. Firstly, contact history of laboratory-confirmed SARS-CoV-2 infected individuals & Secondly, the publicly available daily case count data were used together by applying an approach named population-level model (PLM) for estimating R0 and project the size of the epidemic over the next 365days as per the SIR model with help of python. Results: The peak of the R0 = 2.3 was attained in September 2020. Then subsequent reduction toward the end of September can be attributed to aggressive testing, more contact tracing, and isolation measures implemented in the Rewa district during that month so currently, in November up to 22nd R0=1.8 reported according to our study. Conclusion: A combination of Public health measures such as social distancing, rigorous contact tracing & testing, and isola�tion of contacts and the vulnerable should be effective to reduce the instantaneous R0 value and could thereby reduce the final outbreak size.
Keywords: COVID-19, R0 (Basic reproduction number), SIR model (Susceptible, infected and recovered), Python
Full Text:
INTRODUCTION- COVID-19 was announced as a global pandemic by World Health Organization (WHO) 1 owing to its highly contagious and pathogenicity that has been rapidly spreading throughout the world since its first reported outbreak in China in December 2019. In India, the first case of COVID-19 was reported on 30 January 2020 while in M.P. on 20 March 2020. On April 27, 2020, the first COVID-19 case was reported in Rewa, Madhya Pradesh. Understanding the epidemiology of COVID-19 at a local level is becoming increasingly important because even after five phases of lock-down after that unlocking in a phased manner, the daily rise of cases is alarming. To manage an epidemic like this, the administrations and health departments across the Rewa district with about 2,365,106 populations (as per census 2011), need forecasting about the said outbreak to tackle epidemic by decisive planning and management of the resource allocation for a COVID-19 case, which will help to improve survival rates.
Estimation of basic reproduction number R0 is calculated by either individual-level modelling (ILM) that is viewed as prospective or through population-level modelling (PLM) viewed as retrospective. In individual-level modelling (ILM) data are collected from the very beginning of an epidemic. All the contacts of patient zero (first infected individual) are traced and tested, and this carries on as the disease keeps transmitting while in population-level modelling (PLM) we use the variation in infected numbers within the population from one day to the next, frequently using adjusted cumulative models.2 individual-level modelling (ILM) and population-level modelling (PLM) do not give the same results, as they depend on the efficiency of contact tracing, the use of test results (and their accuracy) vs. symptoms, etc.
Either ILM or PLM R0 estimation depends upon some important factors like (a) average number of persons exposed by the infected person, (b) probability of infection after getting exposure, (c) total duration of infectiveness including asymptomatic period, (d) percentage of the people susceptible to getting the infection and total population size,(e) rate of removed persons that include recovery and death both. So we have to consider these factors in modelling and a different degree in different models.
R0 can be calculated from theoretical models for which some specific methods are like the survival function; next-generation method; Jacobean matrix eigenvalues; endemic equilibrium; meta-population models; partial differential equation models, hierarchical Bayesian regression and constant term-polynomial methods.3
Different models consider different numbers of factors along with different statistics like Frequentist or Bayesian, so estimates may be slight differences and do not agree.
For many diseases having R0 >1 but they do not always become epidemic and can die out while some disease having R0<1 but they can persist, at the same time for any given point time R0 doesn’t have a single value some time different value because of difference in various susceptible subgroups within the clusters or due to partial isolation.4
The recently reported work5 has compared the whole genome sequence of 28 viral strains from India.5 the analysis has reported a novel non-synonymous mutation in the NSP3 gene of SARS-CoV2 along with other frequent and important mutations reported across the globe. This suggests the possibility of having different strains at different parts of India or even in-state or cities looking into the demographic density, travel history, inflow of migrant labours. It may be the reason for variation of the basic reproductive ratio (R0) values of Rewa city concerning another city of the state and country.5,6
With the availability of sufficient data in the public domain, we can now cast and forecast the possible situations that a city and state or the whole country is going to face. In Rewa along with M.P. & India, there is a lockdown in the early phase of the epidemic on March 25th with the idea to reduce person-to-person contact to make spreading the disease less likely (social distancing) to prevent rapid transmission of the virus among people and also obtain some time to prepare for the measures that needed to be taken to tackle the situation. However, an early lockdown has slowed down the pace of the spread of the virus considerably. It is thus important to find how long the city/state/country should remain alert and careful about the spread of the virus.
AIM
To estimate the basic reproduction number (R0) and forecast the situation to understand the future transmission dynamics of the COVID-19 outbreak in the Rewa district.
MATERIALS AND METHODS
This study aimed to estimate the basic reproduction number (R0) and forecast the situation to understand the future transmission dynamics of the COVID-19 outbreak at a district level. We used a standard SIR epidemiological model and simulate it with help of Python to forecast the size of the epidemic. This may be useful for the health officials and administration to understand and estimate how they allocate available resources for COVID-19.
For the prediction of the progression of the epidemic, we need well-structured data. Although the data published by ICMR and other agencies that are widely available in the public domain are well organized but not sufficient to compute certain parameters accurately. In this situation, we take help from published research papers in other countries and other parts of India.
We conducted a retrospective observational study of the COVID-19 outbreak in the Rewa district of Madhya Pradesh, India. We used two data sources for the study. Firstly, the contact history of laboratory-confirmed SARS-CoV-2 infected individuals & secondly, the publicly available daily case count data were used together by applying a second approach named population-level model (PLM) to estimating R0 and project the size of the epidemic over the next 365 days. Individuals fitting in the criteria of a suspected case of COVID-19 were tested with the real-time reverse transcriptase-polymerase chain reaction (rRT-PCR) as per national guidelines.6 People who tested positive for SARS-CoV-2 were further assessed for their contact history with known COVID-19 cases in their household. There is no conflict of interest. Ethical clearance was obtained from Institutional Ethical Committee and there is no source of funding/ sponsor for this study.
SIR model
In the words of George Box, “All models are wrong but some models are useful” because There is always a trade-off in modelling between the ‘computational cost’ of increasing the model’s complexity, balanced against the diminishing returns on the model’s accuracy in representing reality. A model that is as complicated as reality is useless as a model, regardless of accuracy. Less accurate models will be much more useful.7
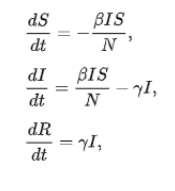
SIR model assumes that those who recover are immune, and therefore as their proportion rises, this puts a limit on the spread of disease as it reduces the proportion of susceptible. As per the definition of recovery rate, it increases in proportion as the rate of infection increases. That is reflected in the SIR model and the proportion of ratio of the transmission rate and the recovery rate is R0. The SIR model is a compartmental model for modelling how a disease spreads through a population. It’s an acronym for Susceptible, Infected, and Recovered. When a disease is introduced to a population, the people move from one compartment to the next. When they reach the R state, they’re no longer able to be infected, depending on interpretation, they either survived the disease and are now immune or succumbed to the illness and are out of the population
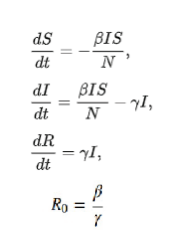
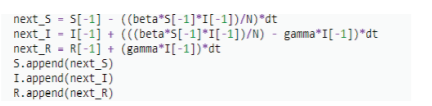
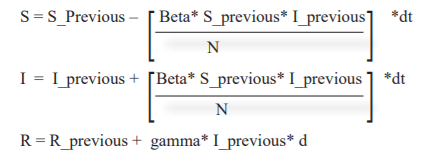
We have three Odes’ in the time domain, with two parameters: β, and γ. β is the average contact rate in the population. γ is the inverse of the mean infectious period (1/t_infectious). It is assumed that there are no birth/migration effects in the model; we have a fixed population from beginning to end. There is one more parameter R0 value that defines how quickly the disease spreads depends upon the relationship of the parameter given in the equation. With these equations, we can build our SIR model for the coronavirus itself to try to better understand how it might spread. To see how coronavirus might spread in the Rewa district of Madhya Pradesh the value of β and γ are key to determine. For how it might spread we used PYTHON for simulation. Simulating this just requires taking our most recent values for S, I, and R, and adding the equation multiplied by our time step.
Base SIR Model in Python:-
Pseudo Code / Equation
Simulation - codes on Python
import matplotlib.pyplot as plt
import numpy as np
def base_seir_model(init_vals, params, t):
S_0, I_0, R_0 = init_vals
S, I, R = [S_0], [I_0], [R_0]
alpha, beta, gamma = params
dt = t[1] - t[0]
for _ in t[1:]:
next_S = S[-1] - ((beta*S[-1]*I[-1])/N)*dt
next_I = I[-1] + (((beta*S[-1]*I[-1])/N) - gamma*I[-1])*dt
next_R = R[-1] + (gamma*I[-1])*dt
S.append(next_S)
I.append(next_I)
R.append(next_R)
return np.stack([S, I, R]).T
# Define parameters
t_max = 365
dt = 0.1
t = np.linspace(0, t_max, int(t_max/dt) + 1)
N = 237626
init_vals = ………., ……., ……..
alpha = …….
beta = …….
gamma = ……..
params = alpha, beta, gamma
# Run simulation
results = base_seir_model(init_vals, params, t)
#FOR EACH ONE OF THEM
S = (results.T[0]/N)
I = (results.T[1]/N)
R = (results.T[2]/N)
plt.figure(figsize = (16,8))
plt.title('for each simulation')
plt.grid()
plt.plot(t,S,label ='S')
plt.plot(t,I,label ='I')
plt.plot(t,R,label ='R', color = 'red')
plt.xlabel('T')
plt.legend()

RESULT AND DISCUSSION
From the reporting of the first case of COVID-19 in the district On April 27, 2020, to November 22, 2020, 3061 cases were reported in the Rewa district with a span of 210 days out of which 2778 recovered and 30 cases deceased (Graph 1). Month wise reported cumulative case status are below (source of data: - www.covid19india.org).
When an infected individual is introduced in an uninfected community then a large number of secondary COVID-19 infections can occur, in that condition to implement sufficient control measures and mitigate the risk of virus transmission it is essential to simulate the process of infection and recovery. When the number of the susceptible population decreased in that condition number of the contact is also reduced so the intensity of the peak is decrease and moves to a later period, although it is wider. The result of the epidemic was affected by the incubation period because a higher value delayed the epidemic, the same effect was observed by increasing the infectious period, while dependence on the initial infected people number is weak if the R0 value doesn’t change during the epidemic (figure1).
Estimated R0
The overall R0 value in starting of lockdown when early cases were reported in April-May in the district named Rewa was 1.567 according to our study which subsequently starts rising once the unlocking process starts in place of strict lockdown and reach 2.39 in September 2020 may be due to bit relaxation in social distancing and movement of population across the country, more travel across state and inflow of migrant labours, in October 2020 R0 value again comes down to 1.5 and currently, in November 2020 R0 value, 1.8 reported. Combination of Public health measures such as social distancing, rigorous contact tracing & testing, and isolation of contacts and the vulnerable persons, the proportion of the population immune through past infection (herd immunity) are effective to reduce the instantaneous R0 value as shown in figure no 1 (‘Flattening the curve’ graph). The range is expected to become narrower if analyzed with more data. Containment measures may change the effective R0.
The peak of the R0 value was reached in September 2020. The subsequent reduction toward the end of September can be attributed to aggressive testing, more contact tracing, and isolation measures implemented in the Rewa district during that month. Our R0 estimate for the first month (1.5) was slightly higher than the national estimate of 1.47 in India during the same period of March to April 2020.8,9 the distribution of R0 values was consistent with observations from other countries, indicating an almost similar transmission pattern.10
District level R0 estimates are more likely to show pronounced fluctuations than state or national estimates, as the latter are aggregated across a wide range of epidemiological settings. Because district-level R0 estimates were not available from India, we compared our findings with those from the cities of Qom and Shahroud in Iran.11, 12 Similar to these cities, the initially high R0 values during the unlocking period can be attributed to the suddenness of the outbreak if the surveillance system is robust and interruption of social distancing. The high values may also be due to a sudden start of case reporting following an initial period of underreporting, leading to an artefactual peak in R0.12
Earlier detection of infection followed by isolation is known to reduce the R0 value by limiting both the duration of effective contact and the number of susceptible people an infected individual can come in contact with.13 Our findings further support that parameters like incubation period and R0 value are likely to vary throughout the epidemic and will depend on local factors influencing transmissions, such as demographics, environmental conditions, modelling methodology, and stringency of control measures.12, 13
Simulating Forecast for COVID-19 epidemic in Rewa district by applying SIR model with help of PYTHON
Simulating this just requires taking our most recent values for S, I, and R, and adding the equation multiplied by our time step. As mentioned, for studying the SIR model, parameters like incubation rate, R0 and recovery rate are required to be calculated. For a given epidemic, R0 is fixed, it denotes the numbers of secondary infections are generated from a seed infection. The value of R0 is calculated when an epidemic is in its growing stage or early stage. The value of R0 is estimated to be 1.5 at starting phase of lockdown & The value of R0 is estimated to be 2.3 during September month (unlocking period), & currently, R0 estimated value is 1.8 in November 2020 which is within the ranges reported in various studies.14-20 While the value of R0 is estimated to be 1.917 by Rudra Banarjee et al.21 Simulation for next 365 days done with the help of python at current R0 value 1.8 as shown in graph 2. While in graph 3, combined simulation since first case (27th April’20) as R0 value changed over time for next 365 days has been depicted.
The incubation period (di) for COVID-19 has been estimated between 2-14 days (WHO). In many studies, it is suggested that the mean incubation period is between 5-8 days. 22- 25
Also, the average incubation period is estimated to be 5.2 in a Wuhan based study as notified in Worldometer.18 We have taken 7 days, for the mean incubation period motivated by these studies and Indian studies.26, 27 The other important parameter for modelling the epidemic is to find the period of infectiousness. For India, without having relevant data, we have resorted to looking upon other studies. The other studies suggest meaning infectiousness period (dif) is between 3 - 5 days.17, 28
It is also important that dif for India will be on the lower side, i.e. will be close to 3 days as lock-down, social distancing, contact tracing and isolation of the infected or exposed people are done from the very early stage of the disease. However, for a comparative study, we have considered the values 3 days for analyzing the model.
Recovery Rate: The recovery rate is defined as the inverse of infectious period dif. The WHO data and other studies indicate the infectious period is between 3 - 5 days. Incubation rate: Incubation rate is calculated by taking the inverse of the mean incubation period. WHO data and other studies indicate the infectious period is between 5 – 7 days.29
The Government of India's epidemic response strategy was a step-by-step approach with the screening at airports to initiation of travel restrictions, bans on public gathering, closure of schools, and work from home policy, following a Janata curfew on 22 Mar 2020 and a 21-day lockdown of its towns and cities on 23rd Mar 2020 However, strict lockdown is not implemented and essential services are open for the general public. Tough travel bans were imposed but the movement of migrant people could not be strictly restricted. Besides incidences of people running away from quarantine centres, people stamped for home quarantine getting caught roaming out of their homes, huge mobility of people to rural areas from urban areas, Markaz incident, and so on, the common public seems to be non-compliant and not serious of the situation.
With the help of different forecasting models, we can understand how an infectious disease spread and how different factors at different times play their role in transmission dynamics and predict the future scenario. Many time many predictions are inaccurate but social distancing, quarantine and adoption of very strict health and safety standard are most significant steps to stop virus spread has been known since many decades also quarantine was implemented decades back during the fight with Black Death before the proper knowledge of the existence of viruses.
Combination of Public health measures such as social distancing, rigorous contact tracing & testing, and isolation of contacts and the vulnerable persons are effective to reduce the instantaneous R0 value and could thereby reduce the final outbreak size. The proportion of the population required to be immune to achieve herd immunity (whether through past infection or vaccination) is dependent upon the R0 and particularly sensitive in the range of R0 1–2. Even a marginal reduction in R0 as a result of strengthening control measures was found to considerably reduce the projected COVID-19 burden at the district level. Projections based on publicly released daily COVID-19 case data are feasible and could be useful in guiding a data-driven COVID-19 response strategy at a local level. This could be used for decisive planning and management of the resource allocation for covid-19 which will help improve survival rates. Therefore, considering the increasing caseload, limited resources and dynamic situation of COVID-19, a decentralized evidence-driven approach is currently needed.
CONCLUSION
This pandemic exposes the failure of policymakers because they have sufficient time at the start of the pandemic. After applying basic modelling techniques, we can predict future transmission dynamics at the district level and by timely adoption of countermeasures thousands of lives can be saved and even if prevention of the pandemic is not possible, reduction of final impact of the pandemic at every district level can be executed.
DECLARATIONS
Source of funding: None
Conflict of interest: None
Acknowledgement: Authors acknowledge the immense help from the scholars whose articles are cited and included in references of this article. The authors are also grateful to authors/ editors/ publishers of all those articles, journals and books from where the literature of this article has been reviewed and discussed.
Author contribution: Singh S. designed the study and contributed to preparation, the framework of the study, forecasting, editing and final review of the manuscript. Patel M and Mishra A helped in formulating the intellectual content of the study along with manuscript preparation, editing and review. Sharma A helped in the literature review, statistical analysis and manuscript preparation. Derashri G and Modi A collected data and helped in the literature review.
Ethical approval: Obtained from Institutional Ethical Committee of Shyam Shah Medical College associated with Sanjay Gandhi and Gandhi Memorial Hospital, Rewa (MP) [Approval No 471/IEC/MC/2021 Dated 08/01/2021].
References:
-
WHO director-general's remarks at the media briefing on covid-19, https://www:who:int/dg/ speeches/detail/who-director-general-s-opening-remarks-at-the-media-briefing- on-covid-19---11-march-2020, accessed on 24th June, 2020 (2020).
-
Breban R, Vardavas R, Blower S. Theory versus Data: How to Calculate R0. PLoS ONE. 2007; 2(3): e282. doi:10.1371/journal.pone.0000282.
-
Harko T, Lobo FSN, Mak MK. Exact analytical solutions of the Susceptible-Infected-Recovered (SIR) epidemic model and the SIR model with equal death and birth rates. Appl Mathem Comput. 2014; 236: 184–94.
-
cddep.org, Covid-19 in India, https://cddep:org/covid-19/hospital-capacity-in-india/, accessed on 10th June 2020.
-
A.Joshi, S. Paul, Phylogenetic analysis of the novel coronavirus reveals important variants in Indian strains, bioRxiv .2020; 23(12): 435-438. doi:10:1101/2020:04:14:041301.
-
Strategy for COVID-19 Testing in India – Version 5. Indian Council of Medical Research. 2020. May 18, [202003]. https://www.icmr.gov.in/pdf/covid/strategy/Testing_Strategy_v5_18052020.pdf.
-
Box GEP. Science and statistics. J Am Stat Ass. 1976; 71: 791–799.
-
Kanagarathinam K, Sekar K. Estimation of the reproduction number and early prediction of the COVID-19 in India using a statistical computing approach. Epidem Heal. 2020 May 09;42:e2020028.
-
Bhaskar A, Ponnuraja C, Srinivasan R, Padmanaban S. Distribution and growth rate of COVID-19 outbreak Tamil Nadu: A log-linear regression approach. Ind J Public Health. 2020;64(6):188.
-
Lv M, Luo X, Estill J, Liu Y, Ren M et al. COVID-19 in India using a statistical computing approach: a scoping review. Euro Surveill. 2020 Apr;25(15):2000125.
-
Khosravi A, Chaman R, Rohani-Rasaf M, Zare F, Mehravaran S et al. The basic reproduction number prediction of the epidemic size of the novel coronavirus (COVID-19) in Shahroud, Iran. Epidem Infect. 2020; J10(14):e115.
-
Agha Ali M, Kolifarhood G, Nikbakht R, Saadati HM, Hashemi Nazari SS. Estimation of the serial interval and reproduction number of COVID-19 in Qom, Iran, and three other countries: A data-driven analysis in the early of the outbreak. Transbound Emerg Dis. 2020;5(30): 342-345; doi: 10.1111/tbed.13656.
-
Delamater PL, Street EJ, Leslie TF, Yang YT, Jacobsen KH. The complexity of the Basic Reproduction Number. Emerg Infect Dis. 2019 Jan;25(1):1–4.
-
S. Zhang, M. Y. Diao, W. Yu, L. Pei, Z. Lin, D. Chen, Estimation of the reproductive number of novel coronavirus (COVID-19) and the probable outbreak size on the Diamond Princess cruise ship: A data-driven analysis, Int J Inf Dis. 2020; 93(2):201.
-
G. Giordano, F. Blanchini, R. Bruno, P. Colaneri, A. Di Filippo et al. Modelling the covid-19 epidemic and implementation of population-wide interventions in italy, Nature Med. 2020;2(6): 172-176.
-
Q. Bi, Y. Wu, S. Mei, C. Ye, X. Zou et al. Epidemiology and transmission of COVID-19 in 391 cases and 1286 of their close contacts in Shenzhen, China: a retrospective cohort study. Lancet Infect Dis. 2020;30(9):920-926.
-
K. Prem, Y. Liu, T. W. Russell, A. J. Kucharski, R. M. Eggo et al. The effect of control strategies to reduce social mixing on outcomes of the covid-19 epidemic in Wuhan, China: a modelling study. The Lancet Pub Health. 2020; 5(5):e261- e270.
-
M. Park, A. R. Cook, J. T. Lim, Y. Sun, B. L. Dickens, A systematic review of covid-19 epidemiology based on current evidence. J Clin Med. 2020; 9(4):967.
-
cddep.org, Covid-19 in India, https://cddep:org/covid-19/hospital-capacity-in-india/, accessed on 10th June,2020.
-
T. Bhatnagar, S. Mandal, N. Arinaminpathy, A. Agarwal, A. Chowdhury et al, Prudent public health intervention strategies to control the coronavirus disease 2019 transmission in India: A mathematical model-based approach. Ind J Med Res. 2020;15(12):190.
-
Rudra B, Srijit B, Pritish VK. Analyses and Forecast for COVID-19 epidemic in India. MedRxiv. 2020;12(6): 273-278.
-
Lauer SA, Kyra H, Bi Q, Jones FK et al, The incubation period of coronavirus disease 2019 (covid-19) from publicly reported con_rmed cases: Estimation and application. Ann Inter Med. 2020; 172 (9):577-582.
-
Chan JM, Yuan S, Kok KH, Chu SD. Wang W, et al, A familial cluster of pneumonia associated with the 2019 novel coronavirus indicating person-to-person transmission: a study of a family cluster. The Lancet. 2020; 395 (10): 514 - 523.
-
J. A. Backer, D. Klinkenberg, J. Wallinga, Incubation period of 2019 novel coronavirus (2019- ncov) infections among travellers from Wuhan, China, 20-28 January 2020. Euro Surveill. 2020;25(7): 243-247.
-
Ferretti L, Wymant C, Kendall M, Zhao L, Nurtay A. et al., Quantifying sars-cov-2 transmission suggests epidemic control with digital contact tracing. MedRxiv. 2020; 368 (64):491-494.
-
Mandal M, Mandal S, Covid-19 pandemic scenario in India compared to China and rest of the world: a data-driven and model analysis. MedRxiv .2019; 10(2): 345-353.
-
Chatterjee S, Sarkar A, Chatterjee A, Karmakar D, Paul R. Studying the progress of covid-19 outbreak in India using sird model. MedRxiv. 2020; 19(13): 345-353.
-
Woelfel R, Corman VM, Guggemos G, Seilmaier V, Zange C et al., Clinical presentation and virological assessment of hospitalized cases of coronavirus disease 2019 in a travel-associated transmission cluster. MedRxiv. 2020; 12( 23): 451-453.
-
Li Q, Guan X, Wu P, Wang X, Zhou H. et al, Early transmission dynamics in Wuhan, China, of novel coronavirus-infected pneumonia. New Engl J Med. 2020; 382(13):1199-1207.
|
 IJCRR
IJCRR 


 This work is licensed under a Creative Commons Attribution-NonCommercial 4.0 International License


