IJCRR - 2nd Wave of COVID-19: Role of Social Awareness, Health and Technology Sector, June, 2021
Pages: 173-177
Date of Publication: 11-Jun-2021
Print Article
Download XML Download PDF
Analysis of Top Ten Countries with Highest Number of COVID-19 Cases
Author: Ali Arshad
Category: Healthcare
Abstract:Introduction: Since December 2019, the whole world severely affected due to COVID-19 which impact all sectors of daily life ranging from social, economic, education health, medical, travel, games and leisure. Due to COVID-19 whole world facing an adverse crisis of all nature covering almost all areas of including social, economic, travelling, educations and even health. This study presents a detailed analysis related to the role of the total number of days to reach maximum daily cases of COVID-19 cases. Objective: To investigate the impact of temperature and the total number of days to reach the highest daily cases and mortality rate in the top ten affected worldly countries. Methods: A detailed analysis of the impact of temperature and the role of the total number of days to reach the peak in selected countries. The available data from WHO is used to analyze the impact of temperature and the total number of days in worldly top ten affected countries in the COVID-19 first wave. The number of days was counted between the date when the highest number of daily cases were witnessed and the date the first case was reported. Results: Percentage ratio analysis of total deaths till the day highest daily cases reported for each country both with total population and with accumulated cases up to the day of the highest number of cases. It is evident from Figure 7 (a) that the highest mortality rate is 0.1 percent of the population which is very low compared with total deaths of 3% reported so far worldwide 3-4. Moreover, the mortality rate with accumulated cases is found in 1 to 5 percent except for Peru which is 12 percent. Conclusion: In this research, the work period is considered in terms of the number of days for all regions for peak and found that an average (178.10\?10.92) days took to reach the highest number of COVID-19 cases. Moreover, for most regions inversely proportional trend is observed between the highest number of daily cases and the total number of days to reach the peak. However, it is found that temperature is not correlated with the increase or decrease of daily cases and the number of days to attain peak.
Keywords: Global pandemic, COVID-19, Peak identification, The span of the average number of days for peak, Daily tempera�ture, The total population
Full Text:
Introduction
At end of 2019, the world witnessed a new virus which was named COVID-19 and it spread so quickly in the whole of the world. The countries imposed lock down the movement locally and internationally as well. The world is always on the verge of encountering health-related challenges which are evident by the novel wave of SARS (Severe Acute Respiratory Syndrome named COVID-191. This virus, which allegedly appeared in China in December 2019, was later (February 2020) termed as “Corona Virus Disease ‘19 (COVID-19)” by the World Health Organization (WHO). COVID-19 is the seventh variant of the coronavirus family1. Moreover, in March 2020, it gained eminence of pandemic2 and impacted widely exercised spheres of the human race beyond health such as social, economic, leisure and educational institutions, etc. This virus is found highly contagious 2 as by 30th October 2020, more than 39 million people across the globe were infected by this virus and caused 1.1 million deaths so far.3,4 Moreover, studies3,5 show people with underlying health issues (or chronic diseases) and the elderly are highly prone to this virus. Efforts have already been devoted by many researchers in identifying vital factors such as climate more specifically temperature and humidity,6-10 cultural customs of regional people such as smoking, drinking etc. 5 crucial and early actions such as lockdown, social distancing and SOP’s related to wearing of masks etc. to help to control the number of cases 11. In 14, the author presented the model to evaluates and predict the COVID-19 growth in Malaysia to limit the spread of the virus. Medical scientists put a lot of effects to create the cure for the COVID-19 disease and after almost one year several companies introduced a vaccine for the COVID-19. The various countries already started giving doses to the citizens to prevent the spread of the disease and save the life of the citizens.
In the presented study, we aim to investigate the total number of days took to reach to highest daily cases in the worlds top ten countries with the highest number of COVID-19 infected cases. The paper also talks about the death ratio to the number of COVID-19 infected cases and the total population of the cross ponding country. For analysis world, top ten countries are selected which are affected severely by this novel virus named COVID-19.
Material and Method
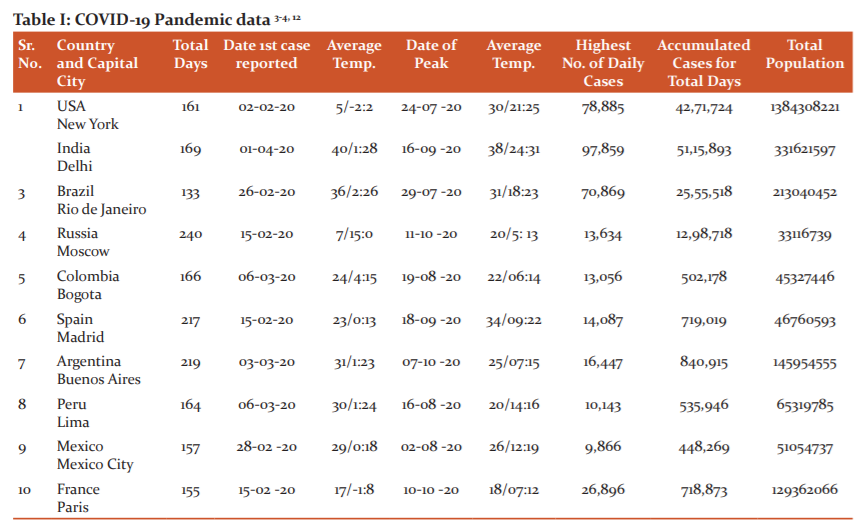
A detailed analysis related to the role of the total number of days to reach maximum daily cases for the world top ten countries with the highest number of COVID-19 cases is presented. Several days were counted between the date when the highest number of daily cases were witnessed and the date the first case was reported. For example, in the USA it took 161 days to reach the peak of the first COVID-19 from date February, 15th 2020 to date July, 24th 2020. Mean temperature on the days of incidence of the first case and highest daily cases are (15.70o C ±3.13o C) and (19o C ±1.94o C) respectively. Moreover, a mean number of the highest daily cases are found (35174.20±10644.93). However, the mean number of days took to reach the highest daily cases are (178.10±10.92). In Russia, it took 240 days to reach the highest number of daily cases with a temperature increase of 13o C (from 0o C to 13o C) whereas in Brazil roughly 136 days took with a temperature decrease of 3 units 13o C (from 26o C to 23o C). Also, India and Mexico are countries with the highest 97,859 and least 9,866. Worldometer and WHO webpage is used for the collection of COVID-19 data. Whilst temperature values are obtained from the Time and Date metrological webpage and values are recorded for the Capital city of each country. COVID-19 pandemic data such as date of the first case reported, accumulated cases, the highest number of daily cases, the date on the day highest cases hit, total population etc. For top ten countries with the highest number of cases are is collected from Worldometer and WHO 3-4 and is presented in Table-1. The mean temperature values are recorded from the meteorology webpage: Times and Date 12 for day first case arrived (with a mean temperature of 15.70±3.13) and on the day when peak (with a mean temperature of
19±1.94) is identified. World Bank webpage 13 was used to record the total population of countries considered with a mean population of (244586619±130114932.6), however, the population is also given in. 3,4
Results and Discussions
Four regions of the world North and South America, Europe and Asia includes 10 countries with the highest COVID-19 cases are identified and analyzed in this study. Seven countries are found with the highest daily cases below 30,000 whereas only three countries are with cases more than 70,000. In the European region, Russia was found to have the least number of highest daily cases peak occurred after 240 days. Then Spain which gained peak in more than 210 days, however in France peak reached in more than 180 days. In the European region and the inversely proportional trend is observed between days to reach a peak against the highest number of daily cases. India is the only country with the highest daily cases and representing the Asian region with a peak attained in 167 days. Finally, the South and North American region attain peaks from 150 to 180 days. No relation is observed in this presented study between temperature and the number of days for peak cases.
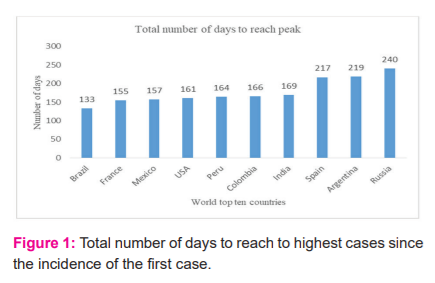
Amongst the top ten countries with the highest number of total COVID-19 cases, Brazil is the one which accomplished peak (defined as the highest number of daily cases) in the least number of days,e. 133. Whilst peak for Russia observed in a maximum of 240 days. Moreover, seven out of ten countries reached a peak in 133-169 days. Only three countries crossed beyond 210 days as is evident from Figure 1.
Moreover, it is clear from Figure 2 that the highest daily cases for six countries are in a range of (9500-16500), whereas only France has approximately 27000 cases and only three countries are with cases in the range of (70,500-98000).
Four regions of the world shown in Figure 3 (a-b) are identified covering North and South America, Europe and Asia including the top ten countries with the highest COVID-19 cases. Interestingly, an inversely proportional trend is observed for the Europe region between days to reach peak against the highest number of daily cases (see Figure 3 (a-b)).
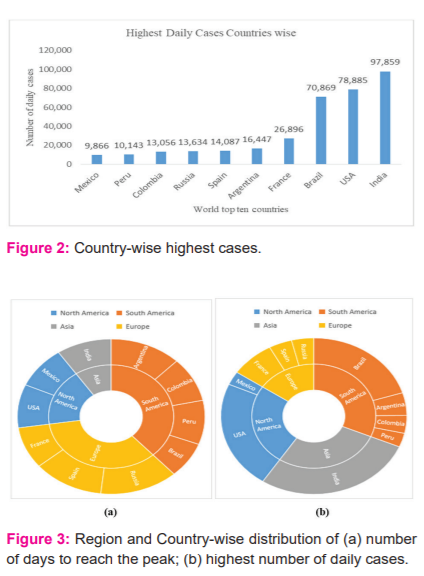
Also, India is the sole country with the highest daily cases representing the Asian region with again the number of days in the lowest range. Also, from the South American region, Brazil is with the highest number of cases with a peak gained in the least number of days. Likewise, from the North American region, the USA is the highest number of cases with a peak gained in the higher end of the lowest range (i.e, 133-169) of the number of days.
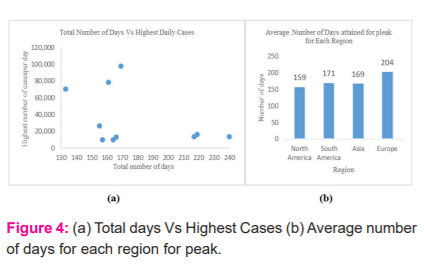
Figure 4 (a-b), depicts an average of 150 to 180 days are required to reach a peak since the inception of the first case. Almost the same was observed for the country with the highest cases for the Asia region. For Europe, on average 210 days took to attain the peak of the cases since the first case was reported by the country. Factors such as temperature play a huge role in the rate of increase of infection cases6,8,10 which emphasize reflecting about average temperature on the day of inception and the day of peak and is presented in Figure 5. Considering leading countries in case of the highest number of daily such as India, USA and Brazil, it is evident since reporting of first case temperature is increased by 23o C up to the day to attain peak for the USA( Figure 5).
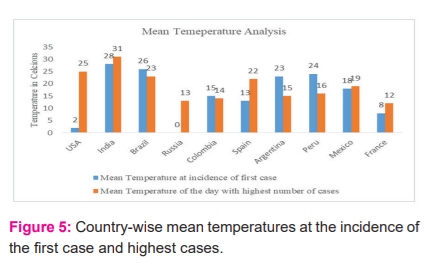
Negligible increase of 3o C is noticed for India which is the top leading country with the highest daily cases. Interestingly, in the case of Brazil, a decrease of 3o C is observed. Consequently, correlation of increase or decrease in temperature with increase or decrease in cases requires extensive study. In this regard, we suggest readers consult text11 with preliminary findings on this subject. Furthermore, considering Russia (an increase of 13o C with highest daily cases 13,634) and Peru (a decrease of 8o C with highest daily cases 10,143), in terms of cases no such variation, whereas the negatively correlated trend is evident for temperature profile.
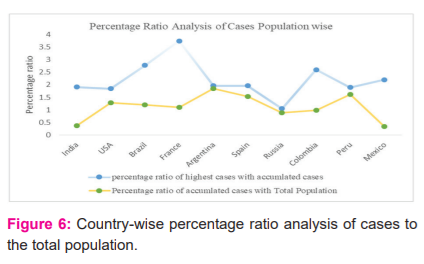
Figure 6, presents a percentage ratio analysis of the highest daily cases with accumulated cases up to the day of highest cases in this regard. The percentage ratio ranges from 1 to 4 for all countries, however in the case of countries with the highest cases such as India, the USA and Brazil percentage ratio varies from 1.8 to 2.8. More, interestingly the percentage ratio of accumulated cases with total population varies from 0 to 2 which is not very alarming compared to the total population. Particularly, in the case of countries (such as Mexico, India and Russia) with a total population of 1.3-1.5 billion by 2020, the percentage ratio of accumulated cases to total population is below 0.5 for India and Mexico and below 1 for Russia, as is evident from the blue line in Figure 6.
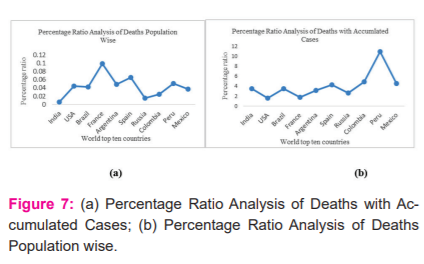
Percentage ratio analysis of total deaths till the day highest daily cases reported for each country both with a total population (see Figure 7 (a)) and with accumulated cases up to the day of highest cases is presented (see Figure 7 (b)). It is evident from Figure 7 (a) that the highest mortality rate is 0.1 per cent of the population which is very low compared with total deaths of 3% reported so far worldwide 3-4. Moreover, the mortality rate with accumulated cases is found in 1 to 5 per cent except for Peru which is 12 per cent.
-
Strength of Study
The strength of this study can be measured based on the following factors. At first, data considered is taken from reliable sources such as WHO, Worldometer, World Bank and Date and Time1-3,11. Secondly, for reliable findings, a longer period consisting of eight months and the top ten countries with the highest infected cases were considered. Moreover, identification of the total number of days to reach peak for countries with most infected cases is investigated. As per our published literature, such an investigation is not made. Information related to the total number of days for the peak is highly valuable as (a) it is directly linked with a range of measures required for the management of outbreak of pandemic; (b) it will provide a good base for upgrading existing health facilities to cope with COVID-19 cases for future waves or reoccurrence; (c) effectiveness of proposed measures can be assessed and can be utilized in future; (d) readiness of health staff covering doctors, nurses etc. can be planned as per the highest number of daily cases.
Conclusions
In this research work time, span is considered in terms of the number of days for all regions for peak and found that an average (178.10±10.92) days took to reach the highest number of COVID-19 cases. Moreover, for most regions inversely proportional trend is observed between the highest number of daily cases and the total number of days to reach the peak. However, it is found that temperature is not correlated with the increase or decrease of daily cases and the number of days to attain peak. Various countries in the world are going through 3rd wave of COVID-19 and countries imposing complete lockdown in the country. Most of the Asian countries including India, Pakistan, Bangladesh, Nepal, Iran, etc. were severely affected during 3rd wave and countries already started Vaccination of the people. In future work, the 3rd wave data will be collected and investigated by using the same parameters. The finding presented in this paper will be further investigated by using the data from COVID-19 third wave and critical comparison will be analyzed and results will be presented in future research work.
Ethical Statement
Data utilized in this research related to Global pandemic COVID-19 infections are obtained from Worldometer, WHO and World Bank. Moreover, data related to temperature is obtained using webpage Time and Date. This data is publicly available and does not require ethical approval.
Acknowledgement
The author is thankful to the organizations from whom data is retrieved
Source(s) of support: Nil
Presentation at a meeting: Nil
Conflicting Interest (If present, give more details): Nil
Author Contribution:
The author of this paper collected the data from various sources related to COVID-19 cases of top ten countries and temperature of the capital city of cross-ponding countries to analyze the relation between weather and the number of cases and deaths. Also analyzed the cases to population ratio and death to population ratio to establish the connection of weather and population of top ten countries.
References:
-
Alzahrani SI, Aljamaan IA, Al-Fakih EA. Forecasting the spread of the COVID-19 pandemic in Saudi Arabia using the ARIMA prediction model under current public health interventions. J Infect Public Health. 2020;13(7):914-19.
-
Lai CC, Shih TP, Ko WC, Tang HJ, Hsueh PR. Severe acute respiratory syndrome coronavirus 2 (SARS-CoV-2) and coronavirus disease-2019 (COVID-19): The epidemic and the challenges. Int J Antimicrob Agents. 2020;55(3):5924-34.
-
World Health Organization: Coronavirus. Available at: https://www.who.int/healthtopics/coronavirus, accessed October 04, 2020.
-
Worldometer: Available at:https://www.worldo- meters.info/coronavirus/, accessed on October 04, 2020.
-
Ahmed AT, Ghanem AS. A statistical study for impacts of environmental conditions on the rapid spread of new coronavirus. Int J Environ Sci. Techn. 2020;17(7):4343-52.
-
Wu Y, Jin W, Liu J, Ma Q, Yuan J, Wang Y, et al. Effects of temperature and humidity on the daily new cases and new deaths of COVID-19 in 166 countries. Sci Total Environ. 2020;729:139051.
-
Ahlawat A, Wiedensohler A, Mishra SK. An Overview on the Role of Relative Humidity in Airborne Transmission of SARS-CoV-2 in Indoor Environments. Aerosol Air Qual. Res. 2020;20(9): 1856-61.
-
Casanova LM, Jeon S, Rutala WA, Weber DJ, Sobsey MD. Effects of air temperature and relative humidity on coronavirus survival on surfaces. Appl Environ Microbiol. 2010;76(9):2712-17.
-
Altamimi A, Ahmed AE. Climate factors and incidence of Middle East respiratory syndrome coronavirus. J Infect Public Health. 2020;13(5): 704-8.
-
Meo SA, Abukhalaf AA, Alomar AA, Al-Beeshi IZ, Alhowikan A, Shafi KM, et al. Climate and COVID-19 pandemic: effect of heat and humidity on the incidence and mortality in world's top ten hottest and top ten coldest countries. Eur Rev Med Pharmacol Sci. 2020;24(15):8232-38.
-
Comics S, Aldhahir MA, Almehmadi M, Alghamdi MS, Alqarni A, Oyelade T, et al. COVID-19 Outcomes in Saudi Arabia and the UK: A Tale of Two Kingdoms. MedRxiv. 2020;4:2009640.
-
Time and Date: Available at: https://www.timeanddate.com/weather/saudi-arabia/riyadh/historic? month=2&year=2020, accessed on October 20, 2020.
-
World Bank, Population total. Available https://data.worldbank.org/indicator/sp.pop accessed on October 04, 2020.
-
COVID-19 Educational Disruption and Response. UNESCO, https://en.unesco.org/news/covid-19-educational -disruption-and-response, accessed on date January 01, 2021.
-
COVID-19 Educational Disruption and Response. UNESCO. https://en.unesco.org/news/covid-19-educational-disruption-and-response, 2020-03-04, accessed on January 30, 2021.
-
Bao, X, Qu H, Zhang R, Hogan TP, Modeling Reading Ability Gain in Kindergarten Children during COVID-19 School Closures. Int J Env Res Public Health. 2020;17(17):6371.
-
Aristovnik A, Kerži? D, Ravšelj D, Tomaževi? N,Umek L. Impacts of the COVID-19 Pandemic on Life of Higher Education Students. A Global Perspective. Sustain. 2020,12(20):8438.
|
 IJCRR
IJCRR 


 This work is licensed under a Creative Commons Attribution-NonCommercial 4.0 International License


