IJCRR - 13(12), June, 2021
Pages: 112-117
Date of Publication: 22-Jun-2021
Print Article
Download XML Download PDF
Novel Method Development and Validation for UV-Visible Spectrophotometric Analysis of Methscopolamine Bromide
Author: Maninder Pal Singh, Manish Kumar, Kashish Wilson, Prerna
Category: Healthcare
Abstract:Aims and Objectives: The research work presented here aims to develop a novel approach towards a precise and effective analytical method for qualitative estimation of methscopolamine bromide, a drug of choice to treat peptic ulcer. Methods: The absorbance of methscopolamine bromide was low even at a higher concentration as obtained from the Ultraviolet visible (U.V.) spectroscopical method. Therefore it was required to enhance absorbance value to precisely perform qualitative analysis by different approaches. In this process, novel attempts were made to develop a new method for estimation such as the addition of chromophores and the use of colourimetric techniques but all of the attempts did not produce satisfactory results. Results: At last encouraging results including enhanced absorbance were obtained by using sodium picrate at λmax of 440 nm and linearity was observed within the range of 1-5 \?g/ml with a regression coefficient of 0.984. The method was then validated to ensure reproducibility as per ICH (International Conference on Harmonization) guidelines. Conclusion: The method was successfully employed for the determination of methscopolamine bromide with good linearity, precision, robustness and specificity. The proposed method can be used for quality control during the routine quality assessment of bulk drug and does not involve the use of residual solvents which ensures that the method is novel and economic which may be used by pharmaceutical industries for commercial utilization.
Keywords: Methscopolamine bromide, UV-spectrophotometry, Validation, Novel, Analytical method, Quantitative estimation
Full Text:
INTRODUCTION
Methscopolamine bromide (Mb) is an anticholinergic drug. It reduces the secretions of certain organs in the body such as stomach. It is used to control the peptic ulcers by blocking the muscarinic receptor.1,2 The melting point of methscopolamine bromide is 220-2300C.3 Chemically it is (1S, 5S, 7R)-7-{[(2S)-3-hydroxyphenylpropanoyl] oxy} 9, 9-dimethyl-3-oxa-9azatricyclo [3.3.1.0{2,4}] nonanium bromide.3 Molecular Formula of methscopolamine bromide is C18H24BrNO4. The molecular weight of Mb is 398.30. It is a white crystalline powder. It is freely soluble in water, slightly soluble in ethanol (95%v/v).
The mechanism of action of bromide methscopolamine interferes with the delivery of acetylcholine nerve impulses in the parasympathetic nervous system. (specifically the vomiting centre).4 It does so by acting as a muscarinic antagonist. It is used as adjunctive therapy for the treatment of peptic ulcer.5 Pharmacodynamic of methscopolamine bromide is poorly and unreliably absorbed (10% to 25%)6. Elimination of Mb primarily in urine and bile as well as an unabsorbed drug in the faeces. The onset of the time of methscopolamine bromide is 1 hour and the duration is 4 to 6 hours.7
An important component in the formulation development of any drug molecule is an analysis. A validated and suitable method has to be available for the analysis of drug(s) in the bulk, in drug delivery systems, in biological samples and from release dissolution studies. If a suitable method, for a specific need, is not available then it becomes essential to develop a simple, sensitive, accurate, precise, reproducible method for the estimation of drug samples. The estimation of methscopolamine bromide by, high-performance liquid chromatography [HPLC], high-performance thin-layer chromatography [HPTLC] and sensitivity of UV is very less reported in the literature.8 Thus the present study was undertaken to develop and validate a simple, sensitive, accurate, precise and reproducible U.V method for methscopolamine bromide.
MATERIALS AND METHODS:
Equipments
The following equipments were used: double beam UV visible spectrophotometer connected to a computer loaded with Shimadzu UVPC, Electronic balance, BL -220H (Shimadzu Corporation, Japan).
Reagents and Chemicals
Methscopolamine Bromide (assigned purity 99%) was provided as a gift sample by Alkaloids Private Limited, Kolkata (India). Taurine for synthesis (99% pure) and Picric acid were purchased from Loba Chemie Private Limited (India). Sodium Periodate (99% pure) was purchased from Nice Chemicals Private Limited, Cochin (India) and Ninhydrin (99% pure) was obtained from Qualikems Private Limited (India).
Method development
The scanning and U.V spectra of the solution containing methscopolamine were recorded for the concentration ranging from 300-500μg/ml. It was observed that the resulting λmax was showing less absorbance even at high concentration. This problem highlighted the requirement and necessity for the development of a new method that can offer detection with enhanced sensitivity. The method was then successfully developed and validated to fulfil the desired needs. Initially different functional groups present in the drug molecule like hydroxyl, quaternary amine and epoxide groups were treated with reagents to form coloured complex, however, the method was developed by complexation with an epoxide group.
Addition of chromophore
The hydroxyl group of methscopolamine bromide was estimated to form complex with sodium periodate and Taurine.9 The chromophore solution (Sodium periodate and Taurine) was added to drug solution with concentration of 10 μg/ml. The solution was then heated at 80-1000c for 15 minutes and was scanned by UV-spectrophotometer. The absorbance was less and it was observed that the method was not efficient in estimation of drug (Fig. 2b).
Addition of ninhydrin and silver nitrate
The structure of methscopolamine bromide is having quaternary ammonium as one of the functional group. The group was targeted to provide complexation with ninhydrin or silver nitrate. The reaction was expected to produce a coloured complex which can be detected by colourimetric technique. 500 μg/ml solution of ninhydrin was added to the drug solution of concentration 100μg/ml. The solution was mixed properly with the reagent and was scanned spectrophotometrically. One drop of silver nitrate was added separately in another 10μg/ml drug solution and was scanned10. In both cases again, the method was not found to be good enough to be used for estimation of the drug as the absorbance was found to be very less as well as the complexes were not found to be stable (Fig. 2c and 2d).
Addition of picric acid solution
The epoxide group of methscopolamine bromide was predicted to form a complex with picric acid.11 One ml of 0.25M picric acid was added to the drug solution with a concentration of 10 μg/ml. The solution was heated at 50-600C for 15 minutes and was scanned by using a spectrophotometer. This method was found to show little improvement but the desired results were not obtained (Fig 2e).
Addition of sodium picrate
The sodium picrate solution was the one which reacted with the epoxide group of methscopolamine bromide and formed stable complex. 0.1 ml of sodium picrate solution was added in drug solutions with concentration ranging from 1μg/ml to 5μg/ml and these solutions were kept undisturbed for some time at room temperature12. The scanning was done and the λmax was found to be 440 nm. The standard plot was then prepared for drug solution with concentration ranging from 1-5 μg/ml. Thus, a sensitive method for the estimation of methscopolamine bromide was developed. The method was further validated according to ICH guidelines (Fig 2f).
Method validation
Method validation was performed following International Conference on Harmonization (ICH)13 specifications, which include linearity, specificity, accuracy, precision, robustness, detection limit and quantitation limits.
Linearity
Linearity is the ability of the method to elicit the results of test samples that are directly proportional to analyte concentration within a given range. Different aliquots from the stock solution were sufficiently diluted to get the solution in a concentration ranging 1-5 μg/ml in triplicate. Calibration plots were obtained by plotting the graphs between absorbance versus concentration data and linear regression analysis was carried for the same. The values were reported as the mean ± S.D. of the calibration curves. The data were analyzed at a wavelength of 244 nm.
Accuracy
Accuracy was determined by performing recovery studies. It was performed by preparing different concentration levels (2, 3 and 4) μg/ml. the study was carried out in triplicate as three sample solutions were prepared for each recovery level. U.V absorbance was analyzed and % mean recovery along with % R.S.D was calculated.
Precision
The precision of proposed method was determined for three concentrations (2, 3 and 4 μg/ml) covering the entire linearity range by intraday (repeatability) and interday studies (intermediate precision). Intraday precision was determined by analyzing (2, 3 and 4 μg/ml) at three different time points of the same day and interday precision was determined by analyzing the solutions at three different time points on different days.14 For analyzing the precision % R.S.D was calculated for intraday and interday precision studies.
Robustness
The robustness of the method was determined by analyzing a change of 2 nm in the wavelength of the analysis. Six sample solutions of concentration 3 μg/ml were prepared and the assays were carried out at 440 and 442 nm. The % R.S.D was determined for the solutions to observe the variation and limits of variation in response to the small deliberate change in wavelength.
Limit of detection (L.O.D) and limit of quantification (L.O.Q)
Estimation of L.O.D and L.O.Q was based on the standard deviation of response and slope of the calibration curve. It was calculated from equation (1) and equation (2)
L.O.D = 3.3 σ /S (σ = Standard deviation of the intercept of linear regression equation) (1)
(S= Slope of the regression equation)
L.O.Q = 10 σ /S (σ = Standard deviation of the intercept of linear regression equation) (2)
(S= Slope of the regression equation).
RESULTS AND DISCUSSION:
Preparation of standard plot
Scanning of methscopolamine bromide
Scanning of drug was done by using UV spectrophotometer and λmax was found to be 257 nm.
Standard plot
Standard plot of methscopolamine bromide was prepared in 0.1 N hydrochloric acid (pH 1.2) at 257 nm. The range of the concentration was 100-1000 µg/ml. The plot of different concentration of the drug and absorbance was found to be linear but showed very less absorbance at higher concentration i.e. 0.506 at 1000 µg/ml. The dose of methscopolamine bromide was very less (5 mg) so developed the UV visible analytical method as shown in Table 1(a).
Method development using UV visible range
The absorbance maximum was found to be 440 nm. The calibration plot of methscopolamine bromide was found to be 0.506 at 1000 µg/ml. The absorbance was very less at a higher concentration so the method was developed by the complexation method. Sodium picrate solution was used to develop the method. The λmax was found out to be 440 nm.
Scanning of methscopolamine bromide with 0.1 ml sodium picrate
Scanning of the drug was done by adding sodium picrate using a UV spectrophotometer (400-800 nm range) and λ max was found to be 440 nm.
The standard plot of methscopolamine bromide with 0.1 ml of sodium picrate
0.1 ml of sodium picrate solution were added in drug having 1μg/ml to 5μg/ml concentration and kept for 15-30 minutes at room temperature. The absorbance (0.2 to 0.8) was found to be 1μg/ml to 5μg/ml at 440 nm (Table 1 (b)).
Method validation
Method validation was performed in accordance with International Conference on Harmonization (ICH) specifications, which include linearity, specificity, accuracy, precision, robustness, detection limit and quantification limits.15
Linearity and Range
Table I c shows concentration and absorbance at 440 nm. Linearity was observed in the range of 1– 5 μg/ml at 440 nm with a significantly higher value of correlation coefficient, R2 = 0.984 thus, follow Beer Lambert's law in this range as shown in Table 1 (c).
Accuracy
Accuracy results showed good reproducibility with an SD value below 2. The method was found to be accurate within the acceptable deviation. These results proved that the method was accurate shown in Table 2 (a).
Precision study
The results of intraday, interday repeatability and reproducibility have been summarized in Table II b and c respectively. The results were found to show good reproducibility with SD below 2. The results were very close to the true value. There was negligible variation in intraday and interday precision.
Robustness
Robustness results have been summarized in Table 2(d) and showed good results. All the samples in 0.1N HCl (pH 1.2) showed SD below 2. From the observed data, it was found that slight changes in λmax do not affect the absorbance.
Limit of detection (L.O.D) and limit of quantification (L.O.Q)
The L.O.D. and L.O.Q. were found to be 0.042 μg/ml and 0.12 μg/ml respectively. These results demonstrate that the method is sensitive and can detect the drug in the above-mentioned concentration range.
UV, UV-VIS and Derivative spectrophotometry are broadly used techniques to quantify drugs4 because they are simple, inexpensive and do not require time-consuming sample preparation compared with others techniques.2 Moreover, UV spectrophotometry produces very low amounts of residues and solvents, which is an important ecological aspect currently discussed in routine laboratory analysis. Because of these reasons and the careful validation of this method, can be recommended for routine laboratory analysis.2
CONCLUSION:
The validated analytical method for the quantitative determination of methscopolamine bromide has the advantages of speed, simplicity, low-cost conditions. All validation parameters were found to be satisfactory, including linearity, accuracy, precision, robustness and adequate detection and quantification limits. The validated method is a good alternative for routine quality control of methscopolamine bromide by the pharmaceutical industry and quality control laboratories. This procedure uses simple reagents, requires minimal sample preparation. Its use is therefore encouraged for routine analysis. We had developed an alternative method to using chromophores by making use of sodium picrate to enhance absorbance and hence greater sensitivity of UV analysis.
Acknowledgement:
We are thankful to Alkaloid Corporation Pvt. Ltd. Kolkata for providing the gift sample of methscopolamine bromide. We would also like to thank Dr. G.S Kalra Campus Director CT Group of Institutions Jalandhar for providing all the facilities to complete our work successfully.
SOURCE OF FUNDING: No Funding
CONFLICT OF INTEREST: We have no conflicts of interest.
ETHICAL APPROVAL: None
AUTHORS’ CONTRIBUTION: Mr. Maninder Pal Singh had done experimental work. Dr. Manish Kumar and Dr. Narendra Kumar Pandey have written manuscript.
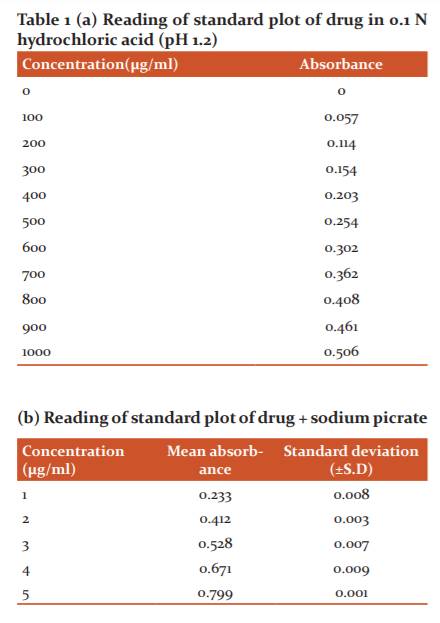

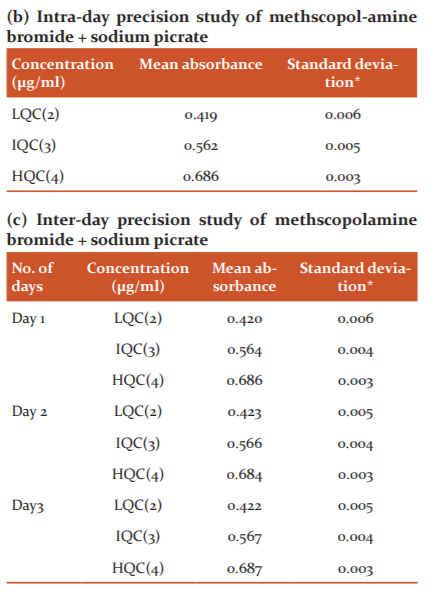
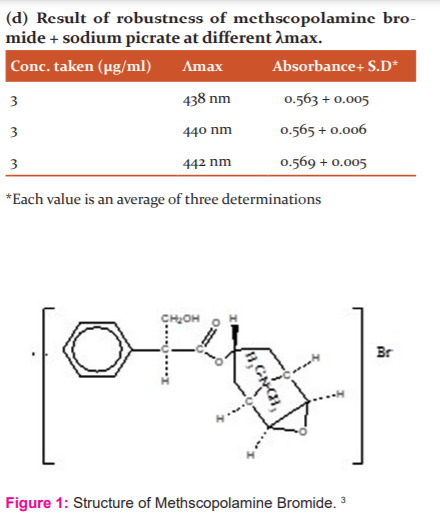
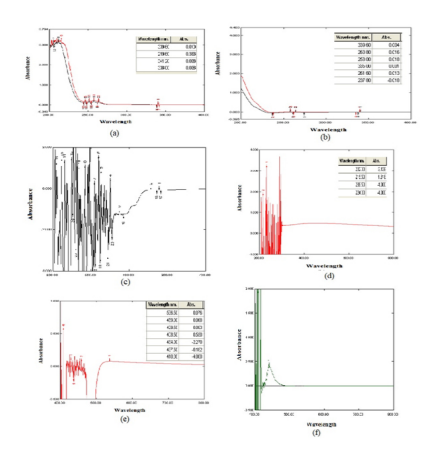
Fig. 2: (a) Scan of Methscopolamine bromide (300, 500µg/ml)
(b) Scan of Methscopolamine bromide (10 μg/ml, 100 μg/ml) with Sodium periodate
and Taurine
(c) Scan of drug 100μg/ml with Ninhydrin solution 500μg/ml
(d) Scan of drug solution 10μg/ml with silver nitrate.
(e) Scan of 10μg/ml drug solution with 0.25 M picric acid solution.
(f) Scan of methscopolamine bromide (2 μg/ml) solution with sodium picrate
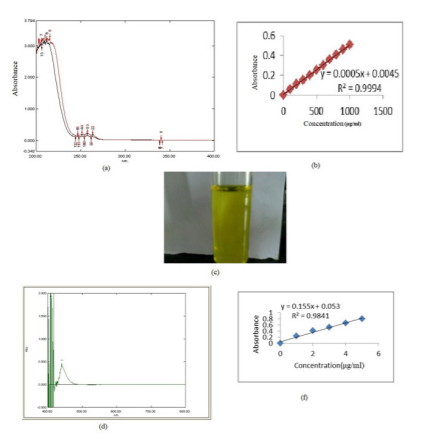
Fig. 3: (a) Scanning of methscopolamine bromide (500µg/ml).
(b) Standard plot of methscopolamine bromide in 0.1N HCl (pH1.2).
(c) Observed view of 5μg/ml drug solution with 0.1 ml of sodium picrate solution.
(d) Scan of methscopolamine bromide + sodium picrate.
(e) Standard plot of methscopolamine bromide + sodium picrate.
References:
-
Beermann B., Helstrom K. and Rosen A.: Absorption of 14C-methylscopolamine from the digestive tract, Eur J Pharma Sci. 1971, 4, 46-51.
-
Rowe RC, Sheskey PJ, Quinn ME, (Eds.) Handbook of Pharmaceutical Excipients, 6th ed.; Pharmaceutical Press: London, UK, 2009; pp. 525–533, ISBN 978 0 85369 792 3.
-
Drugbank.2018.http://www.drugbank.ca/drugs/DB00462.
-
Fioriti JA, Bentz AP, and Sims RJ, The reaction of Picric acids with epoxides, J American Oil Chem Soc. 2018, 43, 487-490.
-
Guyton AC and Hall JE, Textbook of medical physiology, 9thed., W.B.Saunders Company, Philadelphia, 1996, 803.
-
Kumar GN. Design and evaluation of soft anticholinergics based on methscopolamine, American Oil Chem Soc. 1994, 0191-0191.
-
Mendelson WB, Sitaram N, Wyatt RJ. and Gillin JC. Methscopolamine inhibition of sleep-related growth hormone secretion: evidence for a cholinergic secretory mechanism. J Clin Invest. 2011, 61(6), 1683-1690.
-
Patel J, Kevin G, Patel A, Raval M, Sheth N. Development of the UV spectrophotometric method of Olmesartan medoxomil in bulk drug and pharmaceutical formulation and stress degradation studies. Pharm. Methods. 2011, 2(1), 36–41.
-
Woo JS and Ryu JK. Quantitative determination of voglibose in pharmaceutical tablets using high-performance liquid chromatography-fluorescence detection with post-column derivatization and mass spectrometric detection, J Pharm Biomed Anal. 2006, 42, 328-333.
-
Martinez PR, Vila-Jato JL, Souto C and Ramos T. Controlled release of cephalexin from double-layer tablets containing small proportions of acrylic resins, Int J Pharm. 1986, 32, 99-102.
-
Shinde AJ, Patil MS. and More HN. Formulation and evaluation of an oral floating tablet of cephalexin, Indian J Pharm Educ Res. 2010, 44, 1-10.
-
Yoshioka S and Stella VJ. Stability of drugs and dosage forms. New York: Kluwer Academic Publishers, 2002, 205-213.
-
Chavanpatil M, Jain P, Chaudhari S., Shear R. and Vavia PR.: Novel sustained release, swellable and bioadhesive Gastroretentive drug delivery system for ofloxacin, Int. J. Pharm. 2006, 316, 86-92.
-
Christian V, Ghedia TT. and Gajjar V. A Review on Floating Drug Delivery Systemsas a part of GRDDS. Int J Pharm Research and Dev. 2011, 3, 233 - 241.
-
Rajesh D, Saravanan D. and Padmavathy J. Formulation and Evaluation of Ofloxacin Floating Tablets Using HPMC, Int J Pharmacy and Pharm Sci. 2011, 3, 31-42.
|
 IJCRR
IJCRR 


 This work is licensed under a Creative Commons Attribution-NonCommercial 4.0 International License


