IJCRR - 13(12), June, 2021
Pages: 74-81
Date of Publication: 22-Jun-2021
Print Article
Download XML Download PDF
Rest-induced Reduction in Walking Speed Helps Differentiate Degenerative Compression Myelopathies from Lumbar Spinal Stenosis
Author: Enoki H, Tani T, Ishida K, Wang S, Kimura J
Category: Healthcare
Abstract:Introduction: Patients with degenerative compression myelopathy (DCM) most commonly complain of gait-onset difficulty typically prominent after periods of inactivity. This feature stands in contrast with the post-exerciseneurogenic claudication characteristic of lumbar spinal stenosis (LSS). Aims: To test if DCM patients indeed have a greater difficulty at the beginning of gait than in steady-state conditions as compared with age-, gender-, and height-matched healthy subjects and LSS patients. Methodology: We studied 49 consecutive, ambulatory DCM patients, 11 controls, and 10 LSS patients. After sitting in a chair for 10-min, immobilizing the lower-limb muscles, the subject walked 15 m one way and returned the same distance with one turn at the maximum comfortable speed. A 2.64-m long ground reaction force plate allowed measurement of the step lengths, cadences, and speeds for the initial and terminal 2.64-m walks. Results: Unlike the controls or LSS, the DCM had a smaller (p< 0.001) step length-to-height ratio for the initial than final 2.64- m walk. The initial-to-final walking speed ratios showed smaller values in DCM (85.1\?9.4 %,) than in the controls (93.8\?6.2 %; p< 0.01) and LSS (96.5\?7.3 %; p< 0.001). Both the step length and walking speed for the initial 2.64-m in DCM significantly correlated with the lower-limb motor scores and the number of taps in the 10-sec foot-tapping test that quantifies the slowness of voluntary leg movements. Conclusions: Reduced walking speed in DCM became more pronounced immediately following 10-min sitting. This phenomenon seems to represent an additional aspect of the same physiologic mechanisms that characterize spastic gait disorders. Altered descending central drive caused by corticospinal tract involvement may account for this phenomenon, combined with rest-induced hyperexcitability of the pertinent anterior horn cells.
Keywords: Gait initiation, Degenerative compression myelopathy, Spasticity, Rest-induced hyperexcitability, Anterior horn cell
Full Text:
INTRODUCTION
Degenerative compression myelopathies (DCM), the commonest non-traumatic spinal cord disorders in Japan, gives rise to a variable combination of gait disturbance such as stiffness, clumsiness and unsteadiness.1 These features reflect spastic limb paresis characterized, in part, by functionally impaired fast movements2 especially in rapid repetition,3 which retard voluntary execution out of proportion to the degree of weakness.4 Thus, 30-m walking5 and 10-sec foot-tapping speed 6,7 have proven useful as quantifiable measures for gait impairment in DCM patients with spastic paraparesis. Spastic gait results from inappropriate activation of rapidly lengthened muscle at a certain point during the gait cycle, altering its mechanical properties with increased stiffness.8
Although not as well-recognized as slowness of movements, DCM patients tend to show the most noticeable clumsiness of gait after periods of inactivity such as on rising in the morning and after extended sitting.1 This feature of rest-induced gait difficulty seen in upper motor neuron disorders stands in contrast with post-exerciseneurogenic claudication characteristic of lumbar spinal stenosis (LSS). The opposing presentations of the two very common entities serve as an important clue in identifying the primary site of involvement when cervical and lumbar lesions coexist. Despite the clinically important implication, few previous studies dealt with further confirmation of this point. The present study attempts to verify rest-induced gait disturbances in DCM as compared to healthy controls and LSS.
Materials and METHODS
Subjects
We analyzed 49 ambulatory DCM patients (26 men), 62 ± 14 (mean ± SD) years in age and 160 ± 9 cm in height, with spastic paraparesis either by cervical (45) or thoracic myelopathy (4), 11 volunteers (7 men), 70 ± 7 years in age and 158 ± 8 cm in height, with no history of peripheral or central nervous system disease or orthopedic diseases impairing the gait, and 10 LSS patients (6 men), 67 ± 17 years in age and 160 ± 10 cm in height, with neurogenic claudication. Both DCM and LSS patients were selected out of those who had been consecutively referred to a university hospital for surgical treatment between October 2016 and March 2017. They all underwent a gait performance test using a ground reaction force plate, and the DCM patients also had a 10-sec foot-tapping test6,7 to study the correlations between the two test results.
The three groups showed no statistical difference (p>0.05) in age, gender ratio or height. All subjects agreed in writing to participate in the study after reading and signing an informed consent form approved by the ethics committee of Kochi Medical School with the approval number of 23-84 on 1 November 2011.
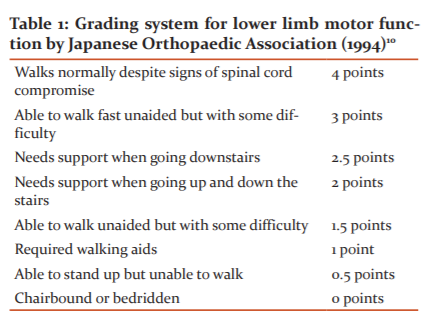
Functional scale
The functional scale developed by the Japanese Orthopedic Association (JOA) for DCM9 scores motor function from 0 to 4 points for lower limbs (Table 1). Three patients walked normally despite signs of spinal cord compromise (4 points); 4 could walk fast unaided but with some difficulty (3 points); 3 needed supports when going downstairs (2.5 points); 24 had supported when going up and down the stairs (2 points); 13 walked unaided but with difficulty (1.5 points); and 2 required walking aids (1 point). Stretch reflexes were generally hyperactive although responses were diminished for the quadriceps in 4 patients and the gastrocnemius in 11. A positive Babinski sign was found in 24 patients. We excluded the patients who were able to stand up but unable to walk (0.5 points), and chair-bound or bedridden patients (0 points).
Gait performance test
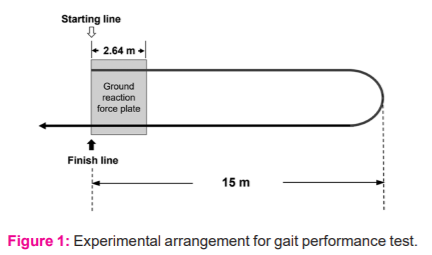
A gait analysis system (Gait scan 4000; Nitta Corp, Tokyo Japan) consisted of a rectangular-shaped ground reaction force plate 2.64 m long and 0.54 m wide, an analogue to digital (A-to-D) converter, and an amplifier capable of driving an analogue monitor display. The force plate contained a thin sensor sheet with a resolution of 5 mm for detection of foot pressure greater than 0.5 kg. The subject sat on a chair quietly for 10 min and then stood up on bare feet in response to the verbal signal. The test did not include a measurement of the time taken to rise from sitting, excluding the influence of lower limb strength and balance deficits. When the subject was ready, he/she started to walk over a smooth, flat surface in a corridor for a measured distance of 30 m (going 15 m one way and returning the same distance with one turn). We instructed subjects to walk at the maximum comfortable speed from the beginning, using personal walking aids, and to go through the finish line without reducing the speed. All the participants understood these instructions. The 2.64-m ground reaction force plate covered each end of the 30-m walkway (Figure 1).
First, the subject quietly sat on a chair for 10 min, and then, stood up to his/her bare feet and started walking for a measured 30 m distance (15 m there and back with one turn) at the maximum comfortable speed. We instructed the subject to walk through the finish line without reducing the walking speed. The ground reaction force plate 2.64 m in length recorded the movement trajectories of the centre of foot pressure from heel strike to toe-off as a function of time for the initial and final 2.64-m walks.
The gait analysis system allowed recording of the sequential changes of the ground reaction force from heel strike to toe-off as a function of time during the stance phase of walking (Figure 2). Based on the raw data recorded, this automated device digitally displayed the measured temporal and distance values for initial and final 2.64-m walks, including (1) step length, defined as the average distance from one heel strike to the other for a few strides, which was converted into a percentage of the height, (2) step frequency (cadence), the number of steps per unit of time reported as steps per minute, and (3) walking speed, defined as the average horizontal speed of the body over the 2.64-m distance.8 To assess the degree of slowing at the beginning of gait relative to the steady-state gait, we calculated the measured values for the initial 2.64-m walk in the percentage of those for the final 2.64-m walk (initial/final).
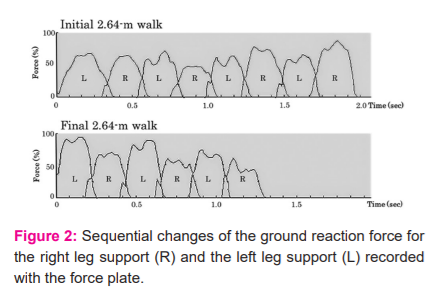
During the initial 2.64-m walk (top) and the final 2.64-m walk (bottom) in a 78-year-old man with cervical spondylotic myelopathy. Abscissa, time in seconds after heel-strike of the first swing leg. Ordinate, foot pressure in the percentage of the maximal value of each recording. The measurement showed the step length of 0.35 m and the walking speed of 0.71 m/s for the initial 2.64-m walk and 0.40 m and 0.96 m/s, respectively, for the final 2.64-m walk.
10-sec foot-tapping test (FTT)
We used a previously described method for a 10-sec foot-tapping test,7 an objective, easy-to-use means of quantifying the slowness of voluntary leg movements resulting from spasticity. In short, the subject sat on a chair with its height adjusted to have both soles flat on the floor and the hip and knee joints flexed at approximately 90°. We instructed the subjects to keep both heels firmly placed on the ground and repeatedly tap the floor quickly and vigorously for 10 sec unilaterally. Following a few practice trials, the subjects carried out two test trials once on each side. The examiner counted the number of taps for each trial and obtained the average of the two as the score.
Statistics
Statistical measures, setting the significance level at p < 0.05, included: (1) the Chi-square test for comparing categorical data, (2) Paired t-test for evaluating paired continuous data, (3) the one-way ANOVA followed by Tukey post hoc test (for homoscedasticity data) or Games-Howell test (for heteroscedasticity data) for comparing unpaired continuous data between groups, and (4) the Spearman’s rank correlation coefficients for interrelation analyses. We used SPSS software, version 21.0 (SPSS Inc., Japan) for these statistical analyses.
We used G*Power version 3.1.9.2 software (Heinrich-Heine-Universität Düsseldorf, Germany) for power analyses to estimate the statistical power of the results obtained with the current sample sizes.
RESULTS
Step length in gait performance test
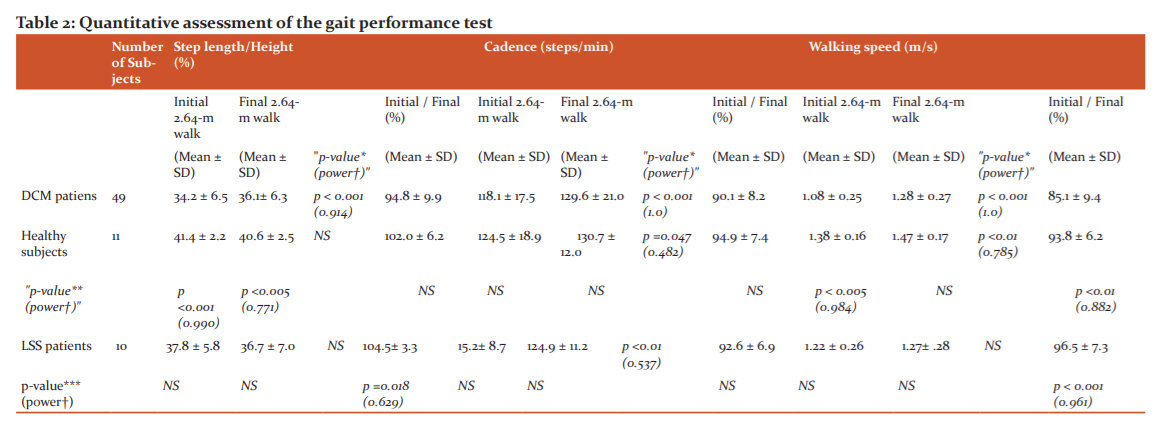
Table 2 summarizes the results (mean ± SD)of the quantitative assessment of the gait performance test. Comparison of the step length (expressed in percentage of the height) within each group demonstrated a significantly smaller value for the initial than final 2.64-m walk in the DCM (34.2±6.5 % vs. 36.1±6.3 %; p<0.001 [power=0.914]) but not in the healthy controls or LSS. Comparison of the step length between DCM and other two groups showed a smaller value in the DCM than in the controls for the initial (34.2±6.5 % vs. 41.4±2.2 %; p<0.001 [power=0.990]) and final 2.64-m walks (36.1±6.3 % vs. 40.6±2.5 %; p=0.005 [power=0.771]). The initial-to-final step length ratios (initial/final) showed a significantly smaller value in DCM (94.8±9.9 %) than in LSS (104.5±13.3 %; p=0.018 [power=0.629]) (Figure 3) [Table 2].
* Comparison between Initial 2.64-m walk and Final 2.64-m walk with paired t-test.
** Comparison between DCM patient group and Healthy subject group with one-way ANOVA followed by Tukey post hoc test or Games-Howell test.
***Comparison between DCM patient group and LSS patient group with one-way ANOVA followed by Tukey post hoc test or Games-Howell test.
† Statistical power obtained by using G*Power version 3.1.9.2 software.
NS, not significant; DCM, degenerative compression myelopathy; LSS, lumbar spinal stenosis.
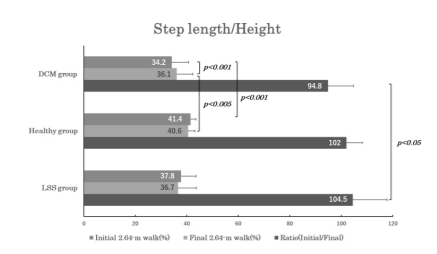
Figure 3. Bar graphs illustrating the step length expressed in percentage of the height for the initial 2.64-m walk (dark gray bar) and the final 2.64-m walk (light grey bar), and the initial-to-final step length ratio (black bar) in patients with degenerative compression myelopathy (DCM group), healthy subjects (healthy group), and the patients with lumbar spinal stenosis (LSS group). Note that only the DCM group showed a significant difference between the initial and final step length and a significantly smaller initial-to-final step length ratio than LSS groups.
Cadence in gait performance test
Comparison of the cadence within each group demonstrated a significantly smaller value for the initial than final 2.64-m walk in all three groups (p<0.001 [power=1.000] for DCM; p=0.047 [power=0.482] for controls; p<0.01 [power=0.537] for LSS). Comparison of the cadence between DCM and the other two groups revealed no significant differences for the initial nor final 2.64-m walk, nor the initial-to-final cadence ratios (initial/final) (Figure 4).
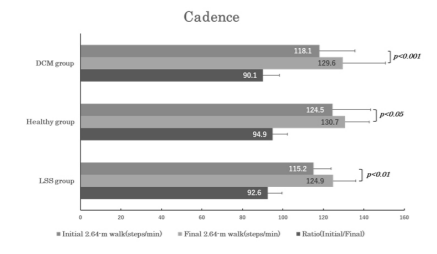
Figure 4. Bar graphs of the same arrangement as in Figure 3 illustrate the changes in cadence (i.e., step frequency). Note that all three groups showed a significant difference between the initial and final cadence.
Walking speed in gait performance test
Walking speed measured significantly smaller for the initial than the final 2.64-m walk both in DCM (1.08±0.25 m/s vs. 1.28±0.27 m/s; p<0.001 [power=1.000]) and healthy group (1.38±0.16 m/s vs. 1.47±0.17 m/s; p<0.01 [power=0.785]), but not in LSS. Comparison of the walking speed between DCM and other two groups showed smaller values in DCM than in controls only for the initial 2.64-m walk (1.08±0.25 m/s vs. 1.38±0.16 m/s; p<0.005 [power=0.984]). The initial-to-final walking speed ratios (initial/final) showed a significantly smaller value in DCM (85.1±9.9 %) compared to either controls (93.8±6.2 %; p<0.01 [power=0.882]) or LSS (96.5±7.3 %; p<0.001 [power=0.961]) (Figure 5).
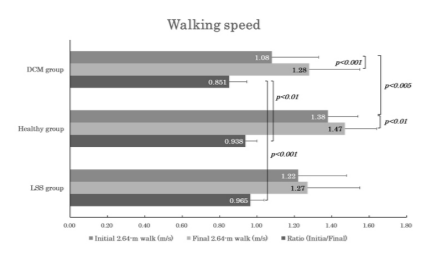
Figure 5. Bar graphs of the same arrangement as in Figs. 3 and 4 to illustrate the changes in walking speed. Note that both DCM and the healthy groups showed significant differences between the initial and final walking speeds, and the DCM group had a significantly smaller initial-to-final walking speed ratio than the other two groups.
Correlation of step length and walking speed for the initial 2.64-m walk with functional scale and FTT in DCM patients
The JOA lower-limb motor scores averaged 2.1±0.7 points, and the number of taps in FTT, 19.2±4.3 times, for DCM. The step length and the walking speed for the initial 2.64-m walk showed a significant correlation with the JOA scores (r=0.479; p<0.001 and r=0.364; p<0.01) and the number of taps in FTT (r=0.349; p=0.014 and r=0.342; p=0.016).
DISCUSSION
Gait initiation constitutes a critical part of mobility function and presents a challenge for many patients with central nervous system pathology8 such as stroke,10-14 cerebral palsy,15 and Parkinson’s disease.16-21 The complex process of gait initiation involves various anticipatory postural adjustments in preparation for stepping, including soleus muscle inhibition followed by tibialis anterior (TA) muscle activation in the swing limb before heel-off.8,22,23Electromyographic (EMG) studies with surface electrodes combined with kinematic analysis in patients with poststroke gait disorders revealed a delayed onset and reduced amplitude of TA muscle activation when initiating gait with the paretic limb.10,11,13
In one study, spinal cord injury patients with lower limb spasticity had a prominent interval prolongation from the beginning of the quadriceps EMG activity to the onset of fast knee extension.24 Also, spinal cord injury patients, classified as ASIA Grade D (Chang et al., 2004),25 demonstrated a prolonged gait initiation period between the auditory cue and heel-strike of the first swing leg and the reduced first step length. Most previous studies on DCMprimarily focused on kinematical gait pattern analyses under steady-state conditions.26-31 Therefore, few dealt with gait-onset difficulty typically prominent after periods of inactivity, which patients most commonly complain about.
We thus designed the present study to document ifDCM patients indeed have a greater difficulty at the beginning of gait than in steady-state conditions as compared with healthy subjects and LSS patients.
Our data confirm significantly slower speeds in DCM than in controls for the initial 2.64-m. Although both groups walked more slowly for the initial than final 2.64-m, the reduced speed reflected a decline in both step length and cadence for DCM and a decline in cadence alone for controls. Like the healthy group, LSS also had an initial decline of cadence without step length shortening. This finding stands in contrast to a previous report that walking speed initially changes as a function of step length rather than step frequency or cadence.8 This discrepancy may have resulted from the instructions given to the participants for baseline walking: maximum comfortable speed from the beginning in the current study; and subjects’ comfortable speed in the previous study. Accordingly, our healthy subjects and LSS patients must have managed a longer step length from the beginning to maximize the speed but DCM patients could not keep up because of spasticity. Furthermore, DCM had significantly lower initial-to-final ratios in step length than in LSS, and walking speed than controls and in LSS. All things considered, these findings indicate that DCM characteristically affects gait initiation, reducing both step length and cadence immediately following a period of leg muscle relaxation more than during steady-state gait.
In addition, both the initial step length and walking speed in DCM showed a significant correlation with the JOA functional assessment scores and FTT data that quantify the slowness of voluntary leg movements. This finding indicates that the pronounced slowness in gait initiation after sitting constitutes an additional physiologic mechanism for spastic gait seen in DCM.
Based on the available data, we can only speculate on the physiological mechanisms underlying this phenomenon. As shown by early studies with rectified surface EMG analyses, spastic limbs require a longer duration of EMG activity than normal to reach the muscular tension for movement initiation.24.32,33 These data suggest that the corticospinal tract lesions reduce the number of functional upper motor neurons, which then must fire repetitively for temporal summation of the discharges to activate a sufficient amount of anterior horn cells.32 Because of this compensatory mechanism, gait initiation takes longer after corticospinal tract lesions than normal. In addition, as demonstrated in recent studies using F-wave34-38 and H-reflex,39 the anterior horn cell requires ongoing descending facilitatory influences to maintain its excitability. Consequently, sustained leg muscle relaxation while lying or sitting could induce rest-induced hyperexcitability of the pertinent anterior horn cells. This, in turn, may further reduce walking speed at the beginning of gait immediately after a certain period of inactivity of the leg muscles.
Regardless of the underlying mechanisms, the presence of rest-induced delay in gait initiation often hints at the diagnosis of DCM. In addition, awareness of this symptom helps provide appropriate care to prevent a fall-related hip fracture. For DCM patient care and rehabilitation, assistants must remember “speed-accuracy trade-off”, a well-known phenomenon in motor behaviour,40 which predicts quicker the attempt, less accurate the outcome.
STUDY LIMITATIONS
We tested only a relatively small number of healthy subjects and LSS patients and unfortunately, the manufacturer now provides only a revised version of the ground reaction force plate different from that used in this study, which may preclude conducting a larger scaled study to further confirm the results. According to a post-hoc power analysis, the differences detected in the present study had a power level greater than 80% (i.e., 0.8) for the significance level at p<0.001, but not necessarily so for the lower significance levels.
CONCLUSIONS
We conclude that reduced walking speed in DCM patients becomes more pronounced immediately following a 10-min sitting. This phenomenon seems to represent an additional aspect of the physiologic mechanisms that characterize spastic gait disorders. Altered descending central drive caused by corticospinal tract involvement may account for this phenomenon in combination with rest-induced hyperexcitability of the pertinent anterior horn cells.
Acknowledgements
The authors acknowledge the immense help received from the scholars whose articles are cited and included in references of this manuscript. The authors are also grateful to authors/editors/publishers of all those articles, journals, and books from where the literature for this article has been reviewed and discussed.
Conflict of Interest – NIL
Source of Funding - NIL
References:
1. Allen CD. Neurology of cervical spondylotic myelopathy. In: Saunders RL, Bernini PM, editors. Cervical spondylotic myelopathy. Boston: Blackwell Scientific Publications; 1992: 29-47.
2. Hallett M. Ballistic elbow flexion movements in patients with amyotrophic lateral sclerosis. J Neurol Neurosurg Psychiatry 1979; 42: 232-7.
3. Sahrmann SA, Norton BJ. The relationship of voluntary movements to spasticity in the upper motor neuron syndrome. Ann Neurol 1977; 2: 460-5.
4. Miller TM, Johnston SC. Should the Babinski sign be part of the routine neurologic examination? Neurology 2005; 65:1165-8.
5. Singh A, Crockard HA. Quantitative assessment of cervical spondylotic myelopathy by a simple walking test. Lancet 1999; 354: 370-3.
6. Numasawa T, Ono A, Wada K, Yamasaki Y, Yokoyama T, Aburakawa S, et al. Simple foot tapping test as a quantitative objective assessment of cervical myelopathy. Spine 2012; 37: 108-13.
7. Enoki H, Tani T, Ishida K. Foot tapping test as part of the routine neurologic examination in degenerative compression myelopathies: a significant correlation between 10-sec foot-tapping speed and 30-m walking speed. Spine Surg Relat Res 2019; 3: 207-13.
8. Shumway-Cook A, Woollacott MH. Motor control: Translating research into clinical practice. 5th ed. Philadelphia: Wolters Kluwer; 2017. Chapter 15, Spasticity; 381-385.
9. Japanese Orthopaedic Association. Scoring system (17-2) for cervical myelopathy. Nippon Seikeigeka Gakkai Zasshi 1994; 68: 498.
10. Brunt D, Linden DWV, Behrman AL. The relation between limb loading and control parameters of gait initiation in persons with stroke. Arch Phys Med Rehabil 1995; 76: 627-34.
11. Hesse S, Reiter F, Jahnke M, Dawson M, Sarkodie-Gyan T, Mauritz K-H. Asymmetry of gait initiation in hemiparetic stroke subjects. Arch Phys Med Rehabil 1997; 78: 719-24.
12. Dion L, Malouin F, McFadyen B, Richards CL. Assessing mobility and locomotor coordination after stroke with the rise-to-walk task. Neurorehabil Neural Repair 2003; 17: 83-92.
13. Ko M, Bishop MD, Behrman AL. Effects of limb loading on gait initiation in persons with moderate hemiparesis. Top Stroke Rehabil 2011; 18: 258-68.
14. Muthukaruppan SS, Subbanna R, Bapurajapanicker H. A comparative study on extended timed get up and go (ETGUG) test between right and left hemiplegics. I J Curr Res Rev 2011; 7: 70-7.
15. Stackhouse C, Shewokis PA, Pierce SR, Smith B, McCarthy J, Tucker C. Gait initiation in children with cerebral palsy. Gait Posture 2007; 26: 301-8.
16. Elble RJ, Cousins R, Leffler K, Hughes L. Gait initiation by patients with lower-half parkinsonism. Brain. 1996; 119: 1705-16.
17. Gantchev N, Viallet F, Aurenty R, Mission J. Impairment of posture-kinetic co-ordination during initiation of forwarding oriented stepping movements in parkinsonian patients. Electroenceph Clin Neurophysiol. 1996; 101: 110-20.
18. Rosin R, Topka H, Dichgans J. Gait initiation in Parkinson’s disease. Mov Disord. 1997; 12: 682-90.
19. Jacobs JV, Nutt JG, Carlson-Kuhta P, Stephens M, Horak FB. Knee trembling freezing of gait represents multiple anticipatory postural adjustments. Exp Neurol. 2009; 215: 334-41.
20. Mancini M, Zampieri C, Carlson-Kuhta P, Chiari L, Horak FB. Anticipatory postural adjustments before step initiation are hypermetric in untreated Parkinson’s disease: an accelerometer-based approach. Eur J Neurology. 2009; 16: 1028-34.
21. Delval A, Tard C, Defebvre L. Why we should study gait initiation in Parkinson’s disease. Neurophysiol Clin. 2014; 44: 69-76.
22. Brenière Y, Do MC, Sanchez J. A biomechanical study of the gait initiation process. J Biophys Med Nucl. 1981; 5: 197-205.
23. Crenna P, Frigo C. A motor programme for the initiation of forward-oriented movements in humans. J Physiol. 1991; 437: 635-53.
24. Nakamura R, Sajiki N. Motor reaction time as a measure of functional impairment in paraparesis. In: Delwaide PJ, Young RR, editors. Clinical neurophysiology in spasticity. Amsterdam: Elsevier Science Publishers; 1985:125-30.
25. Chang HA, Chuang TY, Lee SJ, Liao SF, Lee HC, Shih YH, et al. Temporal differences in the relative phasing of gait initiation and first step length in patients with cervical and lumbosacral spinal cord injuries. Spinal Cord. 2004; 42: 281-9.
26. Maezawa Y, Uchida K, Baba H. Gait analysis of spastic walking in patients with cervical compressive myelopathy. J Orthop Sci. 2001; 6: 378-84.
27. Kim CR, Yoo JY, Lee SH, Lee DH, Rhim SC. Gait analysis for evaluating the relationship between increased signal intensity on T2-weighted magnetic resonance imaging and gait function in cervical spondylotic myelopathy. Arch Phys Med Rehabil 2010; 91: 1587-92.
28. Malone A, Meldrum D, Gleeson J, Bolger C. Reliability of surface electromyography timing parameters in gait in cervical spondylotic myelopathy. J Electromyogr Kinesiol 2011; 21: 1004-10.
29. McDermott A, Bolger C, Keating L, McEvoy L. Meldrum D. Reliability of three-dimensional gait analysis in cervical spondylotic myelopathy. Gait Posture 2010; 32: 552-8.
30. Siasios ID, Spanos SL, Kanellopoulos AK, Fotiadou A, Pollina J, Schneider D, et al. The role of gait analysis in the evaluation of patients with cervical myelopathy: A literature review study. World Neurosurg 2017; 101: 275-82.
31. Nagai T, Takahashi Y, Endo K, Ikegami R, Ueno R, Yamamoto K. Analysis of spastic gait in cervical myelopathy: Linking compression ratio to spatiotemporal and pedobarographic parameters. Gait Posture 2018; 59: 152-6.
32. Angel RW. Electromyographic patterns during ballistic movement of normal and spastic limbs. Brain Res. 1975; 99: 387-92.
33. Nakamura R, Taniguchi R. Reaction time in patients with cerebral hemiparesis. Neuropsychologia. 1977; 15: 845-8.
34. Okada F, Kimura J, Yamada T, Shinohara M, Ueno H. Effect of sustained volitional muscle relaxation on the excitability of the anterior horn cells: comparison between the F wave and transcranial motor evoked potential (MEP). Jpn J Clin Neurophysiol. 2004; 32:213-219.
35. Taniguchi S, Kimura J, Yanagisawa T, Okada F, Yamada T, Taniguchi S, et al. Rest-induced suppression of anterior horn cell excitability as measured by F waves: comparison between volitionally inactivated and control muscles. Muscle Nerve. 2008; 37: 343-9.
36. Taniguchi S, Kimura J, Yamada T, Ichikawa H, Hara M, Fujisawa R, et al. Effect of motion imagery to counter rest-induced suppression of F-wave as a measure of anterior horn cell excitability. Clin Neurophysiol. 2008; 119: 1346-52.
37. Hara M, Kimura J, Walker DD, Taniguchi S, Ichikawa H, Fujisawa R, et al. Effect of motor imagery and voluntary muscle contraction on the F wave. Muscle Nerve. 2010; 42: 208-12.
38. Fujisawa R, Kimura J, Taniguchi S, Ichikawa H, Hara M, Shimizu H, et al. Effect of volitional relaxation and motor imagery on F wave and MEP: Do these tasks affect the excitability of the spinal or cortical motor neurons? Clin Neurophysiol. 2011; 122: 1405-10.
39. Yanagisawa T, Kimura J, Azuma Y, Ogushi M, Taniguchi S. Excitability of the anterior horn cells after volitional inactivity of soleus muscle: H reflex study. Jpn J Clin Neurophysiol. 2006; 34: 89-96. Japanese.
40. Schmidt RA and Lee TD, editors. Motor control and learning: A behavioural emphasis 4th ed. US: Human Kinetics; 2005;7:207-42.
|
 IJCRR
IJCRR 


 This work is licensed under a Creative Commons Attribution-NonCommercial 4.0 International License


