IJCRR - 2nd Wave of COVID-19: Role of Social Awareness, Health and Technology Sector, June, 2021
Pages: 77-80
Date of Publication: 11-Jun-2021
Print Article
Download XML Download PDF
Data Analysis and Visualization of the Coronavirus Pandemic [Covid-19] in Major Countries Using Python
Author: Kulshreshtha V., Garg NK, Maherchandani JK
Category: Healthcare
Abstract:Introduction: Human being is facing with an invisible enemy; the novel COVID-19 coronavirus. It was at the start found in the Wuhan province of China. Now it is spreading around the globe. Objective: The paper aims to explain total cases, new cases, total deaths, and new deaths caused by coronavirus pandemic [Covid-19] of three major countries viz. USA, Brazil, and India during this pandemic. Methods: This paper explains the data analysis and visualization of the coronavirus pandemic. The data is analyzed and visualized by using Python programming language. Case Study: Three case studies with the original dataset are shown in this paper, which is useful for the researcher to analyze the COVID-19 pandemic further. Conclusion: This data analysis result proves the lower Standard Deviation in India and the USA, which shows that data is aggregated close to mean value, which shows that data is reliable and uses further research
Keywords: Covid-19, Data analysis, Data visualization, Pandemic, Standard Deviation, Python
Full Text:
INTRODUCTION
Human being faced various pandemics during the past wherever several were very disastrous. During this time, we are facing a very challenging and tough time and struggling with an invisible enemy globally.1The first case of coronavirus emerged in Wuhan city, China, in December 2019 with the clinical characteristic of the severe acute respiratory syndrome.2 The number of COVID-19 cases has increased exponentially across China and has become a global pandemic.3 There were 79,515,525 confirmed cases and 1,757,947 death globally as of 28 December 2020.4Covid-19 becomes a global threat for public health.5 Clinical features, findings, management and preventions for Covid-19 were discussed and analyzed.6 This paper presents data analysis and visualization of the USA, Brazil and India. Further sections will explain the used methodology, case studies and discussion.
MATERIALS AND METHODS
The Covid-19 data has been analyzed and visualized using the Python programming language of the major affected countries from the pandemic coronavirus, including the United States of America, Brazil, and India. Python plays a very important role in the data analysis and data visualization of the above-mentioned countries.7,8
The data sets of twelve months have been taken i.e. from January 2020 to December 2020. The dataset contains the whole world's data for those countries that are affected till today around 79.5 million people are confirmed cases. This data keeps on increasing. The dataset has been taken from 01.01.2020 to 28.12.2020. The four major aspects have been considered for their data analysis and visualization. These are as follows:
-
Total cases: This field tells us about the total cases reported monthly of the countries as mentioned earlier in the above time frame
-
New cases: This data set tells us about the total new case reported monthly of the countries as mentioned earlier in the given time frame
-
Total deaths: It tells us about the total deaths recorded in the given time frame
-
New deaths: It tells us about the new deaths reported of the given countries in the given time frame.
CASE STUDY
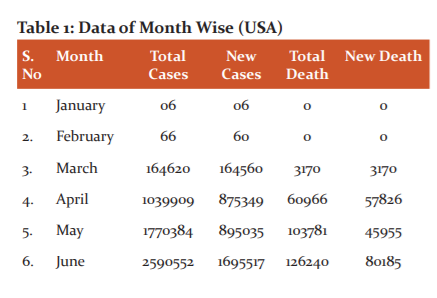
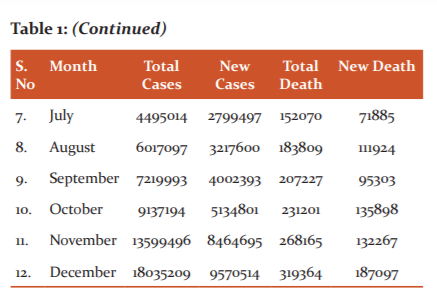
The United States of America is a highly affected country in the world. Presently the maximum numbers of active cases are in the USA. Table 1 shows data analysis of the USA. The total active cases till 28.12.2020 were 18.03 million; it is very threatening data. The total number of new cases reported in the USA until the date was 9570514, which is the highest data of new cases reported globally. The total number of deaths recorded in the USA till 28.12.2020 was 319364, which is disturbing data. This data shows that the USA is in an alarming stage. The total number of new death reported in the USA till 28.12.2020 was 187097, and it is kept on increasing.4-6 Table 1 shows no deaths recorded in January and February, but there was a burst in March, which reached 60966 in April. In May, the figure was 103781, and new death data was decreased, which were 45955. In June, it was again increased with 80185 and decreased to71885 in July. It was again increased and reached up to 187097 in December.7
Brazil is the second-largest country affected by a coronavirus. Till 28.12.2020, the total active cases were 7263619, which put the country at high risk. Table 2 shows the data of Brazil month wise. Table 3 shows the data of India. In India, the situation was under control in the first three months, January, February, and March, but there was a burst in April until July. Total new cases recorded were 33468 and 1267648, respectively. The death rate has also increased in these months. The figures of new deaths recorded were 1042 and 20970, respectively. It keeps on increasing up to December.8


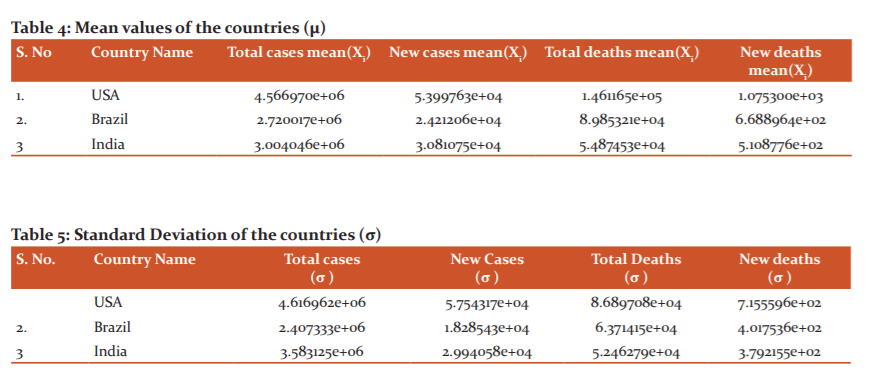
Standard Deviation is a measure of how spreads out the numbers are. In other words, it is a mathematical tool that helps us to access how far the values are spread above and below the mean (Table 3, Figures 1 and2). A low standard deviation indicates that the data points tend to be very close to the mean, which means that data is more reliable; a high standard deviation indicates that the data points are spread out over a large range of values, which means data is less reliable. Population Standard Deviation is calculated using Equation 1.

Where σ is standard Deviation, Xi is the individual values, N is total cases, and μ is the mean of all the values8.
As it is clear from the above Figures 1, 2, and Table 1, there were very few active cases in the USA in January and February month. But in March 2020, there was an outbreak in the active cases in the USA, and Table 2 shows that active cases were reached at 164620, which was very disturbing. In March 2020, 164560 new cases were reported; this is the highest figure of this month. From February to December, there was an exponential growth in the total active cases. This trend kept on increasing in April 2020 and the cases reached 1039909, and the total number of new cases reported was 875349. In May 2020, these cases reached 1770384 and total new cases 895035, which was lesser than the previous month. In December, this figure reached 18035209. Total death till 23.12.2020 reported was 319364, which was a very threatening figure.
In Brazil, Table 2 shows that there was a burst of cases in December, and the data reached 7263619, and new cases recorded were3894120, which is the highest in all the months. Similarly, in December, the total number of death was 187291, and the total number of new death recorded was 94748. It is an alarming stage for Brazil.
Table 3 shows that in India, the situation was under control in the first three months: January, February, and March, but a declination happened in November and December. Total new cases recorded were 5167793 and 4907323, respectively. The death rate has also decreased in these months. The figures of new deaths recorded were 137621 and 146111, respectively. Table 4 and Table 5 show the mean and standard deviation values of the USA, Brazil, and India. It is clear that the USA has the highest Deviation for total cases, and India has the minimum value.
CONCLUSION
This paper presents the data analysis and visualization of the coronavirus pandemic [COVID-19] of the USA, Brazil, and India using Python. In the case of new cases, the standard Deviation is very less in the USA and India, which shows that data is clustered close to the mean, which means that data is more reliable. Data analysis shows that the USA and Brazil are in a critical position. These countries need to follow the guidelines issued by WHO and other global organizations, which includes wearing a mask, social distancing, especially in public places. Data shows that India is in a better position due to continuous lockdowns and follows the guidelines issued by the Government of India. India has become successful in controlling the spread of coronavirus until December 2020 because of many factors. These factors mainly include following social distancing, wearing masks, washing hands, and doing proper sanitization. It is shown in the medical reports that this virus is only be suppressed when we break the chain of its spread. This data is beneficial for further research for Covid-19.
ACKNOWLEDGEMENTS: The authors are extremely thankful to the reviewers for their valuable suggestion for the improvement of the paper.
Conflict of Interest: The authors declare no conflicts of interest.
Financial support: We don't have any financial assistance from anywhere.
Ethical Issue: The data used in this study is taken fromwww.ourworldindata.org
and freely available for research use thus there is no need for ethical clearance.
References:
-
Said N. Coronavirus covid-19: available free literature provided by various companies, journals and organizations around the world. J Org Chem Res. 2020,5: 7-13.
-
Lai CC, Wang CY, Wang YH, Hsueh PR. Global coronavirus disease 2019: What has daily cumulative index taught us. Int J Anti Asgn. 2020;55(6): 238.
-
Wang L, Wang Y, Ye D, Liu Q. Review of the 2019 novel coronavirus (SARS-CoV-2) based on current evidence. Int J Anti Agen 2020,55(6):324-327.
-
https://covid19.who.int/?gclid=Cj0KCQjw_ez2BRCyARIsAJfgksiJkE56RN9BAqkKycd3q--lzP_4Tq7DJjZTf02A2ZPRWZsvfCl0tcaAh-OEALw_wcB. Accessed on 28.12.2020
-
Li H, Liu SM, Yu XH, Tang SL,Tang CK. Coronavirus disease 2019 (COVID-19): current status and future perspectives. Int J Anti Agen. 2020; 15(5): 231-236.
-
Gennaro DF, Pizzol D, Marotta C, Antunes M, Racalbuto V, Veronese N, Smith L. Coronavirus Diseases (COVID-19) Current Status and Future Perspectives: A Narrative Review. Int J Envt Res. 2020;17(8):471.
-
Villar M, Ballinas Y, Gutierrez C, Abgulo Y. Análisis de la Confiabilidad del Test Fantástico para medir Estilos de Vida saludables en trabajadores evaluados por el programa “Reforma de Vida” del Seguro Social de Salud (Essalud). Rev Peru Med Integr. 2016;1(2):17–26.
-
Bhasin SK, Sharma R, Saini NK. Depression, Anxiety and Stress among Adolescent Students Belonging to Affluent Families: A School-based Study. Ind J Pediatr. 2010;77:161–165.
|
 IJCRR
IJCRR 


 This work is licensed under a Creative Commons Attribution-NonCommercial 4.0 International License


