IJCRR - 2nd Wave of COVID-19: Role of Social Awareness, Health and Technology Sector, June, 2021
Pages: 55-62
Date of Publication: 11-Jun-2021
Print Article
Download XML Download PDF
Prediction of COVID-19 with Supervised Regression Algorithm Through Minimum Variance Unbiased Estimator
Author: Manikandan A, Shriram S, Sarathchandran C, Palaniappan S, Rohith ND
Category: Healthcare
Abstract:Introduction: COVID-19 is found as an irresistible sickness pandemic that has carried uncommon difficulties to worldwide networks across open and private sectors. Data processing and creating awareness is the important tool that implements the powerful actions to mitigate the spread of covid-19. Objective: To develop a supervised regression algorithm with minimum variance unbiased estimator which could the data on daily basis to assure the safety movement in post-covid-19. Based on the number of infected cases, the data will be trained for better prediction to create awareness for the public in the safety movement. Methods: The proposed supervised regression algorithm was able to model the relationship between the number of cases registered and a continuous target variable. By optimizing the error rate, the training algorithm was fine-tuned and the prediction was able to closely approximate the actual values. The proposed method was compared with other methods like Linear Regression, Logistic Regression and Supporting Vector machine (SVM). Results: Simulation results proved that the proposed supervised regression with minimum variance unbiased estimation provides better prediction when compared to the other methods. Conclusion: An attempt was made to predict the number of cases by a suitable regression algorithm and the prediction was compared with other regression algorithms. The algorithm was able to predict the infections rates and death count with the least error when provided with training data. This data purely depends on the lockdown implementations, movement of people without restrictions and the lack of awareness to face this pandemic situation. In future, the aspects can also be incorporated into the model for a better and accurate prediction.
Keywords: Covid-19, Machine Learning, Prediction, Linear Regression, Logistic Regression, Supervised Regression
Full Text:
Introduction
The emergence of severe acute respiratory syndrome coronavirus 2 (SARS-COV-2) in China has been declared by World Health Organization as a Pandemic.1 Virus found to be transmitted through respiratory droplets from an infected person and can stay on different surfaces ranging from hours to 10 days, which makes it a highly transmissible disease. The virus has spread to more than 200 countries with the number of people infected as 56,563,840 and has taken 1,354,806 human lives (as of 19/11/2020). Vaccinating the entire human population is estimated to be completed by 2024 according to WHO, which renders human need to employ other methods to prevent the virus infection. Identification and isolation of infected people become a critical parameter in controlling a pandemic. Symptoms in an infected person surface after 3 days and in some cases it could 14-28 days, which adds another dimension to the pandemic control.2 The infected person could transmit the virus to multiple people before identification of the virus and isolation.
Government agencies across the world employed methods like the closure of schools, colleges, offices, factories and restricting the movement of people, have yielded positive response to contain the virus spread. However, a prolonged closure of community has hit the economy of the world by bringing down the global growth at -4.9% in 2020. It has hit millions of people under poverty and hunger. At this moment, there is no specific treatment and the therapeutic methods to deal with the infection are only supportive, and prevention aimed at reducing community transmission. This situation has brought intense research into traditional systems of medicine.3 An approach of social distancing and restricted movement has emerged as the way for economic recovery and to control the spread of the virus.4,5 Such approach was found to delay the peak of the virus spread and also reduce the load on the health industry like hospitals, testing centre etc. A simulated study estimated a reduction of 23% in the transmission of H1N1 when workplace social distancing was followed and reduced the peak of the virus. Physical distancing measures were found to be effective to reduce the infection rate by 92% if the working pattern was staggered across the employees. A study on social contact matrices highlighted that social contact patterns has not been developed or understood at a large scale across the world.6 Such a study would help in understanding the behaviour of people movement and predict the transmission of the virus. A model with a capability to understand the contact pattern and restrict the movement of infected person would bring down the level of transmission of the virus and help to isolate the infected people. Machine learning has proved its potential in recent days of research by solving complex real-time problems with suitable algorithms.
Machine learning uses Artificial Intelligence (AI) that gives frameworks the capacity to consequently take in and improve for a fact without being unequivocally modified. Supervised learning involves autonomous training to obtain information and predicts the outcome of the input data. It begins with observation of data from different population and derives the pattern to make better decisions further. However, semi-supervised learning methods were found to be employed in the prediction of many real-world applications like medicine, manufacturing industry due to lack of time and cost involved in data collection.7-12 Reviews indicate that machine learning methods have been successfully used in the epidemiological study to predict the number of infections and provide a forecast to government agencies to take adequate measure and methods to control the spread of infections.13-15 Machine learning techniques like Support Vector Machine, Long-Short term memory networks, artificial neural networks have been used in various applications for better prediction.16-18 As the information on Covid-19 data are widely available which makes the supervised regression algorithm a potential machine learning tool to predict the infection numbers accurately henceforth. This paper proposes a safety movement algorithm derived from the supervised regression method based on the historic data on the number of infections recorded in the region. The algorithm would predict the number of infections at the required time intervals which can be used as a tool to employ methods to contain the virus or take adequate actions to restrict/allow the movement of people in the region. Section 2 would describe the data collection process (data from India) for the training and prediction of the supervised regression algorithm. Section 3 elaborates the methodology of the supervised regression algorithm and Section 4 demonstrates the efficiency of the developed algorithm and also compares the predicted data with Linear Regression, Logistic Regression and SVM. Section 5 concludes the paper and also provides future directions in the research area.
Data Collection
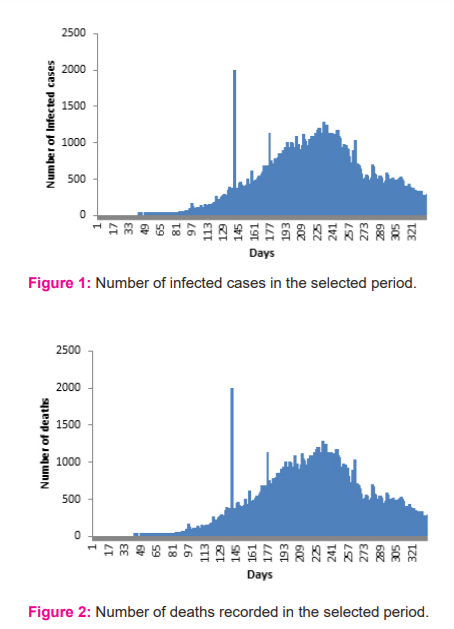
The main objective of this work is to study the future forecasting of the virus spreading based on the infected case, recovered cases and the number of deaths. The approximate data has been acquired from
https://www.who.int/dg/speeches/detail/who- director-general-s-opening-remarks-at-the-mission-briefing-on- covid-19—12-march-2020. for the period over January 2020 to December 2020. In the proposed work, the dataset for India has been taken to analyze with a supervised algorithm from January 2020 to December 2020.
Linear Regression
Linear regression is the basic form of regression in which the dependent variable is continuous and the dependent variable depends on the independent variable is linear.19 A simple linear regression model with the regression coefficient b can be expressed by
y=βo+β1x+ε (1)
Where βo and β1 are the unknown constants that define the intercept and slope respectively. Here the error ε is derived based on the assumption with zero mean and variance of σ2. Here one error is uncorrelated with another error in nature. To train any machine learning model with this linear regression model y is represented with the current data set. The main objective of this linear regression model is to find the unknown regression coefficients βo and β1 that will make the error to minimum or zero. In this paper, all the models have been compared through the Mean Square Error (MSE) which is described in section 6.
Logistic Regression
The logistic regression model for machine learning is another famous regression model which is most widely used in biological sciences. The linear regression model may not be suitable for some of the applications since it requires some threshold value to classify the data. The logistic function z can be defined as,20
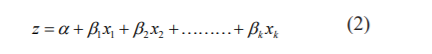
Here α and β
and β are unknown parameters and X is the independent variable of interest. This model defined logistic regression since the probability of developing the disease can be defined with X as
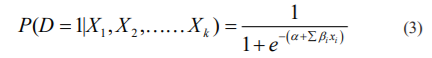
Here α and β are to be estimated for the given group of objects. Once the values α and β found then X will be determined easily for the virus spread through this logistic model.
SVM
SVM is another important machine learning algorithm that can be used for both regression and classification. This algorithm search for the optimal separating surface through its kernel functions. The main objective of this vector machine is to find the optimum function in a suitable multidimensional space that will be able to classify the training data into known classification criterion. Due to the control over the error and stability in multidimensional data, this SVM is preferred in most of the pieces of training and classifications. Here the optimum function will be obtained with a minimum cost function of,21
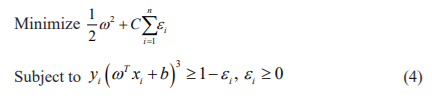
Where ωT, xi∈R2 and b∈R1, ω2= ωTω, C is the fixing parameter between the margin error and the training data. Here the parameter C is common for all the kernels. The lowest value of C will give the smooth decision surface and the high value of C will concentrate the classification of the training samples accurately.
Supervised Regression
Linear regression explained in section 3 is very much prone to outliers. Before applying the linear regression, it is mandatory to remove the anomalies from the data set. But it is not possible for the cases like virus prediction since it will possess more uncertainties. Even though logistic regression is very simple with its low dimensional data sets, on high dimensional data sets this model will compromise inaccuracy in the test. Also, this model will face some issues due to its non-linearity optimization in the decision surface. SVM depicted in section 5 is relatively fair with clear margin specification during the classification. But when the data sets are large, SVM performs poor due to the overlapping in the data sets. Among these issues, since non-linearity will be treated as an important issue, in this work it is identified that the linear regression depicted in section 3 can be modified with a suitable estimator to address the above-discussed issues. In this work, a supervised regression model with minimum variance unbiased estimation has been proposed to predict the virus spread with unknown input data. In supervised regression, it defines an algorithm that learns the pattern mapping from the input to the output. The objective of the regression is to approximate the mapping function that can predict the output for the new input with the help of trained data.
This supervised regression will train the data with well-known input in training mode and predict the optimized values as shown in Figure 3. For example, a classification algorithm will train to identify the alphabets or numbers after being trained on a particular data set of images with alphabets and numbers through some identifying characteristics. The output of the supervised regression can be linearly expressed as,22
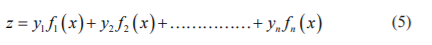
Where x=x1,x2…..xkT, f1, f2…..fn are known parameters and y1, y2……yn are the unknown parameters to be estimated. These parameters to be estimated are called regression parameters. Here the known parameters can be represented in a matrix form as (6)

Also,
z=F.y (7)
To derive the genuine value of y,
y=F-1. z (8)
For better optimization, the error will be calculated as the difference between the actual values and the predicted values with mean square formula as,

Where  are the predicted values and yi are actual values.
Based on the Mean Square Error (MSE) it is must find the dependent parameters with an optimized fit line. To minimize the error and to find the optimized fit line, Mean square estimators are used. These estimators minimize the distance between the fit line and actual outputs. Evaluate the statistical qualities of MSE equation (7) has to be investigated in a statistical framework.
The error mentioned in equation (9) will be minimized when =yi with the condition,

If the term FTF in the left side of the equation (6), is non singular, unbiased and minimum variance then

Now the Accuracy of the estimated value through this MSE can be done by
Also,

Then
From these equations, it is evident that the estimator depends on two components bias {}and variance of{} Here the tradeoff between the variance and bias will decide the rate of change of MSE. When the estimator is purely unbiased, MSE ()=Var (). Also while increasing the bias, the variance will decrease and when decreasing the bias the variance will increase. To obtain the minimum MSE through this minimum variance unbiased estimator, the known parameters in x can be obtained by gradient descent optimization as,23

Equation (15) helps us to find the optimized updates of known parameters proposed in the regression model as equation (5). The weights are initialized with zeros and ones with truncated normal distribution. The prediction has been accomplished by using supervised machine learning approaches. The data sets utilized here include the number of daily cases and deaths from December 2019 to December 2020.
Figure 3 depicts the process of the data classification and prediction with supervised regression. In the first step, the data will be collected from the authorized sites and it will be processed and classified based on the geographical area. In this paper, the prediction will be done for India based on the data from January 2020 to December 2020. Here, the prediction was done based on the relationship between the dependent variable and some independent variables.
Results and discussion
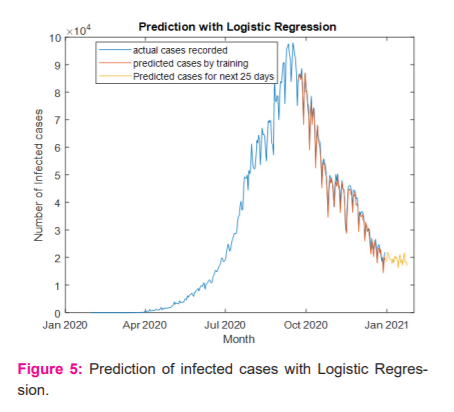
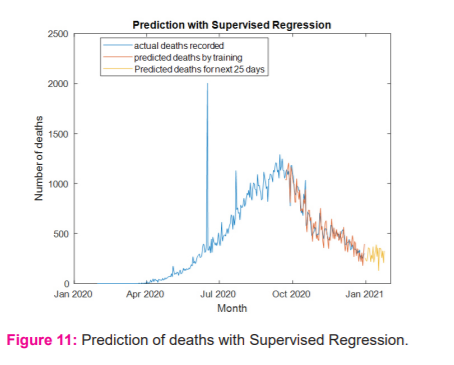
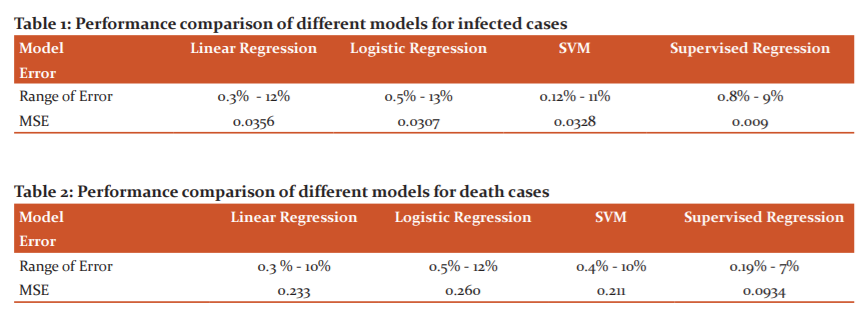
Once the data for the geographical area has been preprocessed, the data will be divided into two sets, one is a training set and another one is a tracking set. The window size of the training set is fixed as 236 days and the tracking set is 100 days. The prediction will be based on the training set with the supervised external target from tracking a set of 25 days. As mentioned in the previous section, the weights are initialized with truncated normal distribution and the batch size as 10 sets. After each batch has been processed, the bias and variance will be calculated to update the weights further which will minimize the MSE further. The pattern for infected cases and death was captured using the supervised regression model to minimize the MSE between the actual and the fit line. Based on the pattern, the MSE will be evaluated and optimized under unbiased and minimum variance conditions. Figure 4 depicts the prediction of the linear regression through curve fitting for infected cases. The ideal way to fit curves with the data using linear regression is to track the polynomial coefficients as predictors. Each transition in the data will make more bends in the line. The optimum fit line will be found with the help of MSE. When the MSE is high, the fitted line will underpredict the data points. This linear model with reciprocal coefficients will provide the best curve fitting line for optimized prediction. From the figure, it is visible that the linear regression model fails to find the optimum fit line for a huge volume of data. Figure 5 elucidates the prediction of infected cases through curve fitting optimization for logistic regression. Logistic regression can provide a better prediction when the range of uncertainties is wide. Figure 6 depicts the prediction of infected cases with SVM. From the figure, it is visible that even though SVM is more efficient with high dimensional cases but with the ambiguity in the margin separation, SVM fails to predict the cases in certain situations. Figure 7 projects the predicted cases with supervised regression for infected cases. Even though it is a modified version of linear regression, the curve fitting can be optimized through equation (10) to equation 15. To determine the optimized polynomial, the number of bends will be counted in the curve fitting and the MSE will be updated by Eqn(9). Based on the number of bends, the variance and the biasing of the estimation will be done to update the weight coefficients further. The range of error and the MSE for all the models projected in Table- 1. From Table- 1 it is evident that the proposed supervised regression with minimum variance unbiased estimator can predict the infected cases better than other models with margin MSE. Also, it is observed that SVM attempts to find the best margin that will make the crisp boundary between classes of data and risk towards the error. But due to the large volume of data set, SVM was not able to predict well when compared to the supervised regression algorithm. Figure 8,9,10 and 11 projects the prediction for the deaths with linear regression, logistic regression, SVM and supervised regression respectively. The newly confirmed cases for day by day also projected for different models. Figure 8,9,10 and 11 projects the prediction of deaths with Linear regression, Logistic Regression, SVM and Supervised regression respectively. Here the models have been trained with the available data from 30.1.2020 to 21.09.2020. The predicted death rate has been compared with the actual deaths that happened during the next 100 days. From the figures, it is visible that the supervised regression can predict reasonably when compared to the remaining algorithms. With more clarity, the range of error and the MSE for different algorithms are depicted in Table II. The number of deaths was predicted well in the supervised regression algorithm when compared to the former algorithms. MSE also marginally low in supervised regression when compared to the remaining algorithms.
Conclusion
Data availability and awareness on the number of infections in the localized region may hinder the movement of people and/or follow the safety requirement to protect them from infections. Government agencies need the information to foresee the infection rates and take suitable measures to contain the virus spread. This paper attempted to compare the predictions made by linear regression, logistic regression, support vector machine and supervised regression algorithm based on the historic data available. The algorithm was able to predict the infections rates and death count with the least error when provided with training data. The proposed supervised regression model proved that the prediction can be done for any geographical area with a suitable window, batch size and weights. Simulation results also proved that the proposed algorithm performed better when compared to the other models of machine learning. Our model has been proposed to predict the data based on the historic data alone. However, in a pandemic the infection rates and death rates can vary depending on various factors like imposing lockdown for a brief period, restricting movement of people, increased rates of testing and isolation etc in the particular region. In future, the aspects can also be incorporated into the model for a better and accurate prediction.
ACKNOWLEDGEMENT: The authors are grateful to faculty members of Amrita School of Engineering, Amrita Vishwa Vidyapeetham, Chennai.
Conflict of Interest: The authors declared that there is no conflict of interest.
Funding: No funding
Author Contributions
Conceptualization, Manikandan Arunachalam; Methodology and Validation, Manikandan Arunchalam, Palaniappan S, Neeruvai Devaiah Rohith; Writing – Manikandan Arunchalam and Shriram S; Review and editing, Sarathchandran.


References:
[1]. WHO, 2020, https://www.who.int/dg/speeches/detail/who- director-general-s-opening-remarks-at-the-mission-briefing-on- covid-19—12-march-2020
[2]. Bai Y, Yao L, Wei T, Tian F, Jin DY, Chen L, et al. Presumed Asymptomatic Carrier Transmission of Covid-19. JAMA. 2000;323(14):140.
[3]. Adithya J, Bhagyalakshmi N, Aishwarya S, Lekshmi RN. The Plausible Role of Indian Traditional Medicine in Combating Corona Virus (SARS-CoV 2): A Mini-Review. Curr Pharm Biotechnol. 2020;21:1.
[4]. Prem K, Liu Y, Russell TW, Kucharski AJ, Eggo RM, Davies N. Articles The effect of control strategies to reduce social mixing on outcomes of the COVID-19 epidemic in Wuhan, China?: a modelling study. Lancet Pub Health. 2020;5:261–9.
[5]. Lakshmi P, Suresh M. Factors influencing the epidemiological characteristics of pandemic COVID 19: A TISM approach. Int J Health Manage. 2020:1-10.
[6]. Prem K, Cook AR, Jit M. Projecting social contact matrices in 152 countries using contact surveys and demographic data. Comput Biol. 2017;13(9):1–21.
[7]. Zhang H, Yu J, Wang M, Liu Y. Semi-supervised distance metric learning based on local linear regression for data clustering. Neurocomputing. 2012;93:100–5.
[8]. Albahri AS, Hamid, RA, Alwan J, Zaidan AA, Zaidan BB, Albahri AOS, et al. Role of biological Data Mining and Machine Learning Techniques in Detecting and Diagnosing the Novel Coronavirus (COVID-19): A Systematic Review. J Med Syst. 2020;44(7):122.
[9]. Ma X, Tao Z, Wang Y, Yu H, Wang Y. Long short-term memory neural network for traffic speed prediction using remote microwave sensor data. Transp Res Part C Emerg Technol. 2015;54:187–10.
[10]. Mohamadou Y, Halidou A, Tiam P. A review of mathematical modeling, artificial intelligence and datasets used in the study, prediction and management of COVID-19. Appl Intell. 2020;50:3913-12.
[11]. Tian Y, Pan L. Predicting Short-term Traffic Flow by Long Short-Term Memory Recurrent Neural Network. IEEE International Conference on Smart City/SocialCom/SustainCom (SmartCity); 2015 Dec 19-21; Chengdu, China. IEEE; 2015:153-5.
[12]. Yeganeh B, Sha M, Rashidi Y, Kamalan H. Prediction of CO concentrations based on a hybrid Partial Least Square and Support Vector Machine model. Atmos Environ 2017;55:357–8.
[13]. Agbehadji IE, Awuzie BO, Ngowi AB, Millham RC. Review of Big Data analytics, Artificial Intelligence and Nature-Inspired Computing Models towards Accurate Detection of COVID-19 Pandemic Cases and Contact Tracing. Int J Environ Res Public Health 2010;17(15):1–16.
[14]. Lalmuanawma S, Hussain J, Chhakchhuak L. Applications of Machine Learning and Artificial Intelligence for Covid-19 (SARS-CoV-2) pandemic: A review. Chaos Solitons Fract. 2020;139:110059.
[15]. Vaishya R, Javaid M, Haleem I, Haleem A. Artificial Intelligence (AI) applications for COVID-19 pandemic. Diabetes Metab Syndr. 2020;14:337–2.
[16]. Snyder Z, Rogers CE, Inder TE, Schlaggar B, Neil JJ. Prediction of Brain Maturity in Infants Using Machine-Learning Algorithms. NeuroImage. 2016;136:1-9.
[17]. Fischer T, Krauss C. Deep learning with long short-term memory networks for financial market predictions. Eur J Oper Res. 2018;270(2):654–15.
[18]. Voyant C, Darras C, Muselli M, Paoli C, Nivet M, Poggi P. Bayesian rules and stochastic models for high accuracy prediction of solar radiation. Appl Energy 2014;114:218–8.
[19]. Montgomery DC, Elizabeth AP, Geoffrey V. Introduction to linear regression analysis. 5th ed. Canada: John Wiley & Sons; 2012.
[20]. Kleinbaum DG, Dietz K, Gail M, Klein M, Logistic regression. New York:Springer-Verlag; 2002.
[21]. Khan RA, Naseer N, Muhammad JK. Drowsiness detection during a driving task using fNIRS. Neuroergonomics 2019:79-86.
[22]. Jang J-S, Chuen TS, Mizutani E. Neuro-fuzzy and soft computing-a computational approach to learning and machine intelligence. New Jersey:Printice Hall. 1997:1482-92.
[23]. Shanthi KG, Manikandan A. An Improved Adaptive Modulation and Coding for Cross Layer Design in Wireless Networks. Wirel Pers Commun 2019;108(2):1009-11.
|
 IJCRR
IJCRR 


 This work is licensed under a Creative Commons Attribution-NonCommercial 4.0 International License


