IJCRR - 13(11), June, 2021
Pages: 59-64
Date of Publication: 04-Jun-2021
Print Article
Download XML Download PDF
Understanding the Time Dependent Transmissibility of COVID-19 Through Its Effective Reproduction Number (Rt)
Author: See Jie, Rajasvaran Logeswaran
Category: Healthcare
Abstract:Background: Over six centuries ago, the most fatal pandemic ever recorded in human history, the Black Death (The Plague), emerged with an estimated death toll of 75-200 million. At present, COVID-19 has surfaced causing over 5 million infected and 340 thousand deaths worldwide, with the numbers still rising. Objective: This paper focuses on the significance of the effective reproduction number (Rt ) in the epidemiology of SARS-CoV-2, to understand the time-dependent transmission pattern of this virus after intervention measures such as city lockdowns and social distancing. Studies done by various parties on estimating the Rt for different countries are discussed and interpreted. Results: It is found that all the countries studied still show an Rt of greater than 1, indicating that the COVID-19 outbreak is still ongoing. However, some countries are gradually keeping COVID-19 under control with a decreasing Rt after implementing intervention measures. Conclusion: COVID-19 is still spreading rapidly across the entire globe, and the soonest production of vaccines is expected to be early 2021, but it is estimated that it will take up to five years to be developed.
Keywords: COVID-19, SAR-Cov-2, Effective Reproduction Number, Time-Dependent Transmissibility
Full Text:
INTRODUCTION
It was not long ago when the World Health Organization (WHO) declared the Coronavirus Diseases 2019 (COVID-19) outbreak a pandemic, and as of 23rd May 2020, there have been 5,346,876 confirmed cases and 340,869 deaths worldwide, covering 213 countries and territories.1 Firstly emerged as an epidemic on the 31st of December 2019 in Wuhan, Hubei Province in China, several Chinese scientists isolated and sequenced the genome of the virus.2 The virus was tentatively named by the WHO as the 2019 novel coronavirus (2019-nCoV) and later identified as the Severe Acute Respiratory Syndrome Coronavirus 2 (SARS-CoV-2), causing the Coronavirus Disease 2019 (COVID-19). According to the COVID-19 can affect certain groups which include the older populations and individuals who suffer from underlying health conditions that COVID-19 hypothetically induces mild symptoms to other respiratory infections that exhibited an ability to generate severe diseases towards the affected group.3
It was further explained that a clear understanding of the epidemiology of the virus was still being elucidated and the estimation of basic reproduction number (R0 ) as well as effective reproduction number (Rt ) was vital.
Basic Reproduction Number (R0)
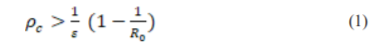
In epidemiology, it is essential to estimate the actual or possible outbreaks of a particular disease, such as the Human Immunodeficiency Virus (HIV),4 Severe Acute Respiratory Syndrome (SARS),5 Tuberculosis (TB),6 and the recent Coronavirus Disease 2019 (COVID-19). The estimation of the possible outbreak during the start of an epidemic is usually represented by a parameter called Basic Reproduction Number (R0 ), which is widely used in assessing the transmissibility of pathogens as well as estimating the severity of the outbreak. R0 is defined as the expected number of secondary cases directly generated by one case in a population, whereby all individuals are susceptible to infection without any deliberate intervention in disease transmission.7 R0>1 indicates the outbreak of a disease, whereas R0 <1 means that the pathogen will eventually disappear. Although R0 does not explain the speed of spread after intervention controls such as social distancing and vaccination have been implemented, it is directly related to the type and intensity of interventions needed during the early stage of an outbreak. Upon successful development of the vaccine, R0 can be used to determine the critical coverage of immunization required to eradicate the disease. The critical vaccination coverage  can be estimated through Eq. (1), where
  is the direct effect of vaccination.8
suggests the proportion of susceptible individuals be vaccinated, and the protection conferred to the population achieving the coverage is known as herd community.9
Effective Reproduction Number (Rt)
Although R0 is essential to understand the transmissibility of a disease and interventions strategies needed, it is estimated based on assumptions that the population is fully susceptible, which only happens during the beginning of an outbreak. During an outbreak, it is important to evaluate the time-dependent transmission potential of an infectious disease. This is estimated by calculating the Effective Reproduction Number (Rt ), i.e. the actual average number of secondary cases per primary case at time t , for t>010 Rt is commonly used to characterize pathogen transmissibility during an epidemic due to its time and situation specificity,11 that takes into account the decline in susceptible individuals (intrinsic factor) and control measures implementation (extrinsic factor).12 Rt < 1 suggests that the disease outbreak has been brought under control at time t, whereas Rt>1 indicates that the outbreak is still ongoing. To bring an epidemic under control, the monitoring of Rt overtime provides feedback on the effectiveness of interventions and the importance to further intensify control efforts,13,14 given that the goal of intervention effort is to being Rt below the threshold value of 1 and subsequently close to 0 as soon as possible.
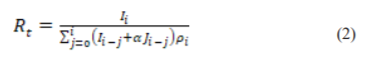
Estimation of Rt for COVID-19
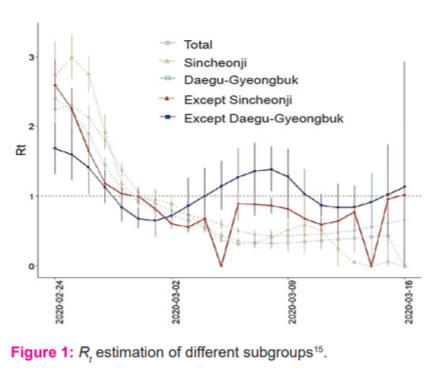
The study in15 carried out R0 and Rt estimations in South Korea, but the cases are split into: total, Sincheonji, except Sincheonji, Daegu-Gyeonbuk and except-Daegu-Gyeonbuk subgroups, to thoroughly understand the transmission patterns of major cluster cases in South Korea. The exponential growth model16 was first fitted on the R0 values, followed by sensitivity analysis done on the exponential growth period. Due to the unknown generation time (GT) of COVID-19 at the time of the study, the serial interval was modelled using gamma distribution with mean ± standard deviation of 2.0 ± 1.0, 3.0 ± 1.5, 4.0 ± 2.0, 5.0 ± 2.5, and 6.0 ± 3.0 days, obtained by referring to the incubation period of two to 14 days. An initial R0 for total cases was estimated to be around 3.4. However, the outcome of the sensitivity test suggests that the R0 value is highly sensitive to the GT of COVID-19, hence the estimated R0 might not be reliable as the GT used was just based on assumptions. After the Sincheonji mass infection incident, the health authorities of Korea implemented a series of intervention procedures, including active COVID-19 testing, isolation, social distancing, school closures and active surveillance. By applying the same method, the Rt was estimated and the result is illustrated in Figure 1. Although the Rt of total cases show a downward trend, both “Except Sincheonji” and “Except Daegu-Gyeongbuk” clusters were still fluctuating, suggesting the possibility of another mass infection if not dealt with carefully. Nonetheless, thanks to the intervention approach, Rt of most of the cluster groups gradually decreased. However, the estimated Rt maybe different from the actual Rt due to the unknown GT, Figure 1.
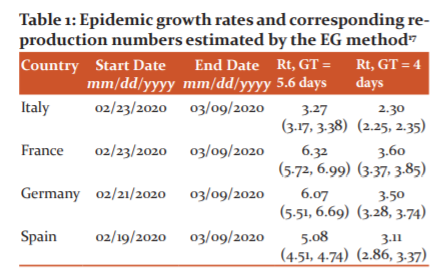
The exponential growth rate (EG) and time-dependent (TD) methods were employed using local transmission cases observed in Germany, France, Italy and Spain from 20th February 2020 to 9th March 2020.17 Under the EG method, the exponential growth stage of the outbreak is first fitted using a Poisson regression model, under the assumption that the GT of COVID-19 follows a gamma distribution.18 The Rt is then calculated through the transformation of the EG rate. Through the TD method, Rt is computed by averaging the overall transmission networks that are compatible with the observed epidemic curve.18 The TD method takes into account the yet-unrecorded cases because it uses a Bayesian statistical framework. Both EG and TD methods are highly dependent on the value of the GT, measured by the onset time lag between primary and secondary causes. As this is difficult to obtain, GT is assumed to be equal to the incubation period of 5.8 days with a standard deviation of 2.6 days.20 Sensitivity analysis is then carried out using an incubation period of 4 days with a standard deviation of 2.4 days.21 From the results in Table 1 for the different models up until 9th March 2020, the Rt in all four countries were greater than two, indicating the progression of the COVID-19 outbreak. Stricter control measures are needed in these countries, especially France, Germany and Spain, to bring the pandemic under control. Besides that, lockdown measures had just been implemented in Italy and therefore Rt should be constantly monitored to understand the effectiveness of the measure.
Some limitations of this study include that the models are highly dependent on the GT of COVID-19, which is relatively difficult to estimate. Further, the reported cases may be lower than the actual cases, which can affect the accuracy of the study. Despite the limitations, this study provides important findings of the transmissibility of COVID-19 in the four countries. The European Centre for Disease Prevention and Control (ECDC) should work closely with these countries, Table 1.
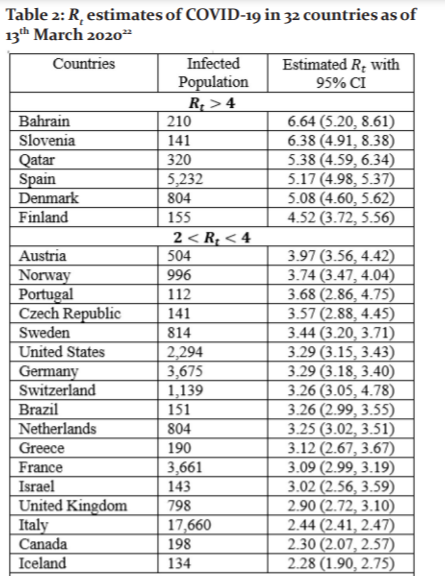
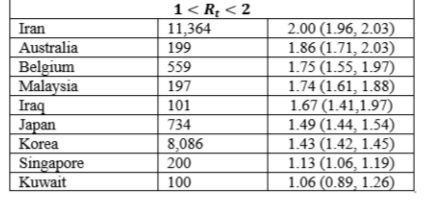
In the Rt of COVID-19 for 32 countries outside of China with over 100 reported cases by 13th March 2020 were computed by applying the EG method [16]. Data on the daily reported new COVID-19 cases in these countries were used, alongside with assumption of mean serial interval of 4.7 days and standard deviation of 2.9 days.22, 23 Of these 32 countries, United States (2,294), France (3,671), Germany (3,675), Spain (5,232), Korea (8,086), Iran (11,364) and Italy (17,660) had more than 1,000 reported COVID-19 cases. Bahrain, Slovenia, Qatar, Spain, Denmark and Finland had Rt greater than four. The estimated Rt of all 32 countries as of 13th March 2020 are shown in Table 2. The Rt should be constantly monitored like some of the countries with relatively low Rt (<4) have been reported to have a drastic increase of COVID-19 cases in the span of two months (from March to May). By 13th May 2020, the country with the highest number of reported cases (1,408,636) in the world was the United States, with a Rt of 3.29. One of the reasons for the significant increase might be the lack of awareness of both the government and citizens, Table 2.
By using the daily reported cases, as released by the Korea Centers for Disease Control and Prevention (KCDC) including locally transmitted and imported cases of COVID-19 in South Korea from 20th January to 26th February 2020. 24 estimated the Rt in Korea. To estimate the growth rate of the pandemic, it is crucial to identify the epidemic curve according to the dates of symptoms onset rather than the dates of reporting. However, the symptoms onset dates were only available for the first 28 imported cases. To handle this problem, symptoms onset dates were imputed by constructing 300 epidemic curves by dates of symptoms onset and obtaining a mean incidence curve after dropping the last three data points to adjust for reporting delays. By using the generalized growth model (GGM) to characterize the incidence curves for local and imported cases.25 This model describes the growth profile with the help of growth rate parameter (r) and scaling of growth rate parameter (p), where the GT “is assumed to follow a gamma distribution with a mean of 4.41 days and standard deviation of 3.17 days.25,26 The discretized probability distribution (ρi) of the generation interval is then simulated from the GCM and applied on:
where, Ij is the local incidence at the time tj , Jis the local incidence at the time tiand “1<α<1 quantifies the relative contribution of imported cases to secondary disease transmission.12 Finally, the Rt is estimated “for 300 simulated curves assuming a Poisson error structure to derive the uncertainty bounds around the Rt curve”.27 The Rt was estimated to be 1.5 with 95% Confidence Interval (CI) of (1.4, 1.6) as of 26th February 2020, and the estimates indicate a sustained transmission of COVID-19 in Korea. This finding is lower compared to the Rtt estimated,15 which gave a Rt for total cases of more than 2 as of 26th February 2020.
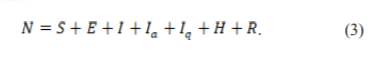
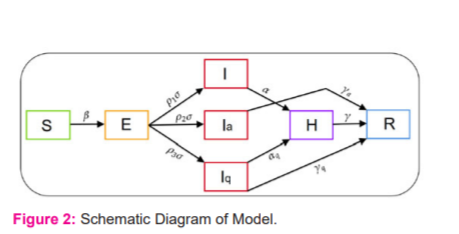
The impact of the intervention on the spread of COVID-19 in India was studied in 28 by applying a compartmental model that separated the total human population (N ) into susceptible (S), exposed (E), symptomatic (I), asymptomatic (Ia, quarantined (Iq), hospitalized (H) and recovered (R), hence:
After close contacts with symptomatic or asymptomatic individuals, the susceptible population will become exposed. It is assumed that the symptomatic individuals have a higher transmission rate than asymptomatic individuals and the rate of a new infection is given by Eq. (4), where β is the transmission rate of the disease and n (<1) is the modification parameter for the reduction in the transmission rate from asymptomatic individuals:
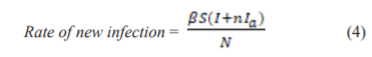
Of all exposed individuals, p1 the fraction will be symptomatic, p2 fraction will be asymptomatic, whereas p3=1-p1-p2 will be quarantined. Symptomatic individuals will show severe symptoms after α-1 time and will be hospitalized. On the other hand, asymptomatic individuals will naturally recover at a rate of rα . Quarantined individuals will either naturally recover at a rate of rq or become infected and hospitalized at a rate of aq. Finally, hospitalized individuals will either recover at a rate r , or die at a rate of δ . The full transmission dynamics of this COVID-19 disease is illustrated in Figure 2.
The daily new infection curve of reported COVID-19 cases is then used to estimate Rt by applying the following formula, which is derived from the renewal equation of the birth process:
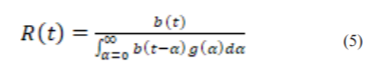
where, b(t) is the number of new cases on day t, and g(t) is the generation interval distribution for COVID-19. However, one drawback of the model is that it only assumes asymptomatic individuals to recover naturally and have neglected the fact that there are possibilities for asymptomatic individuals to start showing symptoms and will be quarantined, hospitalized or die from the disease. This is supported by29, were out of the 13 residents of the Long Term Care Nursing Facility, Washington who were asymptomatically infected, 10 started developing symptoms after seven days.28, 29
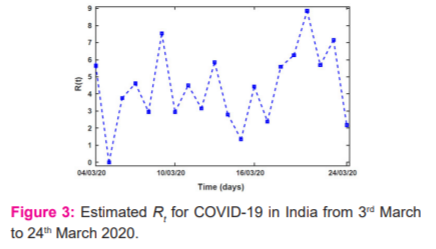
The estimated Rt of COVID-19 outbreak in India from 2nd March to 24th March 2020 is shown in Figure 3. Due to zero newly reported cases on 6th March 2020, Rt of zero is observed. A high Rt of 7.54 and 8.86 are also observed on the 6th and 17th days due to the exceptionally high reported cases those two days. Further projected the estimated COVID-19 cases in India until September by taking into account intervention methods such as lockdown, awareness programs, proper hand sanitization, etc 28. It is observed that the stronger the intervention, the sooner the pandemic will be brought under control, Figure 3.
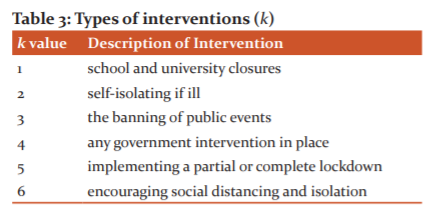
A semi-mechanistic Bayesian hierarchical model was used in 30 to infer the impact of interventions across 11 countries in Europe, under the assumption that the changes in Rt are an immediate response to the effectiveness of interventions. To take into account the time lag between infection and death, the model estimates the changes in Rt by computing backwards from the deaths observed over time to estimate the transmissions that happened a few weeks prior. Besides, it is assumed that each type of intervention method will have the same effect on Rt overall countries, indicating that the results are strongly affected by the timing of intervention. In the infection model, the true number of infected individuals, c, is modelled using the widely used discrete renewal process.11, 31 The serial interval distribution was modelled using gamma distribution of g~Gamma(6.5, 0.62) , which is the time between when a person gets infected and the person infecting a second person.30,31 The serial interval is assumed to be the same for all countries. A piecewise constant function that scales Rt,m from a baseline prior R0,m and is driven by six different interventions, is k , detailed as in Table 3.
The indicator variable for intervention is denoted by Ik,t,m , which will be one if intervention k has been implemented in country m at time t
 , and 0 otherwise. The Rt in-country m at time t is then computed by Eq. (6), where α
 is a parameter used to characterize Rt,m with a chosen independent prior distributions of αk~Gamma (0.5, 1) :
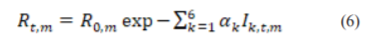
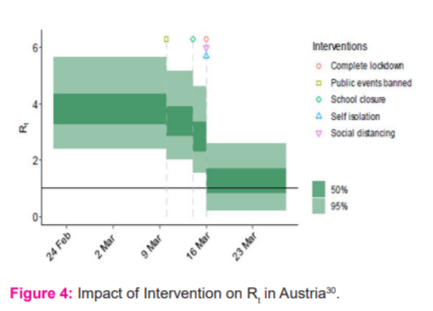
The R0,m is chosen to be R0~Normal(2.4, k), where k~Normal (0, 0.5) . Computed Rt for all 11 countries is then plotted, alongside the timeline of different intervention measures, giving a clear visualization of the impact of intervention methods. An example of the impact of intervention on Rt in Austria is illustrated in Figure 4. After undergoing sensitivity analysis, it is concluded that the choices of prior distribution do not affect the results from the main analysis. From Figure 4, it is apparent that Rt in Austria drops each time an intervention measure is implemented.32 On 16th March 2020, the Rt dropped drastically due to the implementation of 3 interventions on the same day, Figure 4.
CONCLUSIONS
COVID-19 is still spreading rapidly across the entire globe, and the soonest production of vaccines is expected to be early 2021, but it is estimated that it will take up to five years to be developed. It is important to continue monitoring the Rt for different countries to completely understand the effect of the interventions and the potential need for other control measures. Based on the studies done in different countries to estimate Rt , there is no doubt that intervention measures such as social distancing can be carried out and is essential to keep the outbreak under control. Apart from that, by estimating the time to time Rt, countries that have successfully brought the spread of COVID-19 under control will be able to identify what interventions are the most effective, which can be used as a benchmark for other countries that are currently battling the disease. Once the vaccines are developed, it can also be identified by how fast the vaccine brings Rt to below one.
Acknowledgements
The authors also wish to express gratitude to the management of Asia Pacific University of Technology & Innovation (APU) for their support.
Conflict of Interest
The authors involved in the current study does not declare any competing conflict of interest.
Funding and Sponsorship
References:
|
WHO. Coronavirus disease (COVID-2019) situation reports," 2020. [Online]. Available: https://www.who.int/emergencies/diseases/novel-coronavirus-2019/situation-reports. [Accessed 18 May 2020].
|
|
Cohen J. Chinese researchers reveal the draft genome of the virus implicated in Wuhan pneumonia outbreak. Science Mag. 2020;11.
|
|
Adler SE. Why coronaviruses hit older adults hardest, 2020. [Online]. Available: https://www.aarp.org/health/conditions-treatments/info-2020/coronavirus-severe-seniors.html. [Accessed 19 May 2020].
|
|
Velasco-Hernandez JX, Gershengorn HB, Blower SM. Could widespread use of combination antiretroviral therapy eradicate HIV epidemics? Lancet Inf Dis. 2002;2(8):487-493.
|
|
Lipsitch M, Cohen T, Cooper B, Robins JM, Ma S, James L, et al. Transmission dynamics and control of severe acute respiratory syndrome. Science 2003;300(5627):1966-70.
|
|
Blower SM, Chou T. Modeling the emergence of the'hot zones': tuberculosis and the amplification dynamics of drug resistance. Nat Med. 2004;10(10):1111-6.
|
|
Fraser C, Donnelly CA, Cauchemez S, Hanage WP, Van Kerkhove MD, Hollingsworth TD, et al. Pandemic potential of a strain of influenza A (H1N1): early findings. Science 2009;324(5934):1557-61.
|
|
Halloran ME, Haber M, Longini Jr IM, Struchiner CJ. Direct and indirect effects in vaccine efficacy and effectiveness. Am J Epidemiol 1991;133(4):323-31.
|
|
Fine PE. Herd immunity: history, theory, practice. Epid Rev 1993;15(2):265-302.
|
|
Cauchemez S, Boëlle PY, Thomas G, Valleron AJ. Estimating in real-time the efficacy of measures to control emerging communicable diseases. Am J Epidemiol 2006;164(6):591-7.
|
|
Cori A, Ferguson NM, Fraser C, Cauchemez S. A new framework and software to estimate time-varying reproduction numbers during epidemics. Am J Epidemiol 2013;178(9):1505-15012.
|
|
Nishiura H, Chowell G. The effective reproduction number as a prelude to the statistical estimation of time-dependent epidemic trends. InMathematical and statistical estimation approaches in epidemiology 2009; 103-12.
|
|
Anderson RM, Anderson B, May RM. Infectious diseases of humans: dynamics and control. Oxford university press; 1992 Aug 27.
|
|
Ferguson NM, Cummings DA, Fraser C, Cajka JC, Cooley PC, Burke DS. Strategies for mitigating an influenza pandemic. Nature. 2006;442(7101):448-452.
|
|
Hwang J, Park H, Jung J, Kim SH, Kim N. Basic and effective reproduction numbers of COVID-19 cases in South Korea excluding Sincheonji cases. MedRxiv. 2020;11(4): 467-469.
|
|
Wallinga J, Lipsitch M. How generation intervals shape the relationship between growth rates and reproductive numbers. Proceedings of the Royal Society B: Bio Sci. 2007;274(1609):599-604.
|
|
Yuan J, Li M, Lv G, Lu ZK. Monitoring transmissibility and mortality of COVID-19 in Europe. Int J Inf Dis 2020; 95: 311–315.
|
|
Wallinga J, Teunis P. Different epidemic curves for severe acute respiratory syndrome reveal similar impacts of control measures. Am J Epidemiol 2004;160(6):509-16.
|
|
Liu Y, Gayle AA, Wilder-Smith A, Rocklöv J. The reproductive number of COVID-19 is higher compared to SARS coronavirus. J Travel Med 2020;13(3):56-60.
|
|
Linton NM, Kobayashi T, Yang Y, Hayashi K, Akhmetzhanov AR, Jung SM, et al. Incubation period and other epidemiological characteristics of 2019 novel coronavirus infections with right truncation: a statistical analysis of publicly available case data. J Clin Med. 2020;9(2):538.
|
|
Guan WJ, Ni ZY, Hu Y, Liang WH, Ou CQ, He JX, et al. Clinical characteristics of coronavirus disease 2019 in China. New Eng J Med. 2020;382(18):1708-1720.
|
|
Kwok KO, Lai F, Wei WI, Wong SY, Tang JW. Herd immunity–estimating the level required to halt the COVID-19 epidemics in affected countries. J Infect 2020;80(6):e32-33.
|
|
Nishiura H, Linton NM, Akhmetzhanov AR. Serial interval of novel coronavirus (COVID-19) infections. Int J Inf Dis 2020;13(4):983-986.
|
|
Shim E, Tariq A, Choi W, Lee Y, Chowell G. Transmission potential and severity of COVID-19 in South Korea. Int J Inf Dis 2020; 18(3):1421-1425.
|
|
Viboud C, Simonsen L, Chowell G. A generalized-growth model to characterize the early ascending phase of infectious disease outbreaks. Epidemiology 2016;15:27-37.
|
|
You C, Deng Y, Hu W, Sun J, Lin Q, Zhou F, Pang CH, Zhang Y, Chen Z, Zhou XH. Estimation of the time-varying reproduction number of COVID-19 outbreak in China. Int J Hyg Envt Health 2020:113555.
|
|
Chowell G. Fitting dynamic models to epidemic outbreaks with quantified uncertainty: A primer for parameter uncertainty, identifiability, and forecasts. Infect Dis Mod. 2017;2(3):379-98.
|
|
Senapati A, Rana S, Das T, Chattopadhyay J. Impact of intervention on the spread of COVID-19 in India: A model based study. arXiv preprint arXiv:2004.04950. 2020 Apr 10.
|
|
Kimball A, Hatfield KM, Arons M, James A, Taylor J, Spicer K, et al. Asymptomatic and presymptomatic SARS-CoV-2 infections in residents of a long-term care skilled nursing facility—King County, Washington, March 2020. Morbidity and Mortality Weekly Report. 2020 Apr 3;69(13):377.
|
|
Flaxman S, Mishra S, Gandy A, Unwin HJ, Coupland H, Mellan TA, et al. Estimating the number of infections and the impact of non-pharmaceutical interventions on COVID-19 in European countries: technical description update. arXiv preprint arXiv:2004.11342. 2020 Apr 23.
|
|
Fraser C. Estimating individual and household reproduction numbers in an emerging epidemic. PloS One. 2007;2(8):e758.
|
|
Le TT, Andreadakis Z, Kumar A, Roman RG, Tollefsen S, Saville M, et al. The COVID-19 vaccine development landscape. Nat Rev Drug Discov. 2020 Apr 9;19(5):305-6.
|
 IJCRR
IJCRR 


 This work is licensed under a Creative Commons Attribution-NonCommercial 4.0 International License


