IJCRR - 13(10), May, 2021
Pages: 155-160
Date of Publication: 19-May-2021
Print Article
Download XML Download PDF
Analysis of Electro-Mechanical Window of Heart in The Healthy Young Adults of Bengal
Author: Suranjana Sur Mukherjee, Sharmishtha Ghoshal, Aditya Chowdhury
Category: Healthcare
Abstract:Background: Measurement of Systolic Time Intervals (STIs) is a non-invasive and convenient way of assessing left ventricular electro-mechanical activity in health and disease. In this study, we assessed some of the parameters of STIs in a group of healthy young adults from the first-year students of a government medical college in West Bengal, India. Objectives: To assess QT, QS2 and their ratio and compare them between the girls and boys and to create a regional database in comparison to the international values. Methods: IX-TA-220 multichannel recorder was used to record Electrocardiogram (ECG), Heart sound (Phonocardiogram) and Carotid pulse tracing in lying down position at noon and in the postabsorptive stage after the last meal. Results: Mean values of the proposed parameters were analysed by Microsoft Excel software and compared between the boys and girls and also with available international reference values. QS2-Index (QS2-I) was calculated using Wandermann equation6. There were significant differences in the mean values of QT, QS2-I and QT/QS2 between the two sexes. Also, the observed values of QS2-I were slightly longer than international standards. Conclusion: Observed deviation in the duration of systolic intervals from the available international data might be due to geographical and genetic differences. The difference was observed even between the two sexes. Hence the diagnosis of probable cardiac complications should be done based on regional as well as age & sex-specific references.
Keywords: Systolic Time Intervals (STIs), QT, QS2, QT/QS2, QS2-I
Full Text:
BACKGROUND
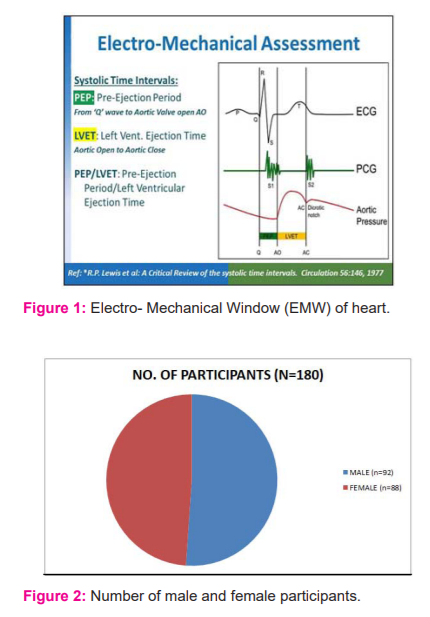
Electro-Mechanical Window (EMW) is the temporal difference between electrical and mechanical events in the beating heart. Time intervals that indicate systolic cardiac functions are together known as Systolic Time Intervals (STI). It has been suggested that these intervals can be useful parameters to assess the contractile state of the LV myocardium.1-3 The intervals are measured in milliseconds (ms).
Major components of STIs are QT, QS2, LVET and PEP [Fig.1].
QT = Electrical systole as per electrocardiogram; the interval between the beginning of Q wave (septal depolarization) to the end of T wave (ventricular repolarisation)
QS2 = Electromechanical systole = the interval between the beginning of Q wave of ECG to the appearance of the first high-frequency vibration of S2 i.e closure of Aortic valves. It represents the electrical plus mechanical activity of the entire period of systole which includes: Electro-mechanical Lag (EML), QS1, Isovolumetric Contraction Time (ICT) and LVET.
LVET = Left Ventricular Ejection Time = appearance of carotid pulse to dicrotic notch on pulse transducer recording
PEP = Pre-Ejection Period = (QS2 - LVET). It is the interval from the onset of ventricular depolarization to the beginning of the left ventricular ejection.
PEP/LVET - most sensitive index of ventricular function - normally about 0.35
QT/QS2 - Electrical systole/Electro-Mechanical systole - a useful pro-arrhythmic biomarker. In this study, we have measured three parameters viz. QT, QS2 and ratio of QT & QS2 in 180 healthy First Professional MBBS students of both sexes in a government medical college of West Bengal.
In the present study we aimed to determine the mean value of QT, QS2, QS2I and the value of QT/QS2 in sympathetically naive healthy young adults under identical environmental and metabolic conditions. We have also decided prepare a database of these STI parameters in healthy young populations of West Bengal which can be used as a future reference for subsequent research in this region.
MATERIALS AND METHOD
An analytical clinical study of the cross-sectional design was done in the department of physiology of a tertiary care hospital from 20th March 2019 to 15th February 2020. 180 1st year MBBS students aged between 17 to 19 years of both sexes participated voluntarily after being fully explained about the procedure. Criteria for inclusion were: a) body weight in the range of 50-65 kg and b) height in the range of 150cm to 175 cm. Students falling beyond the two extremes were not included in the study to remove compounding factors that might affect the autonomic nervous system. Students with a history of hypertension, congenital or acquired cardiovascular diseases, respiratory and renal diseases which might affect cardiac parameters were excluded from the study. The recording was scheduled at noon every day and 3 hours after breakfast. The institutional ethical clearance was duly obtained before starting the research [copy attached]. For the recording of STIs, we used IX-TA-220
Recorder which is a multichannel recorder of which the following three channels were used for the purpose:
1. Electrocardiograph: iwire - B3G Bipotential module with A-GC-7165 electrodes to record electrical activities of heart
2. Phonocardiograph: a microphone HSM-220 to transduce heart sound to the electrical signal
3. Carotid Pulse transducer: PT-104 to pick up the pulse wave from the carotid artery. Subjects were allowed to lie down comfortably on a bed. ECG electrodes were placed in such a manner on the subject that Lead II is recorded where a definite 'q' wave is formed. The microphone (phonocardiograph) was placed on the Pulmonary Area of the chest to record the second heart sound (S2). The pulse transducer was placed on the neck over the carotid pulse to record the left ventricular ejection during ventricular systole.
After a short pre-run, the recording was done for about 30 seconds. For calculation of the STIs, good polygraph tracings of at least 10 cardiac cycles were chosen. Variables for analysis were QT interval, QS2 interval and QT/QS2. Duration of QT and QS2 intervals were automatically produced by Kubios software after manually marking the q wave on ECG and dicrotic notch on the pulse tracing. The obtained data were compiled on Microsoft excel and compared between the two sexes. p values were calculated by Student's T-test using SPSS software at <0.05 significance level.
RESULTS
Observations are represented in the form of tables and figures as follows:
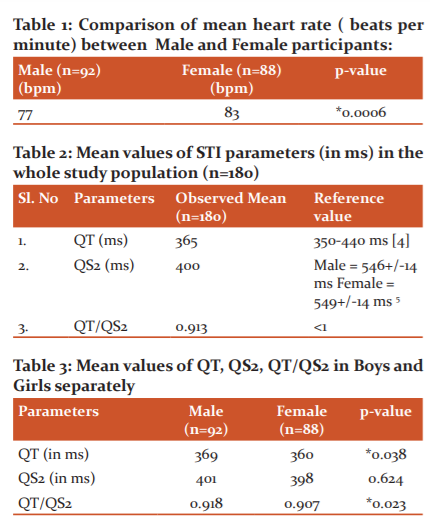
i) 92 boys and 88 girls participated in the study and there was no significant difference in the selection of participants according to sex [Figure 2].
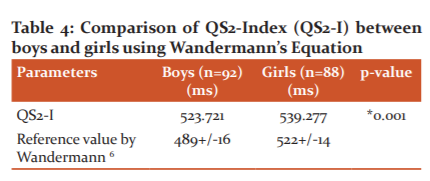
ii) There was a significant difference (p=0.0006) in the resting heart rate between the two sexes; mean HR in the females was 83/min whereas mean HR in males were 77/min [Table 1]. Table 1 indicated that the Mean Heart Rate was significantly higher in the female population.
iii) Mean QT of 180 participants was 365 ms and well within the normal range of 350-440 ms4 [Table 2]. Table 2 observed that Mean QT was within the normal range as given by Burns [4] but the mean QS2 was less than the available data which was calculated as per Weissler's regression eqn.5
iv) Mean QS2 of 180 participants was 400 ms and less than the available reference value for both male (546+/-14 ms) and female (549+/-14 ms)5 [Table 2].
v) Mean QT/QS2 was 0.913 which should be <1 under resting condition and hence normal [Table 2].
vi) Mean QT of the male participants was 369 ms and was significantly longer (p=0.038) than that of females whose mean QT was 360 ms [Table 3]. Table 3 observed that Mean QT was significantly longer and QT/QS2 ratio was significantly higher in the male population.
vii) Mean QS2 of the male participants was 401 ms and mean QS2 of females was 398 ms and there was no significant difference between the sexes (p=0.624) [Table 3].
viii) QT/QS2 was 0.918 for males and 0.907 for females with a significant difference (p=0.023) between the two sexes [Table 3].
ix) QS2-index (QS2-I) was calculated separately for male and female participants using Wandermann's6 equation; the values were 523.721ms and 539.277ms for male and female respectively with a highly significant difference between the two sexes (*p=0.001) and in both sexes, our observed values were longer than the upper bound of the proposed QS2-I by Wandermann.6 Table 4 observed that QS2-I was significantly different between the male and female population but in both the population it was higher than the upper limit of the reference value.6
DISCUSSION
The determination of STIs offers a convenient, non-invasive method to study left ventricular performance which was first appreciated by Weissler Peeler & Roehll in the year 1961 7. The STI are unique among the cardiac function tests because time is the only variable here and multiple observations can be obtained in one recording.1 The following factors influence the value of STIs which should be taken care of while analysing the observations:
1. Age: The STIs steadily increase in duration from infancy to puberty and all are slightly prolonged in the elderly.8,9 When compared with adult values QS2 was shorter in children at all the heart rates.6,10 There is a distinct tendency towards lengthening of all STIs with increasing age, independent of changes in heart rate 6,10. Alterations in systolic phase duration occurring with maturation reflect the normal functional adaptation of the developing heart.11 It has been found that STIs seem to lengthen with age especially in the elderly with longer QS2.12 Various regression equations have been derived for each age group after studying healthy subjects of both sexes in the supine position.
2. Diurnal variation & food intake: A diurnal drop in QS2 occurs in normal subjects.13 This effect appears to reach its maximum between 4-8 pm and averages 10 ms for QS2.10 It is for this reason, as a standard procedure, the measurements should be made at the same time of the day preferably between 8-10 am14; but due to logistic problems, we chose the time at noon which is also a post-absorptive state after breakfast at around 8.30 or 9 am as food intake has a positive inotropic effect (lowers QS2) and positive chronotropic effect (increases HR).
There are mainly four determinants of STIs; they are heart rate (HR), Preload, afterload and myocardial inotropic state.10 The sympathetic system increases the discharge of SAN and increases the contractility, conductivity and force of contraction of the myocardium and thus increasing the HR, preload and afterload. So, the sympathetic nervous system has the most important effect on the STIs which is why we have chosen these young subjects who have attained adulthood in recent times and whose sympathetic systems are not yet challenged by life's journey.
3. Effect of heart rate on STIs: It has long been appreciated that the systolic phases of the cardiac cycle vary inversely with heart rate 1. Thus, for deviations of STI to be properly interpreted, corrections must be made for variations related to differences in heart rates.1 Regression equations of different age groups are used to derive the STI indices for group.10 The regression equations of Weissler15 is calculated from the STI recorded in the largest population of normal subjects with a wide range of resting heart rate and have generally been adopted.
Notably, the STI indices for males and females differ slightly.15 Here the mean HR at the resting condition was 77 beats per min in boys and 83 beats per min in girls which were statistically significant [Table 1]. Accordingly, we also observed significantly different mean values of QT, QS2-I and QT/QS2 for girls & boys [Table 3,4].
The QT interval is measured from the start of the Q wave to the end of the T wave effectively representing the beginning of isovolumetric contraction to isovolumetric relaxation or in other words the ventricular systole which includes ventricular depolarisation and repolarisation of the electrical activity. The QT interval shortens at faster heart rates and the QT interval lengthens at slower heart rates. Both prolongation and shortening of QT interval are associated with the risk of arrhythmia. Abnormal prolongation may lead to ventricular arrhythmia like Torsades de Pointes whereas short QT may increase the risk of paroxysmal atrial and ventricular fibrillation or even sudden cardiac arrest.4
The corrected QT interval (QTc) allows comparison of QT values at different heart rates and helps in better detection of arrhythmia. QTc is the QT interval calculated at a standard heart rate of 60 bpm using various formulas. Bazett formula (QTC = QT / √ RR) is used most commonly. If the heart rates fall outside of the 60 – 100 bpm range, the Fredericia (QTC = QT / RR 1/3) ) or Framingham ( QTC = QT + 0.154 (1 – RR) corrections are more accurate. If the patient’s heart rate is 60 bpm, the absolute QT interval should be used.4
If QTc is > 440ms in men or > 460ms in women it will be called prolonged. There will be an increased risk of torsades de pointes if QTc >500. QTc is termed abnormally short if it is < 350ms. Conventionally, a normal QT should be less than half of the preceding RR interval.4 Causes of a prolonged QTc (>440ms) are Hypokalaemia, Hypomagnesaemia, Hypocalcaemia, Hypothermia, Myocardial ischemia, Raised intracranial pressure, Congenital long QT syndrome and drugs.4 With the invention of modern electronic equipment which can transform various signals of our body to both analogue and digital data, we can get values of every phase of a cardiac cycle upto three decimal places or more. Hence measurement of Electro Mechanical window (EMW) has been proposed as a better predictor of arrhythmia than QTc.16
QS2 is variably affected by acute changes in stroke volume (SV) brought about by changes in preload.17 QS2 best reflects the presence of inotropic stimulation. The shortening of QS2 can be reversed towards normal by administering intravenous propranolol.18 As STIs increases with age and are affected by heart rate some regression equations had to be developed to create age and heart rate specific indices. Different corrections are required for children until puberty 1. Weissler's regression equations for QS2 at 19-65 years is as follows:
For Male QS2I = QS2 + 2.1 x HR ( mean 546 ± 14ms) and for Female QS2I = QS2 + 2.0 x HR ( mean 549 ± 14ms).10 Here the study group comprises of the age group of around 17 to 19 years; so we have used the Wanderman Eqn6,10 for estimating QS2-Index which is calculated for Adolescents of 13-19 years as follows:
Male QS2I= QS2 + 1.6 x HR and Female QS21 = QS2 + 1.7 x HR which gives a predictive male QS2I value of 498 +/- 16 ms and female QS2I as 522 +/- 14 ms. Observed QS2-I in our study for both male and female were higher than the predicted upper limit for the corresponding sex which may be due to racial and ethnic variation.
QT/QS2: QT/QS2 ratio might represent a reliable index of sympathetic cardiac tone.19 QT should always be less than QS2 at rest and the ratio should be <1. Inversion of this ratio is known as “the QT>QS2 Syndrome” which occurs in high catecholamine levels (as in exercise), mitral leaflet prolapse, CAD or Diabetes. It is a more sensitive & reliable index of pro-arrhythmic danger than traditional QT prolongation.
In basal conditions, the QT/QS2 ratio was less than 1, whereas it increased progressively during the physical exercise (bicycle ergometry) and became greater than 1 at peak exercise.19 These results demonstrate that those stimuli which induce a rise in adrenergic activity may increase the QT/QS2 ratio. In contrast, the reflex inhibition of the adrenergic activity induced by phenylephrine is accompanied by a reduction in QT/QS2 ratio. Therefore, the QT/QS2 ratio might represent a reliable index of sympathetic cardiac tone.
Both QT & QS2 had a significant correlation with HR and mean QT remained shorter than QS2 during exercise though both decreased in parallel, but in patients with coronary artery disease QT was longer than QS2 even at rest and this could be considered a risk factor in CAD patients for ventricular arrhythmia & sudden death.20 An immediate and significant rise in QS2 though HR dropped and QS2 remained prolonged even after 10 sec of the tilt.21
Linde et al22 induced Torsades de pointes (TdP) on 8 beagle dogs and then studied for STIs putting them on the sling. All dogs were treated with a potent potassium channel (IKs ) blocker (JNJ 303; 0.1 mg/kg/min, IV) and after 15 minutes the dogs were triggered with a bolus injection of isoproterenol (0.5 μg/kg, IV) or a mere “natural” stimulus (“fright” with an airbrush) to induce a beta-adrenergic stimulation and possible induction of TdP. They concluded that in slung dogs JNJ 303 prolonged QT, did not affect QS2, resulting in an enhanced QT/QS2 ratio. A high QT/QS2 ratio predicted the induction of TdP after beta-adrenergic stimulation, as observed after isoproterenol, and also after a more “natural” stimulus (“fright” with an airbrush). This observation proves the importance of the QT/QS2 parameter to unearth a hidden probability of cardiac arrhythmia in a healthy individual when under stress.
4. Sexual variations in the cardiovascular parameters:
Virginia Huxley23 has proved in detail that sexual dimorphism is a reality concerning cardiovascular functions. Not only the size of a woman's heart is smaller than a man's heart24, but they also maintain homeostasis differently too. Geelen G et al25 have shown that women of all ages have enhanced para-sympathetic activity (reflected by low Total Peripheral Resistance or TPR and low Mean Arterial Pressure or MAP) and men are found to have relatively higher plasma norepinephrine levels. Under stressful situation men and women use the two arms of baroreceptor reflex differently; men respond by increasing TPR thereby raising MAP whereas, women increase HR and cardiac output (CO). In both cases, there is an appropriate cardiovascular response, but there are potentially different outcomes.23 Cardiac myocytes of the two sexes also differ in their electrical activity.26 Normally ECG of a woman's heart demonstrates a longer QT interval than that of men (which is just the reverse in our study). QT interval does not show much difference in boys and girls before sexual maturity but it shortens in males after attaining puberty.23 Anthony M27 has stated that the density of repolarizing potassium currents (Kr and Ks) in cardiac myocytes are less in females and L-type calcium currents are also of many varieties; hence there is difference in the patterns of cardiac repolarisation between the two sexes. Thus the incidence of cardiac arrhythmias and their response to drugs turn out to be sex-specific which should be taken care of during treatment.
According to Virginia Huxley23, there is a sex-specific difference even in the composition of circulating blood. As the formed elements are less, women usually show lower hematocrit level than men. Both lipid and plasma protein compositions demonstrate sexual dimorphism and the blood flow into the superior mesenteric artery is also higher in females. The significant difference in some of the STI parameters between the male and female population in our study justifies the aforesaid explanation of sexual dimorphism of cardiovascular physiology. Therefore, a single approach to the diagnosis and treatment of cardiac dysfunction will not be optimal for both men and women. To cater to this problem we need separate data for the male and female population. But the study of cardiovascular parameters is difficult in female because of the “women’s cycle”- the sex hormone status of females, changes in a cyclical fashion over the lunar month posing a problem in the interpretation of the findings. The level of testosterone hormone remains relatively constant in males; therefore, males are accepted as a “cleaner model” for the study of cardiovascular function.23
5. Genetic and ethnic influence on cardiovascular parameters:
Predisposition to cardiovascular diseases may be due to racial characteristics but the outcome may be influenced by the environmental factors which are togetherly termed as ethnicity. Ethnicity refers to a group of people who share a geographic area, religion, culture, or language whereas race refers to common characteristics passed down through the genes.
There is diversity even within a racial or ethnic group; genetic traits common to some groups may not be present in others of the same race. The higher heart disease rates seen among some groups like the Afro-American population in the USA may be due to many intertwined factors. Their lower average incomes affect where they live, which in turn affects their access to healthy food, safe places to exercise, and quality health care.28 So the interpretation of cardiovascular parameters encompasses all the aforementioned factors taken care of for which we need a separate database for different race and ethnicity.
Estimation of Systolic time intervals like QT, QS2 and their ratio yields a rich source of information about the conductivity and contractility of the heart and can predict hemodynamic and autonomic modulation of the heart when subjected to stress. Hence Urbaszek29 has aptly said Left ventricular (LV) systolic time intervals (STI) should be considered the integral components of LV performance. Unlike echocardiography or electrocardiography, the risk of arrhythmia can be anticipated only through the estimation of STIs; hence it should be checked before prescribing any drugs which may have a chance to cause arrhythmia in both normal and diseased. The values of STIs in these sympathetically naïve young adults at resting state can be taken as a standard reference for healthy adults in this region.
CONCLUSION
Systolic Time Intervals (STI) are influenced by several anthropometric, hemodynamic, and pharmacologic factors which can limit the usefulness of STI for the evaluation of cardiac function in individual patients. That's why a normative database has to be prepared under similar hemodynamic conditions for different ethnic groups and different age groups in both the sexes.
CONFLICT OF INTEREST: Nil
SOURCE OF FUNDING: Nil
ACKNOWLEDGEMENT: We would like to express our heartfelt gratitude to Prof. Dr. Ananda Kumar Mukhopadhyay, Head of the Department, Department of Physiology, Nil Ratan Sircar Medical College and Hospital, Kolkata for providing the laboratory facilities and other logistic support. We authors are very thankful to each other as we have done this work collaboratively from the very first day. We would like to thank all of the participants without whom the research work could not be completed. Weissler, Peeler & Roehll’s 7 work inspired us to work on this very important and interesting topic. Research paper of S. Hassan10 helped us to understand the topic meticulously. Wanderman’s equation 6 helped us to measure the QS2 index for which we are very grateful to the inventor of the equation. We are grateful to all of the scholars whose articles are used for review of the literature and mentioned in the reference.
References:
1. Lewis RP, Stanley ER, Forester WF, Boudoulas H. A critical review of systolic time intervals. Circulation 1977; 56: 146–158.
2. Metzger CC, Chough CB, Kroetz EW, Leonard JJ. True isovolumic contraction time and its correlation with easily measured external indices of ventricular contractility. Circulation 1967; 36 (suppl II): II-187p.
3. Talley R, Meyer J, McNay J. Effect of diastolic pressure on relationships between an external contractile state and two internal indices of myocardial dysfunction. Clin Res 1969;7(20).
4. Burns ED. QT Interval. ECG Library-ECG Basics. Life in the Fast lane (LITFL). 2019.
5. Pal GK, Pal P. Ch 35. Systolic Time Intervals. In: A textbook of Practical Physiology. 4th ed. Hyderabad, Telangana, India: University Press. 2016; 231-33.
6. Wanderman KI, Hayek Z, Ovsyshcher I, Loutaty G, Cantor A. Systolic time intervals in adolescents. Normal standards for clinical use and comparison with children and adults. Circulation 1981; 63: 204.
7. Weissler AM, Peeler RG , Roehll WH. Relationships between left ventricular ejection time, stroke volume, and heart rate in normal individuals and patients with cardiovascular disease. Am Heart J 1961;62:367-78.
8. Slodki SJ, Hussain AT, Luisada AA: The Q-II interval. III. Study of the second heart sound in old age. J Am Geriatr Soc 1969;17(7):673-9.
9. Willems JL, Roelandt J, DeGeest H, Kesteloot H, Joosens JF. Left ventricular ejection time in elderly subjects. Circ. 1970, 42(1): 37-42.
10. Hassan S, Turner P. Systolic time intervals: a review of the method in the non-invasive investigation of cardiac function in health, disease and clinical pharmacology. Postgraduate Medical J 1983;59:423-34.
11. Golde D, Burstin L. Systolic Phases of the Cardiac Cycle in Children. Med Circul 1970; 42:1029–1036.
12. Slodki SJ, Hussain AT, Luisada AA. The Q-II interval; III Study of the second heart sound in old age. J Am Geriatr Soc 1969;17:673.
13.Weissler AM, Kamem AR, Bornstein RS, Shoenfeld CD & Cohen S. Effect of deslanoside on the duration of the phases of ventricular systole in man. Am J Cardiol 1965;15:153.
14. Weissler AM, Lewis RP, Leighton RF. The systolic time intervals as a measure of left ventricular performance in man. In: PN Yu, JF Goodwin (Eds.) Progress in cardiology, Lea & Febiger, Philadelphia (1972); pp.155-83.
15. Weissler AM, Harris WS, Schoenfeld CD. Systolic time intervals in heart failure in man. Circulation 1968;37:149-159.
16. Charisopoulou D, Koulaouzidis G, Rydberg A, Henein MY. Exercise worsening of electromechanical disturbances: A predictor of arrhythmia in long QT syndrome. Clin Cardiol 2019; 42(7): 235-40.
17. Martin CE, Shaver JA, Thompson ME, Reddy PS, Leonard JJ. Direct correlation of external systolic time intervals with internal indices of left ventricular function in man. Circulation 1971;44:419-31.
18. Lewis RP, Boudoulas H, Welch TG, Forester WF. The usefulness of systolic time intervals in coronary artery disease. Am J Cardiol 1976;37(5):787-96.
19. Caprio LDe, Ferro G, S Cuomo, Volpe M, Artiaco D. QT/QS2 ratio as an index of autonomic tone changes. Am J Cardiol 1984;53(6):818-22.
20. Ferro G, Romano M, Carella G, Cotecchia MR, Maro TD. Relation between QT &QS2 intervals during exercise & recovery; Response in a patient with coronary artery disease & age-matched control subjects. Chest. 1986 Oct; 90(4): 558-61.
21. Singh K. Effect of Orthostatic Stress on Systolic Time Intervals in rabbits. IJPP 2004: 48(3):361-64.
22. van der Linde H, van Deuren B, Somers Y, Teisman A, Towart R. The QT/QS2 ratio: a risk-marker for torsades de pointes in conscious dogs after Iks-blockade and beta-adrenergic triggers. Janssen pharmaceutical companies of Johnson & Johnson Center of Excellence for Cardiovascular Safety Research, B-2340 Beerse, Belgium. Proceedings of the British Pharmacological Society at http://www.pA2online.org/abstracts/Vol8Issue1abst045P.pdf.
23. Virginia H. Huxley. Sex and the cardiovascular system: the intriguing tale of how women and men regulate cardiovascular function differently. Adv Physiol Educ 2007;31(1):17–22.
24. Rabbia F, Grosso T, Cat Genova G, Conterno AA, De Vito B et al. Assessing resting rate in adolescents: determinants and correlates. J Hum Hypertens 2002;16(5):327–32.
25. Geelen G, Laitinen T, Hartikainen J, Bergstrom K, Niskanen L. Gender influence on vasoactive hormones at rest and during a 70-degree head-up tilt in healthy humans. J Appl Physiol 2002;92:1401–08.
26. Surawicz B, Parikh SR. Differences between ventricular repolarization in men and women: description, mechanism and implications. Ann Noninvasive Electrocardiol 2003;8(4):333–40.
27. Anthony M. Male/female differences in pharmacology: safety issues with QT-prolonging drugs. J Women's Health (Larchmt) 2005;14(1):47–52.
28. Race and ethnicity: Clues to your heart disease risk? Published: July 2015; Updated: July 17, 2015. [Harvard Health Publishing. Harvard Medical School]
29. Urbaszek W. (1980) Noninvasive Evaluation of the Cardiovascular Function using the Pre-ejection Index. In: List W., Gravenstein J.S., Spodick D.H. (eds) Systolic Time Intervals. International Boehringer Mannheim Symposia. Springer, Berlin, Heidelberg. https://doi.org/10.1007/978-3-642-46418-8_23.
|
 IJCRR
IJCRR 


 This work is licensed under a Creative Commons Attribution-NonCommercial 4.0 International License


