IJCRR - 13(9), May, 2021
Pages: 103-109
Date of Publication: 07-May-2021
Print Article
Download XML Download PDF
Comparative Genomic Analysis of Strains Belonging to Two Different Pathovars of Pseudomonas syringae van Hall
Author: Krishna Baruah, Sushmita Kalita, Debasish B. Krishnatreya
Category: Healthcare
Abstract:Background: Pseudomonas syringae is a phytopathogen that is known to cause diseases in monocots and dicots worldwide. The strains of this pathogen are known for their host-specific interactions on different plant species. Objective: The present study focuses on a comparative analysis of the genomic architecture of strains of Pseudomonas syrin�gae belonging to pathovars actinidiae and syringae. Methods: Complete genome sequences of nine strains of P. syringae were used for comparative analysis using computational tools. Sequence similarity and conservation in gene order was observed in the strains considered in this study. The analysis includes parameters like calculation of genomic subsets, synteny plots, conservation in gene order and phylogenetic analysis. Results: The observations helped to understand the genetic differences between taxonomically related pathogenic strains that have varying host responses. By implementing various bioinformatics tools and techniques, the differences in the genomic structure were evident, based on overall genome statistics, gene orthologs, paralogs, as well as the degree of rearrangement in the gene order. It was observed that strains belonging to the same pathovar share a great amount of genomic similarity within themselves, as compared to strains of different pathovars. Conclusion: The differences in the pathogenic habits and host specificity of the strains belonging to different pathovars, is evident from the basic differences in their genetic structure. The pathogenicity related genes such as Hrp, also show significant variation among their orthologues in both the pathovars. The extent of co-relation between host specificity and genomic organi�sation can be estimated from the results obtained in this study.
Keywords: Comparative genomics, Gene order, Pathovars, Synteny, Phylogeny, Pseudomonas syringae
Full Text:
INTRODUCTION
Pseudomonas syringae is a gram-negative rod-shaped gamma?proteobacterium with phytopathogenic habits but can occur also as a saprotroph when conditions are not favourable for the development of disease.1 It causes bacterial canker and leaf spot disease in more than 180 plant species including kiwifruit, beet, tomato, wheat, barley, pea etc. and is an oxidase and arginine dihydrolase-negative fluorescent bacteria.2,3 The species is found worldwide geographically, but the wet and cool temperature is mostly favourable for this bacterium. P. syringae can infect plants through natural openings, such as stomata in leaves, and lenticels in woody tissues.4
Due to the presence of flagella and pilli, they can enter the plant through wounds and then infiltrate using some virulence factors called type III secretion system (T3SS) effector proteins. Effector molecules are used by both prokaryotes and eukaryotes to transport proteins, DNA and chemical molecules (e.g. toxins) across cell walls and membranes into host tissues.5 Gram-negative bacteria have six major secretion systems, the most extensively studied of which is the Type III secretion system (T3SS). T3SS is central to the pathogenesis of many pathogens in infection of economically and ornamentally important crops. In P. syringae, hrp/hrc genes encode the Hrp (type III secretion) system, while avirulence (avr) and Hrp dependent outer protein (hop) genes encode effector proteins.6 The type III secretion system (T3SS) is required for the pathogenesis of P. syringae and forms a specialized delivery system functioning in the translocation of effector proteins directly into the cytoplasm of plant cells.7 This suppresses the defence system of the plant and establish infections that result in plant cell death and release of nutrients for the invading pathogen.
The bacterium can change its pattern of expression of genes when comes in contact with the host and starts expressing virulence-related genes. It can produce highly viscous compounds like polysaccharides which create a protective environment for it to grow in.8 The species P. syringae is best known for its ice nucleation activity.9 The bacterium occurs in non-agricultural habitats like flooded areas, snow, alpine streams and lakes, and is responsible for frost damages in plants.10 Some strains of these bacteria have ice-making proteins on their surface which help in the formation of ice crystals. The ice crystals grow and create more wounds to the injured plant surface through which the bacterium can further infiltrate the plant tissues.
This study is focused mainly on the comparative genomics of the two most common pathovars of P.syringae, viz. P. syringae pv. Actinidiae and P. syringae pv. syringae. Pathovaractinidiaeis the causal agent of bacterial canker in kiwifruit11 and causes leaf spots, dieback, and canker that sometimes lead to plant death in vines.12 P. syringae pv. syringae is a common pathogen of several crop plants, which invades parenchymatous tissues causing leaf spots and stem cankers.13 It mainly attacks Syringa, Prunus and Phaseolus species with some reports of infection also in case of beans, millet, mango etc.14,15 The pathovar is known for the production of syringomycin, a peptide-containing phytotoxin that is not host-specific but biocidal to a wide spectrum of organisms.16 In this study we have tried to create a projection towards the comparative analysis of genomic features of the two pathovars, using both analytical and visualization tools for representation.
MATERIALS AND METHODS
Pathogenic strains belonging to two different pathovars
The strains which have been considered in this study belong to two different pathovars of Pseudomonas syringae (syringae and actinidiae) (Table 1). All genomes included, have been collected from NCBI Database (https://ncbi.nlm.nih.gov), and only the ones with complete sequences have been selected (including chromosome and megaplasmids). This is because the inclusion of scaffold and contigs might lead to undiscovered anomalies due to the omission of some genomic characteristics.
The MAFF212063 strain, belonging to the pathovar actinidiae has been used as the reference strain in this comparative genomics study, due to its widespread popularity and availability of complete molecular details of its genome. The 6.69347 megabases (Mb) genome of MAFF212063 is divided into 3 replicons: a 6.56 Mb chromosome and two plasmids of about 0.07 Mb. The MAFF212063 strain has a chromosome of 6,556,999 bp and two plasmids of 68,316 bp (pMAFF212O63-A) and 68,156 bp (pMAFF212063-B). The MAFF212063 is copper resistant variety, with copper resistance genes present on plasmid pMAFF212063-A. It carries a copper resistance encoding operon withCopA, CopB, CopC, CopD, and the regulatory CopRS pair.17The genome also contains many proteins which are associated with pathogenicity. Basic genomic features of the reference strain, as collected from the NCBI database, have been included in Table 2.
Sequence-based comparative analyses
Sequence comparisons can be done by using different sequence alignment programs. Multiple sequence alignment programs (e.g. ClustalW, Muscle) can find similarities between several sequences using more complex algorithms.18 EDGAR (Efficient Database framework for comparative Genome Analyses using BLAST score Ratios) is an online tool that supports the functional analysis based on the comparison of the closely related genome. Algorithms for sequence alignment analyses (Muscle) have been assimilated into it in a user-friendly manner.19 The strains used for our study were integrated into a single project in the EDGAR web-server using the help of the server administrators. The whole-genome sequences of the selected strains were then used for various sequence-based analytical programs like calculation of genomic subsets, genesets in the form of Venn diagrams, synteny plots, and genome browser for detecting the presence/absence and order of orthologous genes among the compared strains.
The genomic subsets calculation includes the core genome, pan-genome and the singleton genes calculation, with the reference genome as the starting base. The pan-genome is the entire gene set of all the strains of a species. It includes the genes present in the complete family of selected strains. The core genome represents the common set of genes present in all the strains. Whereas a singleton can be defined as a gene-specific to only a single strain, i.e, exhibiting no hits in any other genome but it's own. Venn diagrams allow an easy inspection of the size of the core genome and the number of genes in each of the dispensable subset of the genome. A synteny plot shows the conservation of gene order among compared genomes as it describes the co-localization of genes on a stretch of DNA. We designed separate synteny plots for each strain against the reference to gain an insight into the possible evolutionary events like genome rearrangements and inversion in the gene order. Stop positions of two orthologous genes of two bacterial strains are used as coordinates and plotted to a diagram with the sequence length of the compared strains serving as x and y-axis.
Phylogenetic analysis
Multiple sequence alignments for all the genome sequences were carried out using MEGA7 software.20 The sequences were aligned using the MUSCLE algorithm and a phylogenetic tree was generated using the neighbour-joining method, based on the Jones-Taylor-Thorton (JTT) model and bootstrap of 1000 replicates. The tree was squared to scale, with the number of substitutions per site represented by branch lengths.
Visualization of LCBs
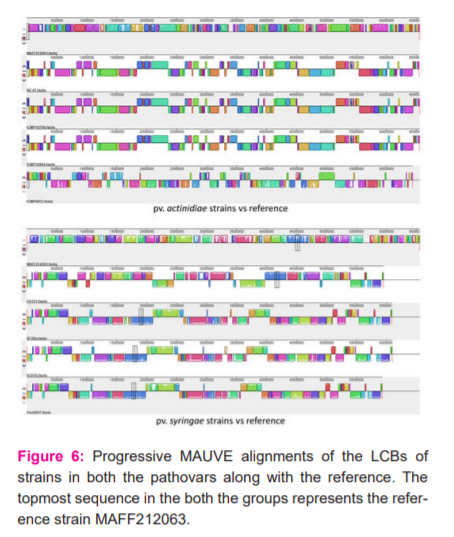
MAUVE (Multiple Alignment of Conserved Genomic Sequence with Rearrangements) is genome comparison software that aligns the conserved genomic sequence by identifying the Locally Collinear Blocks (LCBs). Each LCB is a homologous region of sequence shared by two or more genomes and does not contain any rearrangements within itself.21 The genome sequences of the selected strains were aligned by ‘Progressive MAUVE’, to generate the comparative profiles for order of arrangement of the LCBs. Two separate alignment sets were created for strains belonging to actinidiae and syringae pathovars; each set against the reference strain MAFF212063.
RESULTS
Calculation of genomic subsets
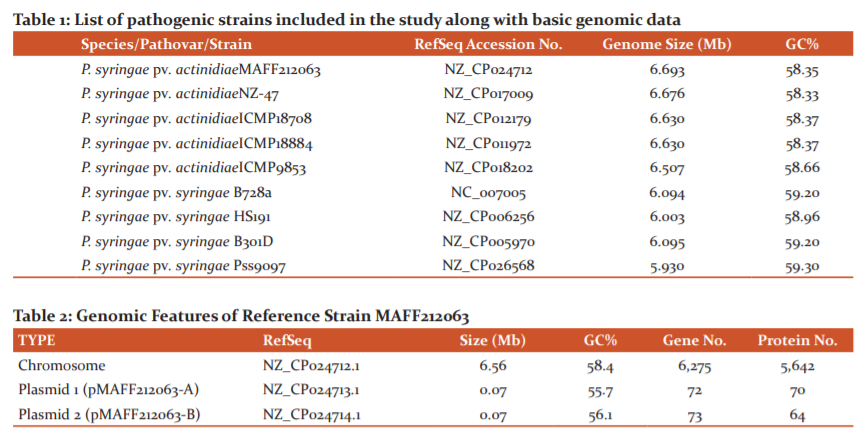
The number of genes in the core and pan-genome for all the strains together was 3,777 and 8535 respectively. Additionally, the number of genes in the core genome and pan-genome was calculated in two sets each i.e., actinidiae strains + reference and syringae strains + reference. The core genome for actinidiae strains consists of 4566 CDS (coding sequences), whereas the core genome for syringae strains along with the reference shows 3916 CDS. This indicates the presence of a much greater number of common genes amongst the actinidiae strains. Similarly, the pan-genome for the actinidiae group consists of 6942 CDS, while that of the syringae + reference group consists of 7468 CDS. Pan-genome represents the sum-total of core genes, singletons (genes present in only one strain of analysed set) and dispensable (genes present in more than one strain but not a part of core genome). In other words, the pan-genome represents the total set of conserved, dispersed and unique genes. The fraction of singletons were found to be higher when four strains of pathovar syringae were analysed along with the reference strain, than that when strains of pathovar actinidiae were analysed (Figure 1). This indicates that on the gene level, a significantly greater degree of commonness is exhibited by the strains of actnidiae strains together with reference, as compared to syringae strains with the reference genome.
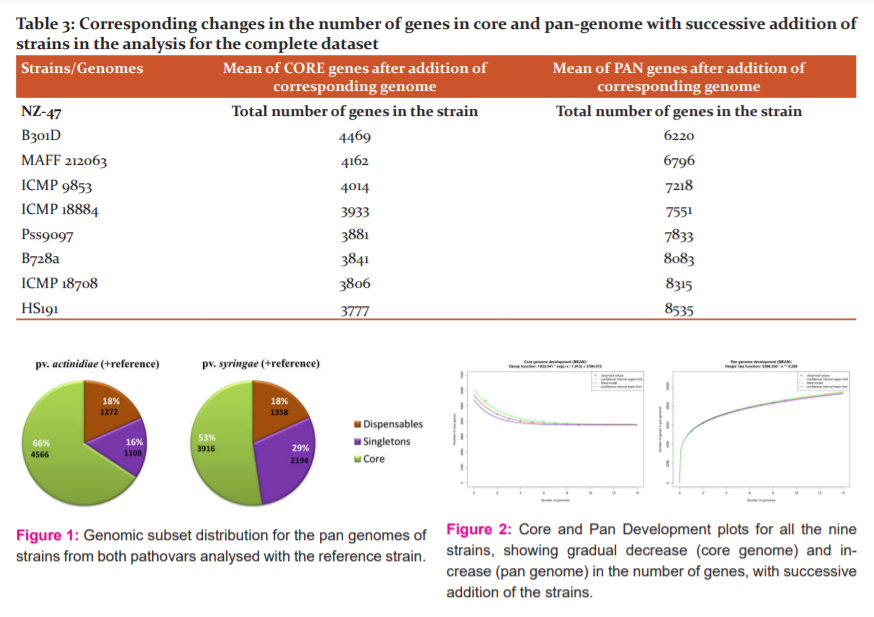
Core and pan-genome sizes are calculated by starting with one genome and then iteratively adding other genomes- one at a time- to the comparison in a user-defined order. Hence, in this manner, core genome size gradually keeps on reducing as the number of genes found to be conserved in sequentially added genomes keeps on decreasing. On the other hand, as the total number of encountered genes keeps on amassing with the addition of new strains, the pan-genome size keeps on increasing. The core and pan-genome development plots signify this trend (Figure 2). The corresponding increase and decrease of core and pan-genome sizes by gradual addition of particular strains in the analysis have been revealed in Table 3.
Visualization of overlapping gene sets within the compared groups
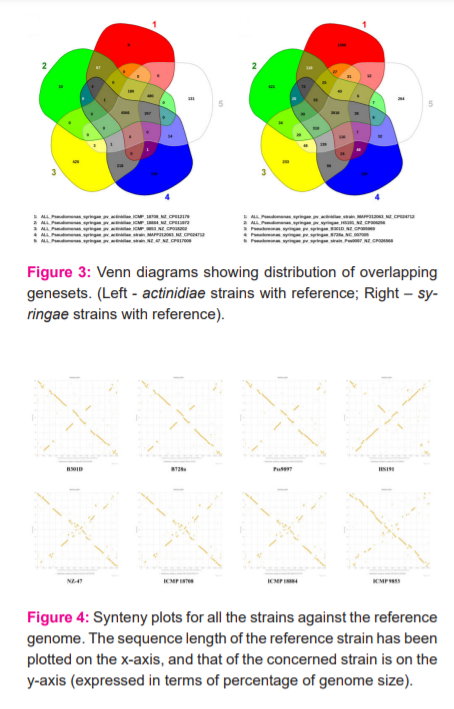
Venn diagrams are visual representation tools. They demonstrate the number of genes for the possible combinations of a selection of genomes. In any subset of the dispensable genome, they make a simple visual inspection of the core genome size and the gene numbers. The Venn diagrams were created in two sets, first is the actinidiae strains with the reference MAFF212063, and the second is for syringae strains with reference MAFF212063 (Figure 3). Each region signifies the number of common genes between the strains that overlap that region. The resultant Venn diagram also indicated more number of common genes when the reference was compared with actinidiae strains, than with the syringae strains.
Generating synteny plots for analysis of conservation in gene order
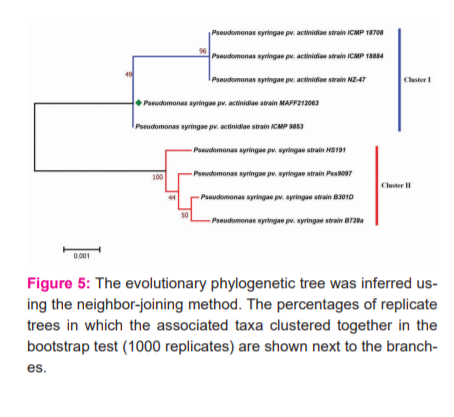
The synteny plots for each of the strains were developed against the MAFF212063 as the reference strain. The plots show the position of each CDS of the chromosome specified (with its genome on the Y-axis in terms of percentage of size), against the position of its homologue in the second chromosome (reference strain) given on the X-axis (Figure 4). It can be seen that B301D, B728a and Pss9097 strains show large scale inversion in their gene order. This proves to be an important distinctive feature on gene-level for strains belonging to a different pathovar than that of the reference genome. However, HS191 as an exception, despite being a syringae strain, shows a significant amount of conservation in its gene order with reference strain belonging to pv. actinidiae. Moreover, actinidae strains NZ-47, ICMP 18708 and ICMP 18884 when plotted against the reference genome, can be said to mainly exhibit large scale rearrangements in their gene order.
Phylogenetic Analysis
To define the homology between the analysed strains, a rooted phylogenetic tree was constructed after aligning the sequences using MUSCLE algorithm. The resulting tree produced well-resolved phylogeny with two separate clusters (Figure 5). The strains belonging to two different pathovars viz. actinidiae and syringe formed two separate well defined phylogenetic groups, with varying branch lengths based on the degree of evolutionary substitutions. HS191 however formed a separate branch from the rest of the strains of pv. syringae and was the closest syringae strain to the reference genome MAFF212063, in terms of parental node and branch length.
Sequence alignment of genomes against the reference strain for visualization of relative gene order
The MAUVE software was used for the visualization and alignment of the LCBs (representation conserved stretch of genes) of the different strains. The analysis was carried out in two separate sets for pv. actinidae and pv. syringae, with reference strain taken as the first sequence in both the cases (Figure 6). The results showed similar trends with that of synteny plot analysis. The actinidiae strains NZ-47, ICMP 9853, ICMP 18884 and ICMP 18708 show rearrangements in their gene order, whereas the syringae strains Pss9097, B301D and B728a show large scale inversion. HS191 despite being a syringae pathovar shows some amount of conservation in its gene order with the reference. The progressive MAUVE alignment also helps to visualize the difference in the size of genomes for actinidiae and syringae strains.
DISCUSSION
Comparative genomics is an exciting field of biological research in which researchers use a variety of tools including computational analyses, to compare the complete genome sequences of different species.22 Whole-genome sequence alignments have become more important day by day because the comparison between different genomes often leads to rapid identification of distinct mechanisms underlying pathogenicity.23 Through this type of study, scientists can devise new strategies to plan for the development of resistant crop varieties and biocontrol techniques. In this present study, we have tried to expound the basic genomic differences between strains of P. syringae belonging to two different pathovars, which exhibit different habits of pathogenicity and ensuing symptoms in the infected plants.
The first conspicuous genomic difference between the two pathovars lies in the size of the genomes of included strains. The genome sizes for pv. syringae strains are around 6 megabases, whereas, the sizes of actinidiae strains are greater than 6.5 megabases. The genomic architecture and gene order also correspondingly show greater similarity within the same pathovar, than with strains of another pathovar. The core and pan development plots generated more than 95% upper and lower confidence limits, thus ensuring that consistent and reliable genomic data has been used for carrying out the sequence-based analyses. The number of unique genes in the reference genome is found to be 1086 when pooled with the syringae strains, and is nearly half the value at 538 genes when compared with the rest of the actinidiae strains. The strain MAFF212063 belongs to biovar?5 of P. syringae. It is popularly known as ‘kiwifruit canker pathogen’ based on its host and pathogenicity patterns. In 2017, the first complete sequence of this copper resistant biovar-5 strain was published.17
The synteny plots however did not give a comprehensive demarcation between the two distinct pathovars. Even though the gene order for B301D, B728a and Pss9097 showed inversion in respect to the genome of reference strain, but HS190 contrastingly showed significant conservation in its gene order. In other words, the position of the orthologous genes was conserved to a great extent in HS191 strain (pv. syringae) and MAFF212063 strain (pv. actinidiae). Moreover, actinidiae strains ICMP9853, ICMP18707, ICMP1884 and NZ?47 showed rearrangements in their gene order concerning the pathogen. This can be considered as an unexpected observation, given that these strains are much closer to the reference, in terms of their phylogeny. Furthermore, the orthologous genes involved in the Type-III secretion system such as the Hrp genes often showed differences in their gene lengths in the strains of two pathovars. For instance, the length of the YopN family T3SS gatekeeper subunit is 1,107 bp in actinidiae strains whereas it is 1,182 bp in pv. Syringae strains. Similarly, the lengths of HrpQ and HrpZ1 genes were 993 bp and 1,104 bp in actinidiae strains, but 975 bp and 1,032 bp in syringae strains, respectively. However, the lengths of some genes like HrpB and HrpE were conserved in all the strains (375 and 582 bp respectively).
This comparative genome analysis identified the similarities and differences between the two most common pathovars of P. syringae. The gene order exhibits rearrangements between the actinidiae strains whereas the syringae strains show inversion in their gene order except for HS191 which formed a separate branch in the phylogenetic tree. This study helps to predict that geographic isolation of different strains of P. syringae from each other and variation in the pathogenic habits have most probably resulted in their genomic distinction. This further enhances the need for carrying out detailed research on the extent of correlation existing between the genomic organization and host specificity among the pathogenic strains of Pseudomonas syringae. Availability of complete genome sequences will further facilitate elucidating the differences in the genetic make-up of pathogenic strains as well as their pathogenicity and specificity towards host plants.
ACKNOWLEDGEMENT: The authors would like to acknowledge the University of Science and Technology, Meghalaya and Gauhati University, Guwahati, Assam. They also acknowledge their contemporaries whose works have been cited in this manuscript. The authors express their gratitude to Dr.NirajAgarwala, Assistant Professor, Department of Botany, Gauhati University for his guidance and motivation.
CONFLICT OF INTEREST: The authors declare they have no conflict of interest.
AUTHOR CONTRIBUTIONS: Krishna Baruah: Software, Writing - Original draft, Formal Analysis; Sushmita Kalita: Writing - Review & Editing, Data Curation; Debasish B. Krishnatrey: Supervision, Validation.
FUNDING: No source of financial support was available for this study.
References:
-
Hirano SS, Upper CD. Bacteria in the Leaf Ecosystem with Emphasis on Pseudomonas syringae- a pathogen, ice Nucleus, and Epiphyte. Microbiol Mol Biol Rev 2000;64(3):624-53.
-
Cunty A, Cesbron S, Briand M, Carrere S, Poliakoff F, Jacques MA, et al. Draft genome sequences of five Pseudomonas syringae pv. actinidiofoliorum strains isolated in France. Braz J Microbiol 2016;47:529-30.
-
Berge O, Monteil CL, Bartoli C, Chandeysson C, Guilbaud C, Sands DC, et al. A User’s Guide to a Data Base of the Diversity of Pseudomonas syringae and its Application to Classifying Strains in this Phylogenetic Complex. PLoS One 2014;9(9): e105547.
-
Flores O, Prince C, Nuñez M, Vallejos A, Mardones C, Yanez C, et al. Genetic and Phenotypic Characterization of Indole-Producing Isolates of Pseudomonas syringae pv. actinidiae Obtained From Chilean Kiwifruit Orchards. Front Microbiol 2018;9:1907.
-
Green ER, Mecsas J. Bacterial Secretion Systems: An Overview. Microbiol Spectr 2016;4(1):10.
-
Collmer A, Badel JL, Charkowski AO, Deng WL, Fouts DE, Ramos AR, et al. Pseudomonas syringaeHrp type III secretion system and effector proteins. Proc Natl Acad Sci USA 2000;97(16):8770-7.
-
Gutierrez-Barranquero JA, Cazorla FM, de Vicente A, Sundin GW. Complete sequence and comparative genomic analysis of eight native Pseudomonas syringae plasmids belonging to the pPT23A family. BMC Genomics 2017;18(1):365.
-
Ichinose Y, Taguchi F, Mukaihara T. Pathogenicity and Virulence Factors of Pseudomonas syringae. J Plant Pathol 2013;79:285-96.
-
Morris CE, Sands DS, Vinatzer BA, Glaux C, Gilbaud C, Buffiere A, et al. The life history of the plant pathogen Pseudomonas syringae is linked to the water cycle. ISME J 2008;2(3):321–34.
-
Lindow SE, Arny DC, Upper CD. Bacterial Ice Nucleation: A Factor in Frost Injury to Plants. Plant Physiol 1982;70(4):1084-9.
-
Lee YS, Kim GH, Koh YH, Zhuang Q, Jung JS. Development of Specific Markers for Identification of Biovars 1 and 2 Strains of Pseudomonas syringaepv. actinidiae. Plant Pathol J 2016;32(2):162-7.
-
Cunty A, Poliakoff F, Rivoal C, Cesbron S, Saux MF, Lemaire C, et al. Characterization of Pseudomonas syringae pv. actinidiae (Psa) isolated from France and assignment of Psabiovar 4 to a de novo pathovar: Pseudomonas syringae pv. actinidifoliorum pv. nov. Plant Pathol 2015;64(3):582–96.
-
Cody YS, Gross DC. Characterization of Pyoverdin, the Fluorescent Siderophore Produced by Pseudomonas syringaepv. syringae. Appl Environ Microbiol 1987;53(5):928-34.
-
Ravindran A, Jalan N, Yuan JS, Wang N, Gross DC. Comparative genomics of Pseudomonas syringaepv. syringae strains B301D and HS191 and insights into intrapathovar traits associated with plant pathogenesis. Microbiology 2015;4(4):553–73.
-
Carrion VJ, Gutierrez-Barranquero JA, Arrebola E, Bardaji L, Codina JC, de Vicente A, et al. The mangotoxin biosynthetic operon (mbo) is specifically distributed within Pseudomonas syringaegenomospecies 1 and was acquired only once during evolution. Appl Environ Microbiol 2013;79(3):756-67.
-
Buell CR, Joardar V, Lindeberg M, Selengut J, Paulsen IT, Gwinn ML, et al. The complete genome sequence of the Arabidopsis and tomato pathogen Pseudomonas syringaepv. tomato DC3000. Proc Natl Acad Sci USA 2003;100(18):10181-6.
-
Poulter R, Taiaroa G, Sumpter N, Stockwell P, Butler M. Complete genome sequence of the kiwifruit pathogen Pseudomonas syringae pv. actinidiaeBiovar5, originating from Japan. Genome Announc 2017;5:e01409-17.
-
Kurtz S, Phillippy A, Delcher AL, Smoot M, Shumway M, Antonescu C, et al. Versatile and open software for comparing large genomes. Genome Biol 2004;5(2): R12.
-
Blom J, Albaum SP, Doppmeier D, Puhler A, Vorholter FJ, Zakrzewski M, et al. EDGAR: a software framework for the comparative analysis of prokaryotic genomes. BMC Bioinformatics 2009;10:154.
-
Kumar S, Stecher G, Tamura K. MEGA7: Molecular Evolutionary Genetics Analysis Version 7.0 for Bigger Datasets. Mol Biol Evol 2016;33(7):1870-4.
-
Darling AC, Mou B, Blattner FR, Perna NT. Mauve: Multiple Alignment of Conserved Genomic Sequence With Rearrangements. Genome Res 2014;14(7):1394-403.
-
Hardison RC. Comparative genomics. PLoS Biol 2003;1(2): E58.
-
Hu B, Xie G, Lo CC, Starkenburg SR, Chain PSG. Pathogen comparative genomics in the nextgeneration sequencing era: genome alignments, pangenomics and metagenomics. Brief Funct Genomics 2011;10(6):322-33.
|
 IJCRR
IJCRR 


 This work is licensed under a Creative Commons Attribution-NonCommercial 4.0 International License


