IJCRR - 13(8), April, 2021
Pages: 103-109
Date of Publication: 25-Apr-2021
Print Article
Download XML Download PDF
Extraction of Features from ECG Signal
Author: Ibrahim Patel, A. Sandhya, V. Sripathi Raja, S. Saravanan
Category: Healthcare
Abstract:Introduction: Significant features of the ECG signal include the P wave, the QRS complex (A combination of the Q wave, R wave and S wave, the \"QRS complex\" represents ventricular depolarization.) and the T wave. This paper focuses on the identification of the P wave and T wave Because of their low amplitude; it is difficult to identify the position of the P and T waves. Objective: Present an algorithm for the detection of QRS (A combination of the Q wave, R wave and S wave), T and P waves of ECG. The extraction will require auxiliary investigations in many methodological aspects. The key gain of this method of detection is that the long-term ECG signal takes less time Methods: Feature Extraction is performed for each subject to shape distinctive, customized signatures. Preprocessing removes or suppresses noise from the raw ECG signal. The elimination of baseline wandering and noise reduction is one of the most common issues. Discrete Wavelet Transform is employed to remove the noise. High-frequency components of the ECG signals reduce as lower information is removed from the original signal. When the lower info is eliminated, the signal is clearer and the noise disappears when noise is defined by components of high frequency picked up in the transmission pathways. Results: The QRS complex was detected which is based on the maximum slope threshold. The ECG data files were used to test this QRS detection method. Based on the information of the identified QRS complexes, the P waves and the T waves can also be detected. From these waves, we are identified amplitude and intervals of ECG data files Conclusion: In this thesis, present an algorithm for the detection of QRS, T and P waves of ECG. The extraction will require auxiliary investigations in many methodological aspects. The key gain of this method of detection is that the long-term ECG signal takes less time.
Keywords: QRS complex, 20 ECG samples, Heartbeats, PR intervals, R-R interval, Pre ventricular contraction
Full Text:
INTRODUCTION
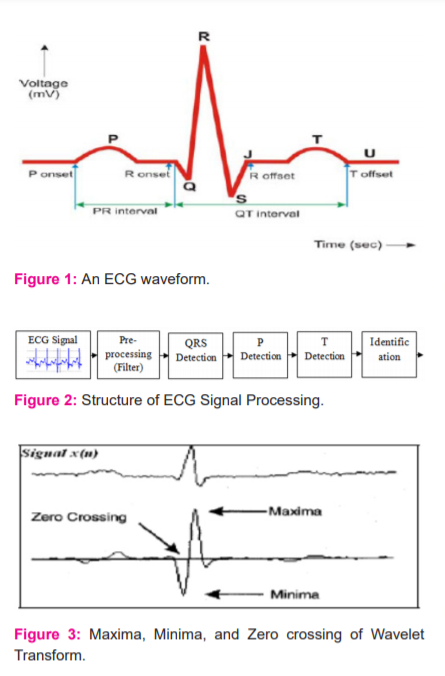
The Electrocardiogram reflects the electric expression of contractile cardiac operation. It is a map of the orientation and degree of electro-activity induced by atria and ventricles depolarization and repolarization.1 As cardiac failure is one of the biggest causes of death in the country, the significance of electrocardiography is notable. According to the location, height, cardiac anatomy, age and other influences, an ECG differs from individual to person.2 There is broad proof of the highly familiar properties of cardiac electrical activity which are suitable for evaluation and treatment. The ECG is marked by a repeated P, QRS, T and U wave series with each rhythm. The QRS complex, attributable to human ventricular depolarization is the most striking waveform. A standard ECG heartbeat wave consists of a P wave, a QRS and a T wave. Fig.1 defines the specific model of a healthy ECG heartbeat signal that has the features P, Q, R, S, J, T and U and various intervals including QT, ST and PR intervals Figure 1.3,4
A variety of strategies for detecting ECG characteristics have been developed by the researchers. Recently the valuable method to evaluate a non-stationary signal has shown that the wavelet transformations. Also when high frequency and low-frequency noises are present, the ECG signal can be calculated in a fairly correct manner with the transforming wavelet technology. Among current wavelet approaches, we have used real dyadic wavelet transformation due to its fast time-setting properties and its easy calculations (continuous, dyadic, orthogonal, biorthogonal). Discrete Wavelet Transform (DWT) can be used in the study of non-stationary ECG signal, using a strong method.
LITERATURE SURVEY
Using wavelet transform and help vector machines, Zhao suggested a function extraction technique. A new approach to feature extraction for accurate identification of heart rhythm was proposed in the paper.4 Classification scheme consists of three parts, namely data preprocessing, feature extraction, and ECG signal classification.5 To achieve the feature vector of ECG results, two separate feature extraction methods are implemented together. The wavelet transform is used to obtain the transform coefficients as the features of each section of the ECG. To get hold of the temporal configurations of ECG waveforms, autoregressive modelling (AR) is often used at the same time. Finally, to distinguish various ECG heart rhythms, a support vector machine (SVM) with a Gaussian kernel is used. The overall precision of 99.68 % was obtained by the results of computer simulations presented to assess the efficiency of the proposed solution.
A function extraction process using Discrete Wavelet Transform (DWT). To perform the classification task, they used a discrete wavelet transform (DWT) to extract the relevant details from the ECG input results.3 Their planned study involves the following: procurement of data modules, pre-processing, beat identification, retrieval of features and classification. The Wavelet Transform (DWT) in the function extraction module is programmed to resolve the issue of non-stationary ECG signals. It was generated by translation and dilation operations from a single generating mechanism named the mother wavelet. Using DWT in function extraction, since it has a varying window scale, large at lower frequencies and narrow at higher frequencies, can contribute to an optimum frequency resolution in all frequency ranges. The DWT characterization would provide the morphological variations of the ECG waveforms with stable characteristics.
After signal retrieval from the compressed data, it has been found that the network not only compresses the data but also improves the quality of the retrieved ECG signal concerning the elimination of high-frequency interference present in the original signal. With the implementation of an artificial neural network (ANN) the compression ratio increases as the number of ECG cycles increases.6
T-wave abnormalities can be assessed without the need for T-wave endpoint identification. The wavelet transformation is a new promising technique in non-invasive electro cardiology providing improved methods for late potential detection.7 Thakor et al.8 observed that the peaks of QRS complexes flatten and P-and T-waves containing lower frequencies become more visible. Martinez et al.9 used the ECG to measure the heart’s electrical conduction system. It picks up electrical impulses generated by the depolarization of cardiac tissue and translates into a waveform. The waveform is then used to measure the rate and regularity of heartbeats, the presence of any damaged tissue in the heart, and the effects of drugs or devices used to regulate the heart, such as a pacemaker. An ECG produces a pattern reflecting the electrical activity of the heart and usually requires a trained clinician to interpret the graph. Sasikala et al.1 gives information regarding the rhythm of the heart, whether that impulse is conducted normally throughout the heart, or whether there is any irregularity in the functioning of heart A typical ECG tracing of the cardiac cycle (heartbeat) consists of a P wave, a QRS complex, a T wave, and a U wave (which is normally invisible in 50 to 75% of ECGs because it is hidden by the T wave and upcoming new P wave). The baseline of the electrocardiogram is measured as the portion of the tracing following the T wave and preceding the next P wave and the segment between the P wave and the following QRS complex (PR segment). In a normal healthy heart, the baseline is equivalent to the isoelectric line (0mV) and represents the periods in the cardiac cycle when no currents are flowing towards either the positive or negative ends of the ECG leads. The ST segment remains close to the isoelectric line as this is the period when the ventricles are fully depolarized and thus there is no scope for the current flow in the ECG leads.
MATERIALS AND METHODS
Denoising methods
Huang's data-driven Empirical mode decomposition (EMD) method was initially proposed for the study of ocean waves and found immediate applications in biomedical engineering. The main advantage of EMD is that the basic functions are derived directly from the signal itself. Hence the analysis is adaptive, as opposed to the Fourier analysis, where the basic functions are fixed sine and cosine waves.
This method's central idea is the process that breaks down a given signal into a sum of intrinsic mode functions (IMF), those basic building blocks that make up complex time series data.
A signal must satisfy two criteria to be an IMF:
(1) The average number of points and the number of zero crossings are either equal or differ by one at most.
(2) The upper and lower envelopes mean zero.
The first criterion is equivalent to the narrow-band requirement. The second criterion is necessary to ensure that the instantaneous frequency does not have unnecessary variations caused by asymmetric waveforms. The signal must have at least one maximum and one minimum to be effectively decomposed into IMFs to allow use of EMD. Because of these two definitive IMF requirements, the sifting process for extracting an IMF from a given X(t) signal is described as follows:
Two smooth spines are constructed connecting all the maxima and minima of X(t) to get its upper envelope, Xhigh(t), and its lower envelope, Xlow(t);

The process is repeated for d(t) until the resulting signal, C1(t), the first IMF, satisfies the criteria of an intrinsic mode function. The residue R1(t) = X(t) - C1(t) is then treated as new data subject to the sifting process as described above, yielding the second IMF from R1(t); At the end of this process, the signal X(t) can be expressed as follows:

Where K is the number of IMFs, RK(t) denotes the final residue (signal trend), and Ci (t) are nearly orthogonal to each other, and all have zero means.
Proposed method
To extract information from the ECG signal, the raw ECG signal processing can be roughly divided by functionality into two stages: pre-processing and extraction as shown in Figure 2.
Feature Extraction is performed for each subject to shape distinctive, customized signatures. The purpose of the extraction feature process is to select and keep relevant information from the original signal. The extraction stage of the function extracts diagnostic information from an ECG signal. The Stage of Preprocessing removes or suppresses noise from the raw ECG signal.
The ECG signal primarily includes noises of different forms, including frequency interference, baseline drift, and electrode touch noise, polarizing noise, muscle noise, internal amplifier noise and motor artefacts. Artefacts are the noise induced by the movements of electrodes to the ECG signals. The elimination of baseline wandering and noise reduction is one of the most common issues in ECG signal processing.
Wandering in the Baseline is one of the noise artefacts affecting ECG signals. We use median filters (200-ms and 600-ms) to eliminate the ECG signal base drift. The method will be as follows:
-
The initial ECG signal is processed using a 200-ms broad median filter to eliminate QRS complexes and P waves.
-
Next, the resulting signal is processed with a 600-ms long median filter to eliminate T waves. The signal resulting from the operation of the second filter includes the ECG signal baseline.
-
A signal with the removal of the baseline drift can be obtained by subtracting the filtered signal from the original signal.
The Wavelet Transform is a time-scale representation that has been successfully used in a wide range of applications, especially in the compression of signals. Recently, wavelets have been applied to various Electro cardiology issues, including data compression, late ventricular potentials analysis, and the identification of ECG characteristic points. The Wavelet Transformation is a linear operation that breaks down the signal into a variety of frequency-related scales and analyzes each scale with a certain resolution.
The resulting ECG signal after elimination of baseline wandering is more stable and visible than the initial signal. Many other forms of noise, however, can still affect the ECG signal extraction function. Discrete Wavelet Transform is employed to remove the noise. By applying the Wavelet Transform, this first decomposes the ECG signal into many sub-bands, then modifies each wavelet coefficient by adding a threshold function and finally reconstructs the denoted signal. The high-frequency components of the ECG signal reduce as lower information is removed from the original signal. When the lower information is eliminated, the signal is clearer and the noise disappears when noise is defined by components of high frequency picked up in the transmission pathways.
Detection of QRS is one of the fundamental problems of electrocardiographic signal analysis. The QRS complex consists of three characteristic points within a single heart cycle denoted as Q, R, and S. The QRS complex is considered the electrocardiogram's most striking waveform and is thus used as a starting point for further study or compression schemes. The detection of the QRS complex is based on the Wavelet Transform's modulus maxima. The QRS complex produces two modulus maxima with opposite signs which are shown in figure 3 with a zero-crossing between them. Therefore identification laws (thresholds) refer to the ECG signal's Wavelet Transform.
The QRS complex's most energy is between 3 Hz and 40 Hz. The Fourier transform of the wavelets' 3-dB frequencies shows that the bulk of the QRS complexes energy resides between 23 and 24 scales, with the highest at 24 The energy decreases if the scale is greater than 24 and the energy of the motion artefacts increases for scales greater than 2.6 But we chose to use characteristic scales from 21 to 24 for the wavelet to detect complex QRS.
The waves of Q and S are waves of high frequency and low amplitude and their energies are predominantly small-scale. So, with WT, the detection of these waves is achieved on a low scale. By utilising scale 22, the onset and offset of the QRS complex are observed. The beginning and termination of the first maximum module before and after the maximum module pair within a time window was sensed from the maximum module pair of the R wave. These lead to points of QRS onset and offset.
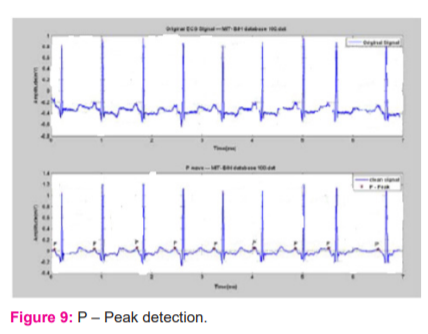
Generally, the P wave consists of the modulus maxima pair with opposite signs and its onset and offset corresponds to this pair's onset and offset. This pair of maxima modulus is checked within a window before the QRS complex starts. The search window begins at 200 ms before the QRS complex begins, and ends with the QRS complex beginning. The ultimate module is a fixed point (the slope of will be equal to zero). The zero-crossing of the maxima pair between the modulus corresponds to the P wave point.
To find the starting point, a backward search is performed from the point of the maximum module on the left of the zero-crossings to the start of the search window until a point is reached where the maximum module is equal to or less than 5%. This point is identified with the beginning of the wave P. Similarly, a forward search is carried out from the point of the maximum module on the right side of the zero-crossing to the end of the search window until a point is reached where the maximum module (minimum module) is equal to or less than 5 %. This point is labelled with the P wave offset,
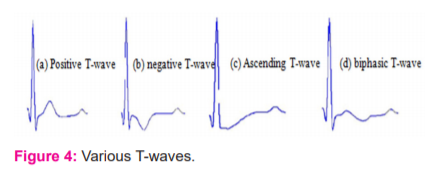
The T-wave corresponds to the repolarization of the ventricular heart. The first situation is a standard T-wave. The wave shown in Figure 4 has a large amplitude, so it won't be difficult to identify, but this amplitude may decline to a very small magnitude. The standard methods in this case will have a very difficult time pointing out the exact location of the T-wave. The second situation has the same issues as the first one, but here the T-wave has inverted. This makes detection difficult for certain methods that do not use the signal modules. Present in the third situation an upward or downward T-wave. Another issue that can occur with all of these situations is bad T-wave positioning. It is also centred near the QRS-complex or the P-wave. It makes distinguishing the two complexes complicated.
A normal T wave and its transformation clearly show a maxima pair of modulus with opposite signs. The T wave is located between the two modulus maxima at zero-crossing. The energy of the T wave is conserved primarily between scales 23 and 24.
So moving away from the dyadic scales and selecting scale 10 for the wavelet transform was more fitting. The next step consists of the search for modulus maxima. We analyze a signal at a scale of 10 and search for a maximum module greater than a threshold. This threshold is determined between two R-peaks by using the root mean square of the signal. If the same sign includes two or more modulus maxima, the largest one is picked. If one or more modulus maxima have been located, the direction and character of the T wave can be determined. The zero-crossing of the maxima pair between the modulus corresponds to the T wave point.
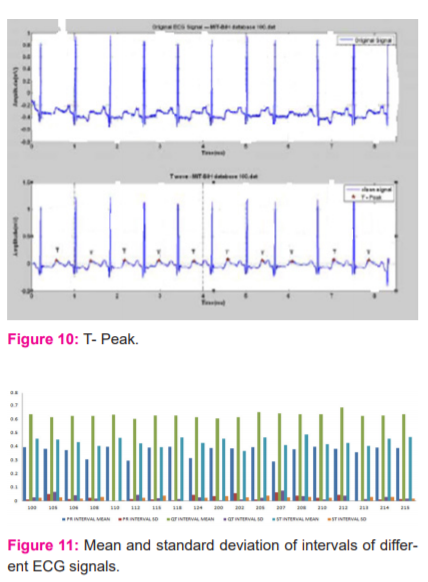
The T wave carries similar characteristics to the P wave. The maximum modulus corresponds to the maximum slopes between the T peak start and the T peak offset. The hunt for the onset of the T wave is performed between the corresponding T wave's first module maxima and the QRS offset. For the P wave, the detection procedure is the same, except that the search window follows the QRS complex. The onset of the T wave is known to be the same as the offset of the QRS complex continuing.
RESULTS AND DISCUSSION
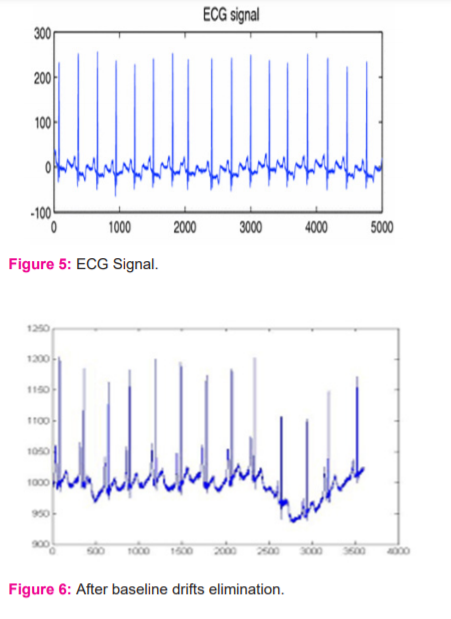
In this thesis, the QRS complex was detected which is based on the maximum slope threshold. The ECG data files were used to test this QRS detection method. Based on the information of the identified QRS complexes, the P waves and the T waves can also be detected. From these waves, we are identified the amplitude and intervals of ECG data files. The ECG signal was taken. It is shown in Figure 5. The signal has 7200 samples.
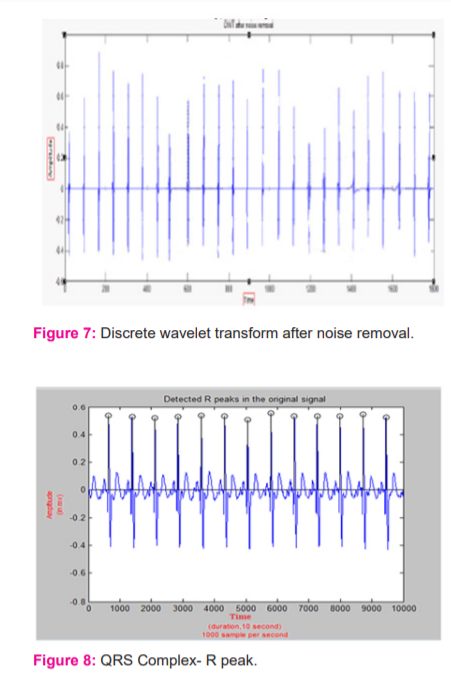
As it is suffering from baseline drift, therefore smoothing function was required to remove it. The ECG signal after baseline drift elimination is shown in figure 6. The discrete wavelet transform was used for noise removal of the ECG signal. The Discrete Wavelet Transform (DWT), which is based on sub-band coding, was found to yield a fast computation of wavelet transform. The second level discrete wavelet transform of the signal is shown in figure 7.
The QRS complex is known as the electrocardiogram's most striking waveform and is thus used as a starting point for further study or compression schemes. It is represented in Figure 8. The QRS complex identification is based on the Wavelet Transform's modulus maxima. Two modulus maxima with opposite signs are generated by the QRS complex, with a zero-crossing between them. In general, the P wave consists of a pair of modulus maxima with opposite signs, and its onset and offset correlate to this pair's onset and offset. This pair of modulus maxima is checked for within a window before the QRS complex begins. It is seen in Figure 9. The search window begins 200 ms before the QRS complex begins and finishes with the QRS complex starting.
The T wave has characteristics similar to the P wave. The modulus maxima correspond to the maximum slopes between the onset of the T peak, and the offset of the T peak and is shown in the below Figure 10. The search for the onset of the T wave is carried out between the first modulus maxima corresponding to the T wave and the QRS offset. The detection procedure is the same as that for the P wave, except that the search window follows the QRS complex. From finding features of ECG signals we can calculate standard ECG intervals QT interval, ST interval, PR interval. QT interval encompasses the time from the beginning of ventricular depolarization to the end of ventricular repolarization.PR interval encompasses the time from the beginning of the P wave to the start of the QRS complex.
The Mean
For a data set, the mean is the sum of the observations divided by the number of observations. It identifies the central location of the data, sometimes referred to in English as the average. The mean is calculated using the following formula.

The Standard Deviation
The most popular indicator of variability, calculating the distribution of the data collection and the relation of the mean to the rest of the data, is the standard deviation. If the data points are similar to the mean, implying that the answers are reasonably uniform, so there would be a slight standard deviation. Conversely, if several data points are far from the mean, suggesting that the answers have a broad range, then the standard deviation would be high. If all the data values are identical then zero would be the standard deviation. Using the same formula, the standard deviation is determined.

Where, Y = Individual score, M = Mean of all scores, N = Sample size (number of scores).
Extraction of these parameters can be used to detect the following problems:
CONCLUSION
In this thesis, present an algorithm for the detection of QRS, T and P waves of ECG. The extraction will require auxiliary investigations in many methodological aspects such as selecting the choice of different parameter and intervals to improve the clinical utility. This processing of biomedical signals culminated in the discovery of certain cardiovascular disorders dependent on ECG signal diagnosis. Therefore, medical experience to diagnose a range of cardiovascular diseases in humans compares the estimation of amplitude and intervals obtained in the proposed system with the ground reality. For ECG Classification, Examination, Diagnosis, Authentication and Recognition results, the information collected about the R Peak and QRS complex is very useful. For beat detection and the calculation of heart rate by R-R interval estimation, the QRS complex is often used. This data can also act as an input to a device that facilitates automated diagnosis of the heart. The detector's overall sensitivity is improving. The key gain of this method of detection is that the long-term ECG signal takes less time.
FUTURE SCOPE
ECG signal plays a vital role in diagnosing various cardiac disorders so it is useful to extract the features of ECG signal. Many time domain and frequency domain methods are used for feature extraction which has their advantages and limitations. The future work focuses on the fact that the different techniques used for extracting the features must provide high accuracy and should be fast and easy to implement. The electrocardiogram (ECG) is a non-invasive and the record of variation of the biopotential signal of the human heartbeats. The ECG detection which shows the information of the heart and the cardiovascular condition is essential to enhance the patient living quality and appropriate treatment. The ECG features can be extracted in the time domain or the frequency domain. The extracted feature from the ECG signal plays a vital in diagnosing cardiac disease. The development of accurate and quick methods for automatic ECG feature extraction is of major importance. Some of the features extraction methods implemented in previous research. Every method has its advantages and limitations. The future work primarily focuses on feature extraction from an ECG signal using more statistical data. Besides the future enhancement on utilizing different transformation technique that provides higher accuracy in feature extraction. The parameters that must be considered while developing an algorithm for feature extraction of an ECG signal are the simplicity of the algorithm and the accuracy of the algorithm in providing the best results in feature extraction.
ACKNOWLEDGEMENT: The authors gratefully acknowledge the management of B V Raju Institute of Technology, Narsapur, Telangana, India for their constant support and encouragement extended during this research.
Conflict of interest, financial support should be mentioned
Conflict of interest and Source of funding: Nil
References:
-
Sasikala P. Extraction of the P wave and T wave in Electrocardiogram. Int J Comp Sci Infor Technol 2011;2(1):489-493.
-
Akay M. Detection and Estimation Methods for Biomedical Signals. CA: Academic Press, San Diego, 1996.
-
Tamil EM, Kamarudin NH, Salleh R, Idris MY, Noor NM, Tamil NM. Heartbeat Electrocardiogram (ECG) Signal Feature Extraction. In proceedings of CSPA,1112-1117.
-
Zhao C. ECG Feature Extraction and Classification Using Support Vector Machines. International Conference on Neural Networks and Brain 2005;2:1089-1092.
-
Thakor NV, Webster JG, Tompkins WJ. Estimation of QRS complex power spectra for design of a QRS filter”. IEEE Trans Biomed Engi 1984;31:702–705
-
Saxena SC, Sharma A, Chaudhary SC. Data compression and feature extraction of ECG signals. Int J Syst Sci 1997; 28(5):483-498.
-
Ahlstrom ML, Tompkins WJ. Digital filters for real-time ECG signal processing using microprocessors. IEEE Trans Biomed Engi 1985;32:708–713.
-
Thakor NV, Webster JG, Tompkins WJ. Estimation of QRS complex power spectrum for design of a QRS filter. IEEE Trans Biomed Engi 1984;31(11):702-706.
-
Martinez JP, Olmos S, Laguna P. Evaluation of an ECG Waveform Detector On The QT Database. Comp Cardiol 2000;27:81-84.
|


 This work is licensed under a Creative Commons Attribution-NonCommercial 4.0 International License