IJCRR - 13(6), March, 2021
Pages: 161-166
Date of Publication: 20-Mar-2021
Print Article
Download XML Download PDF
Classification of Algorithms Supported Factual Knowledge Recovery from Cardiac Data Set
Author: M. Sivakami, P. Prabhu
Category: Healthcare
Abstract:Introduction: Improvised modern lifestyle with more fascination towards fast food causes severe anxieties over human health standards. This renders the society to visit the physicians often, which in turn generates terabytes of diagnostic data. The stored data on critical mining using algorithm provides a wealth of information to clinicians and back them to execute a better treatment. Heart disease rank's first among the charted ailments due to its life-threatening concerns. Objectives: In the present work mining of cardiac data sets obtained from the University of California Irvine (UCI) repository was done using algorithms such as Linear Regression, Naive Bayes and Decision Stump algorithms in Waikato Environment for Knowledge Analysis (WEKA) environment. Result and Conclusion: The obtained results concluded that the Naive Bayes classifier offered the highest accuracy with specificity among the studied algorithms
Keywords: Decision stump, Heart disease, Linear regression, Mining, Naive Bayes
Full Text:
INTRODUCTION
Cardiovascular disease (CVD) is a disease of the heart which results in the reduction of blood flow to the heart and the body due to fatty deposits in arteries. CVD causes a major life threat among the various diseases noticed worldwide. Coronary heart disease, stroke and peripheral arterial disease1,2 are the three major types of heart disease. Globally a handful of people are suffering from CVD and volumes of data are generated clinically for treatment. Machine learning of created data provides valuable information for physicians. However, the mining of healthcare data had many challenges due to its veracity. The application of a proper mining algorithm in a versatile tool will solve this problem to a maximum extent and provides viable information to clinicians. In this paper, we explore how the data mining techniques help predict heart diseases by classification algorithms such as linear regression algorithms, Naive Bayes and Decision Stump. Based on the attributes the classifier’s accuracy level is reported.
A handful of authors have worked a lot whose some of the recent contributions are listed here. Mukherjee et al. analyzed 270 clinical records relating to heart disease by machine learning approach.3 The crucial risk factor were taken into account from patient case history and diagnosis was done using Support Vector Machines (SVM), Multi-Layer Perceptron ensembles (MLPE) classifiers and Generalized additive model (GAM) regression technique. The decision support system arrived using the above techniques were meaningful.3 Navies Bayes, Linear regression and K-means algorithm are the techniques employed by Swaminathan et al. for analyzing the data of diabetic children. The designed model exhibits a maximum accuracy of 96%.4 Fact of finding methods on heart disease dataset was carried out by using algorithms such as k-means, WAC, prediction tree c5 whose results are arguable.5,6 Thomas et al. underwent a survey for predicting the risk level of heart-related persons based on their clinical assessments by employing Naive Bayes, KNM, DT, Neural Network algorithms. The Result showed that the accuracy level increases with the increase of clinical attributes.7 Patil et al. proposed an efficient approach for the mining of heart disease dataset using the k-means clustering algorithm and MAFIA algorithm are obtained significance relation in predicting heart attack from the dataset.8 Meaningful information in finding out heart patients before proceeding to serious conditions was done by Chadva et al. and successfully implemented with effectiveness.9 Tuli et al. developed a framework called Healthfog by ensemble deep learning in an edge computing device for the prediction of heart disease in a user-friendly manner.10 Prabhu et.al. analyzed among various classification techniques such as Naïve Bayes, Logistic regression, deep belief network SVM, Random Forest, Neural Network and Decision Tree and proposed that the deep belief network model produced the highest accuracy in predicting the patients affected by diabetic complaints.11 Prabhu et.al. employed Self Organizing Map (SOM) Back-Propagation Network (BPN), kmeans-Back Propagation Network, Fuzzy C Means-Back Propagation Network on MovieLens datasets and concluded that Self Organizing Map Back-Propagation Network algorithms mines effectively the studied data. Among the studied algorithm Self Organizing Map Back-Propagation Network method produces the precision level of 85%.12
MATERIALS AND METHODS
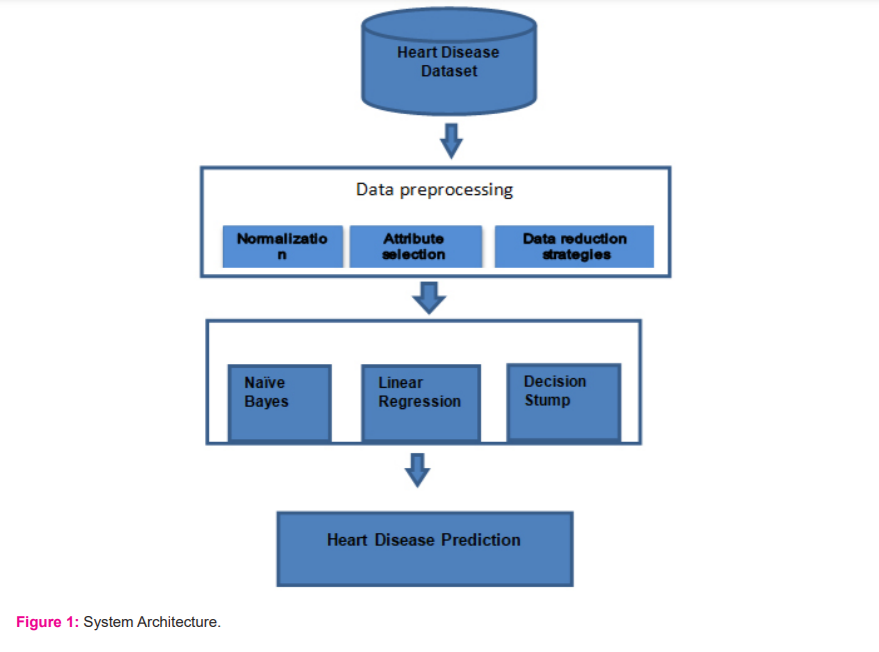
System Architecture
The system architecture is depicted in Figure 1. In this paper classification technique such as Linear Regression, Naive Bayes and Decision Stump are analyzed and the algorithm with the highest accuracy is to be reported.
Data Set Description
There are 14 attributes used in the present system, which includes 8 symbolic features and 6 numeric features. They are age (Continuous), sex (Discrete), chest pain type (Discrete), rest blood pressure (Discrete), serum cholesterol (Continuous), fasting blood sugar (Discrete), resting electrocardiogram (Continuous), maximum heart rate (Continuous), exercise-induced angina (Discrete), old peak (Continuous), slope (Discrete), major vessel (Continuous), thal(Discrete) and irreversible defect class(Discrete). The data employed are Cleveland data set obtained from the UCI machine learning repository. The above said attributes are taken into consideration for predicting heart diseases. 303 instances are considered as trained data after preprocessing. Moreover, the trained data set are tested by 10 fold cross-validation and the predicted accuracy are reported here.
Preprocessing
Data sets are preprocessed by cleaning, transformation and reduction methods. Normalization
Cleaning of data was done manually on 303 instances.
Attribute Selection
By the method of attribute selection data, the transformation was done to make the classification process methodological. A new attribute named class was added to the already existing attribute in the Cleveland dataset to mine the records by Naive Bayes and Decision Stump classifier
Data Reduction
Reduced representation of the data set was done by data reduction strategies. Out of the fourteen attributes used for the present study prediction of heart disease by linear regression analysis employed diagnosis of heart disease as a prediction parameter.
Linear Regression
Regression analysis is a method of numerical prediction in which the model builds a relationship between the predictor (independent) and response (dependent) variable. One such method is linear regression whose predictor variable(y) is connected to response variables(x) as follows.
Y=W0+W1X
PSEUDOCODE
Step 1:
Assign values for variable Ai and Bi.
Step 2:
The average is calculated for the variable Ai as a= (A1 +A2 +……..+ Ai)/ Ai
Step 3:
Find the average for the variable Bi such that b= (B1 +B2 +……..+ Bi )/ Bi
Step4:
Regression coefficient β is calculated by substituting Ai, Bi values and the average of Ai &Bi in equation 2
Step 5:
Find the regression coefficients value α by substituting the values of β as per in step 4 and also find out the average values for Ai and Bi.
Step 6:
The value of regression coefficients α and β is calculated using the equation B= α + βA.
Decision Stump
It is a decision tree that splits the root at one level leading to leaf nodes. The tree splitting is based on a specific attribute/ value pair.
PSEUDOCODE
1. Analyze the best attribute and consider it as a root of the tree.
2. Divide the training set into subsets.
3. Do step 1 and 2 on every subset until getting the leaf node in all branches.
Naive Bayes Classifier
A Bayesian classifier is a learning agent which builds a probabilistically model based on observed variables. Using the model, classification of latent variable which is probabilistically related to the observed variable is done. Thus the classification results in inference. The easiest case is the Naïve Bayesian classifier which works in a supervised manner. The classifier objective is to predict accurately an incoming test instance using the class label of the training instance. The bayesian equation is given as
P(H|X)=P(X|H)P(H)
--------------
P(X)
Where H is the prediction of an event whose results is based on certain confirmed instances (X).
PSEUDOCODE
Input:
Consider T as Training data
Predictor variable in testing dataset is considered as A = (a1, a2, a3…. an)
Output:
Set of testing data;
Steps:
1. Get the training dataset TD;
2. Mean and standard deviation for the predictor variables is calculated;
3. The process is executed again
a) Find out the probability of ai using the gauss density equation in every class;
b) Until the probability of all predictor variables (a1, a2, a3…an) has been calculated.
4. The likelihood for every class is calculated;
5. Identify the highest likelihood;
EXPERIMENTAL SETUP
WEKA Tool
In this paper, the WEKA tool is used to analyze the prescribed attributes. WEKA is assembled with a lot of machine learning algorithms. The same algorithms can be applied openly to the Testing and Training data. WEKA tool encompasses Classification, Clustering, Association, Regression and visualization. The prediction can be calculated in the form of accuracy, precision, sensitivity and specificity as mentioned as following.
a. Accuracy = (TP+TN)/ (TP+TN+FP+FN)
b. Precision = TP / (TP + FP)
c. Sensitivity = TP / (TP + FN)
d. Specificity = TN / (FP + TN)
Where
-
TP (True Positive): Represents the number of records categorized as true while they were really true.
-
FN (False Negative): Represents the number of records categorized as false while they were true.
-
FP (False Positive): Represents the number of records categorized as true while they were false.
-
TN (True Negative): Represents the number of records categorized as false while they were false.
The determined outputs are presented as a confusion matrix and the flow of system architecture is depicted in Figure 1.
RESULTS AND DISCUSSION
Performance of Linear Regression Algorithms
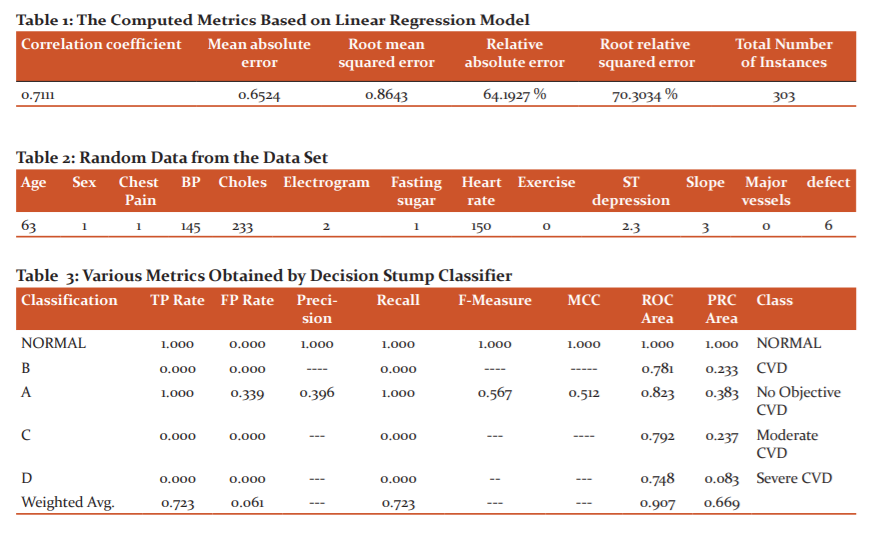
The results obtained using regression analysis in the employed tool is given in Table 1. The classifier outlined the diagnostic equation with nine attributes as against the fourteen mined attributes whose regression expression is of the form
Diagnosis of heart disease = 0.1804 * Sex + 0.2006 * Chest Pain Type +0.0984 * resting electrocardiographic results -0.0041 * maximum heart rate achieved + 0.259 * exercise induced angina + 0.2006 * ST depression induced by exercise relative to rest + 0.1583 * the slope of the peak exercise ST segment +0.4084 * number of major vessels impairment + 0.1394 * defect -0.78.
The tenfold cross-validation expression has an RMSE (Root Mean Square Error) value of 0.8643. The value however seems to be arguable. On applying a said tuple of the trained dataset (Table 2) we obtained the result as 0.0564 as depicted below (Table 4 and 5).
Diagnosis of heart disease = 0.1804 × 1 + 0.2006 × 1 + 0.0984 × 2 - 0.0041 × 150 + 0.259 × 0 + 0.2006 × 2.3 + 0.1583 × 3 + 0.4084 × 0 + 0.1394 × 6 - 0.78 = 0.0564.
The obtained results do not correlate exactly with the given data set whose assigned value in the tuple is 0. The mined data has a correlation coefficient of 0.7111 which signifies to proceed for another classifier (Table 2).
Mined Results of Decision Stump Algorithm
Decision Stump is a machine learning algorithms in which the root node is directly connected with the terminal nodes. It provides a one-level decision tree based on a single input feature. In the present study mining using the Decision stump on the given dataset was done for diagnosis of heart disease and computed results are shown in Table 3. Based on the attributes, the classifier correctly classifies 219 instances out of 303 tuples which equates to 72% of validity. The area under ROC (Receiver operating characteristics) curve was found to be 0.907 which makes the prediction acceptable. The RMSE value calculated was 0.2544 which means that the square root of the variance of the residuals was lower and the suggested model provides a better response. Based on the confusion matrix the selectivity and sensitivity were calculated (Table 3).
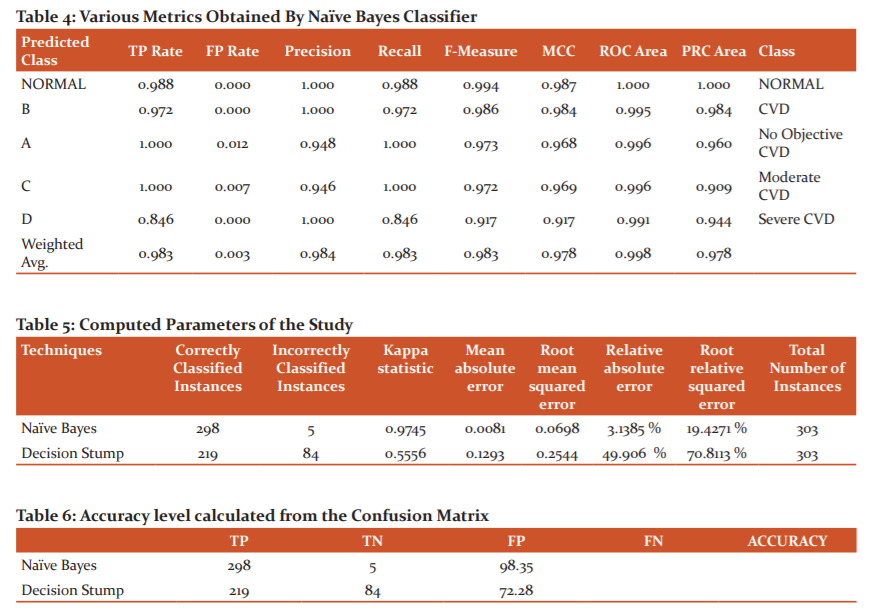
The output of the Naive Bayes Algorithm
Bayes is a highly flexible and robust classifier whose predicting ability is more attentive than explanatory ability 11 and computed results from the employed tool are depicted in Table 4. The model exhibits 0.998 under the ROC curve, which signifies that the probability of a randomly chosen positive instance will be 0.998 more highly than a randomly chosen negative instance. The classifier provides a sensitivity of 98.35%, such that 298 patients are correctly predicted as heart patients in the given data set of 303 instances (Table 4).
CONCLUSION
The present study was aimed to predict the heart patients by Linear Regression, Decision stump and Naive Bayes in Cleveland data set obtained from UCI machine learning repository. The study concluded that the Naive Bayes classifier optimizes the data set with an accuracy level of 98.35% as compared to the Decision Stump of 72.28% and Linear Regression of 71.11% (Table 4). The data sets can be further employed in hybrid models by combining classifier whose output may be better than the currently predicted. The statistical parameters obtained using the techniques Decision Stump and Naive Bayes are presented in Table 5. The measured accuracy level by employing the confusion matrix of Decision Stump and Naive Bayes algorithms are shown in Table 6. Figure 2 depicts the various accuracy levels of the studied algorithms.
FUTURE SCOPE
For future work, the real patient’s data will be taken and a large volume of data is also taken into the account. The hybrid model of data mining techniques will be effectively utilized to detect the accurate prediction of heart diseases.
ACKNOWLEDGEMENTS
This research work was carried out with the financial support of the RUSA-Phase 2.0 grant sanctioned vide Letter No. F24-51 / 2014-U, Policy (TNMulti-Gen) Dept. of Edn. Govt of India, Dt.09.10.2018 at Alagappa University, Karaikudi, Tamilnadu, India.
CONFLICT OF INTEREST
There are no relevant financial or non-financial competing interests to report.

References:
-
Tan P, Steinbach, M, Kumar, V. Introduction to Data Mining. Kindle Edition, Pearson India Education Services Pvt. Ltd, 2006.
-
Hussain S, Dahan NA, Alwi F. Ribata N. Educational Data Mining and Analysis of Students' Academic Performance Using WEKA. Indo J Elec Engg Comp Sci 2018;9:447-459.
-
Mukherjee S, Kapoor S, Banerjee P. Diagnosis and Identification of Risk Factors for Heart Disease Patients Using Generalized Additive Model and Data Mining Techniques. J Cardiovasc Dis Res 2017;8:137-144.
-
Saminathan K. Prediction of Type 1 Diabetes Mellitus using Data mining Techniques. Inter. J Engg Adv Tech 2019; 9(1):884-887.
-
Rajalakshmi K, Nirmala K. Heart Disease Prediction with Map Reduce by using Weighted Association Classifier and K-Means. Ind J Sci Tech 2016;9(1):231-237.
-
Jagtap SB, Kodge BG. Census Data Mining and Data Analysis using WEKA. Int Con Emerg Trends Sci Tech Manag 2013;4:35–40.
-
Thomas, J, Theresa Princy, R. Human Heart Disease Prediction System using Data Mining Techniques, International Conference on Circuit, Power and Computing Technologies, Nagercoil, India. 2016.
-
Patil SB, Kumaraswamy YS. Extraction of Significant Patterns from Heart Disease Warehouses for Heart Attack. Inter. J Comp Sci Netw Secur 2009;9(2):228-235.
-
Chadva PP, Pithadia YM, Bhavsar HH, Kotecha R. Early detection of cardiac disease using machine learning, 2nd International Conference on Advances in Science & Technology, Mumbai, India. 2019.
-
Tuli S, Basumatary N, Gill SS, Kahani M, Arya RC, Wander GS, Buyya, R. HealthFog: An Ensemble Deep Learning-based Smart Healthcare System for automatic Diagnosis of Heart Diseases in Integrated IoT and Fog Computing Environments. Future Gener Comp Sys 2020; 104:187-200.
-
Prabhu P, Selvabharathi S. Deep Belief Neural Network Model for Prediction of Diabetes Mellitus. 3rd International Conference on Imaging, Signal Processing and Communication. 2019:138–142.
-
Prabhu P, Anbazhagan N. A Neural Network Based Collaborative Filtering Model. Int J Sci Tech Mgmt 2015; 4 (1); 164-175.
|
 IJCRR
IJCRR 


 This work is licensed under a Creative Commons Attribution-NonCommercial 4.0 International License


