IJCRR - 13(5), March, 2021
Pages: 20-25
Date of Publication: 03-Mar-2021
Print Article
Download XML Download PDF
Study of Factors Affecting Nutritional Status of Children Aged 1-5 Years Attending a Tertiary Hospital
Author: V Nandhija Devi, Kishore Narayan, Balamma Sujatha, Nazeem Fathima, Rajesh S, Santhosh Kumar T
Category: Healthcare
Abstract:Introduction: Anthropometric measures are clinical tools that help to identify the nutritional status of a child. Poor nutritional status of a child might be due to poor diet or due to repeated childhood infections. Objective: This study was done to find the correlation between anthropometric measures with nutritional history and acute infectious disease rate in children aged 1-5 years. Methods: 100 children between age 1-5 years old attending the pediatric OPD were enrolled. Information was collected in a semi-structured questionnaire. Detailed history regarding the antenatal factors, birth weight, and breast-feeding, the nutritional history of the child was obtained. Sickness like diarrhoea and lower respiratory tract infection incidence in the past year were documented. The anthropometry measures noted and HAZ, WAZ scores and Weight for length/height were plotted in WHO charts. Stunting, underweight and wasting were inferred from the charts based on the WHO definition. The collected data were analysed with sigma plot 13(system software, USA). Results: Exclusive breastfeeding for 6 months was practised by 77% of mothers. The total duration of breastfeeding and consumption of eggs have a statistically significant effect on anthropometry. Conclusion: Longer duration of breastfeeding has a positive effect on anthropometry. Consumption of eggs increases the chances of a child being of normal height.
Keywords: Anthropometry, Breastfeeding, HAZ, WAZ, Nutrition, Infection
Full Text:
INTRODUCTION
Anthropometry is the scientific study of body proportions. Anthropometric measures like weight, height and specific measures of Paediatric interest like mid-arm circumference and head circumference etc are clinical tools that help evaluate the physical health of an individual. In developing countries, growth deficits are caused by two preventable factors, inadequate food and infections.1,2 Anthropometry parameters like Height for age Z (HAZ) scores, Weight for age Z scores (WAZ), Weight for length/height Z scores and Mid arm circumference (MAC) can help to evaluate nutritional status as well as susceptibility to infections. These measures help in detecting both acute and chronic malnutrition.
Given that the common and preventable illnesses in this age group involve benign illnesses of the respiratory tract and gastrointestinal system, the susceptibility of the child to such illnesses can be assessed by periodic anthropometric measurement as well as the effect of infection on anthropometry. It is also an eventual observation that the illnesses would result in a corollary of poor anthropometric measures in the child, who then now become susceptible to illnesses at a greater rate than the normal, setting off a vicious cycle.3,4
The morbidity and mortality from acute respiratory illness and diarrhoea can be reduced to a large extent by appropriate nutritional interventions.3The accumulated results from a large number of studies are consistent in showing that low values of anthropometric indicators are associated with a high risk of mortality as well as with a high incidence of a long duration of diarrhoea and other diseases among children.5, 6 Weight-for-height, height-for-age, and weight-for-age are the primary means of assessing anthropometry as per WHO recommendations.By WHO definitionWeight-for-Agereflects body mass relative to chronological age and the child is classified as normal or under-weight.7Height-for-Agereflects height relative to chronological age. Stunted growth reflects a failure to reach linear growth potential as a result of sub-optimal health or nutritional conditions and usually indicates chronicity.
Weight-for-Heightreflects body mass relative to the height; it is a measure of acute or short term exposure to a negative environment. It is sensitive to calorie intake or the effects of the disease. Wasting is the first response to nutritional and/or infectious insult. Mid upper arm circumference > 12.5cm is considered normal according to WHO guidelines for children aged 12 months to 60 months. A value <12.5cm is considered as moderate malnutrition and <11.5cm as severe malnutrition.
Since malnourished children are more susceptible to infectious processes and present a series of pathophysiological peculiarities, diagnosis, follow up and care/attention are of utmost importance to reduce the time of in-hospital treatment and morbidity and mortality rates.The government of India has launched multiple programs to combat childhood malnutrition like, antenatal care under national health mission, promotion of institutional deliveries, universal immunization, promotion of exclusive breast feeding, dietary supplements by way of Balwadi and Integrated Child Development Services ICDS. This study was undertaken to find the nutritional status of children at present and see if the programs have had a positive effect on childhood nutrition.8
MATERIALS AND METHODS
After obtaining clearance from the institutional review board (SMC/IEC/2019/01/264) a prospective descriptive study was done in the Out-Patient Department of Paediatrics at Saveetha Medical Hospital, a tertiary care centre, catering to suburban population. This prospective study was carried out from January 2019 to April 2019. A total of 100 well children who presented to the paediatric OPD for well-baby clinic, immunization clinic or with minor ailments like upper respiratory tract infection, skin infection were enrolled consecutively. After getting informed consent from the guardian, a detailed history regarding the antenatal, nutritional status and supplement intake of the mother, spacing of childbirth, birth weight and breastfeeding history was noted. Detailed nutritional history and nutritional supplementation of the child was obtained. Sickness like diarrhoea and lower respiratory tract infection incidence in the past year were documented. The anthropometry of the child noted and Height for Age Z scores(HAZ) and Weight for Age Z scores (WAZ) scores were plotted in WHO charts. Values falling below -2SD is considered as stunting and underweight respectively according to WHO definition. Weight for length/height plotted based on WHO charts. A value >-2SD is normal, <-2SD is moderate wasting and <-3SD is severe wasting. MUAC was also plotted.
Inclusion criteria
Developmentally normal children aged between 1-5 years, who attend the paediatric OPD of SMCH.
Exclusion criteria
Children, who had developmental delay and other chronic illness like cerebral palsy, congenital heart disease, chronic renal diseases etc., were excluded from the study.
Statistical analysis
The collected data were analysed with sigma plot 13(system software, USA). To describe the data descriptive statistics frequency analysis, percentage analysis was used for categorical variables and the mean & SD were used for continuous variables. To find the significance in categorical data Fisher’s exact test was used. In the above statistical tools, the probability value <0.05 was considered as significant.
RESULTS
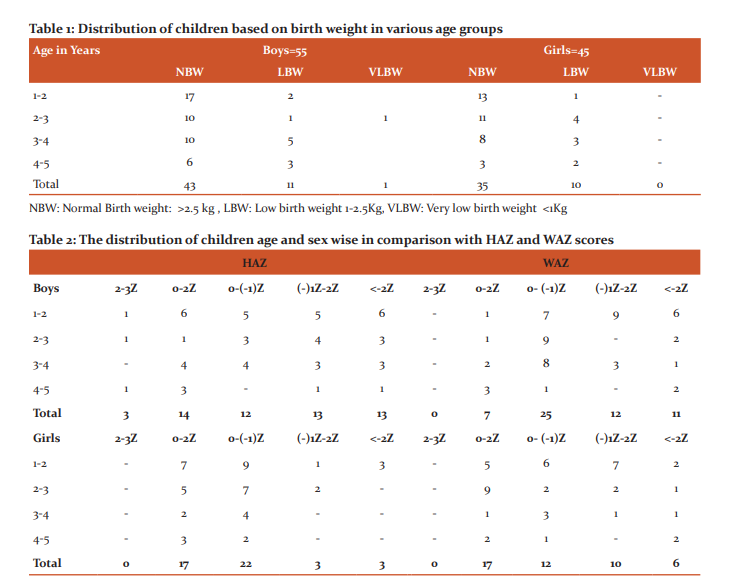
A total of 100 children were included of which 55 were boys and 45 were girls. Birth weight in relation to age and sex distribution is depicted in Table 1. Most of the children were of first or second order birth, only 3% of them were of 3rd birth order. 21% of children were low birth weight and only one child was from the very low birth weight category.
The HAZ and WAZ in various age groups are depicted in Table 2. Analysis of HAZ shows only 3% of children had >2SD height and all were boys. Only 31% of children were on the positive side of the normal curve. 16% of children were below the – 2SD curve and 50% of children were on the negative side of the normal curve. Analyzing the data concerning sex we find that 20% (11) of boys and 13% (6) of girls are below the -2SD curve. Further analyzing we find that 47% of boys and 13% of girls fall below -1SD curve. The Height for age was less than -2SD in 23% of boys and 6% of girls, meaning they were stunted and had not attained their potential height.
When considering weight only 24% of children were on the positive side of the normal curve and no one was more than 2SD. 17% of children were below the -2SD curve. 59% of children were on the negative side of the normal curve concerning WAZ scores. With regards to Weight for age, 20% of boys and 13% of girls were underweight. 41% of boys and 35% of girls were below the -1SD curve. Moderate and severe wasting together was present in 16% of boys and 13% of girls. This shows that the majority of children are in a precarious nutritional status and any insult like an acute infection can push them below the -2SD curve.
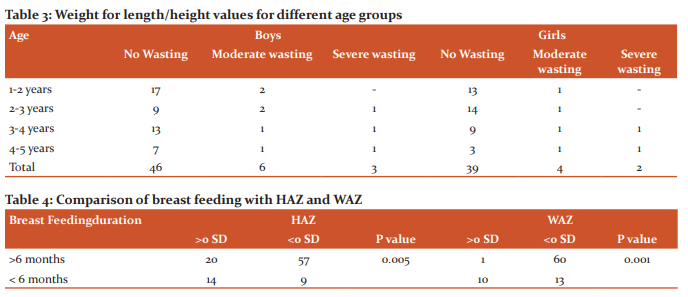
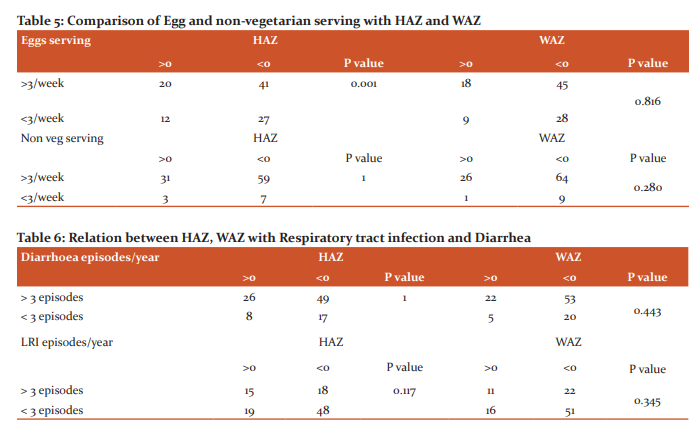
The weight for length/height of the children in different age groups is depicted in Table 3. 16% of boys and 13% of girls are moderate to severely wasted. None of the children had malnutrition if Mid Arm Circumference (MAC) alone was considered. With regards to Mid-arm circumference, 98% of children had a normal MAC of >13.5 cm. In our study, MAC does not correlate well with the nutritional status as compared with HAZ and WAZ.94% of the mothers of the study population had regular antenatal checkups and took Iron and Folic acid supplements.67% of women had Antenatal weight gain of >10 Kg and 31% had a weight gain between 8-10 Kg.Only 2% had weight gain<8 Kg.8 The mode of delivery was LSCS in 55% and rest were born by normal vaginal delivery (NVD). 4% of children were born preterm. Immunization coverage was around97% based on the national immunization schedule. 77% of the mother’s exclusively breastfed their babies for 6 months, 20% for 3-6 months, 2% <3 months and 1% didn’t breastfeed at all.The relationship between the total duration of breastfeeding and HAZ and WAZ is depicted in Table 4. The comparison of egg and non-vegetarian food intake with HAZ and WAZ is depicted in Table 5. Comparison of HAZ and WAZ with an illness like diarrhoea and Lower respiratory tract infection is depicted in Table 6. Acute illness is common in the study population with more than 25% of them having more than 3 episodes of diarrhoea in a year and 67% of children have more than 3 episodes of lower respiratory tract infections. However, there is no statistical significance with HAZ or WAZ with sickness rate.
DISCUSSION
The present study was conducted in a hospital catering to Kancheepuram district, showed that 94% of the mothers had a complete antenatal check-up, 100% had institutional deliveries.All children were immunized (100%) withBacilleCalmette Guerin (BCG).Only 3% of children did not have the full schedule of Diphtheria PertusisTetanus (DPT) measles and Oral polio vaccine (OPV). The coverage for DPT, measles and OPV was 97%. The percentage of children, who were stunted, wasted and underweight was 16%, 15%, and 17% respectively. The comparative data from The National Family Health Survey 4 2015-20169 for Kancheepuram district, Tamilnadu state are, the mother who had complete antenatal check-ups was 39.4 %, institutional birth 99.2%, BCG 96.2%, DPT, measles and oral polio 85%, children who were stunted 23.5%, wasted 14% and underweight 17%. This shows that the data are comparable with the NFHS-4. Stunting was the only parameter which was relatively lower in the present study as compared to NFHS-4.
A similar study was carried out by Gupta in Haryana in 2019.10 The relative percentage of the various parameter in comparison with Gupta et al are as follows, stunting 16% vs. 41.3%, wasting 14% vs. 18.4% and underweight 17% vs. 38.3%. Overall the nutritional status of the present study population is better. This could be because the present study was done in a hospital where generally people with health-seeking behaviour come, whereas Gupta et al. study was done at the community level. Their study was about Composite index of anthropometric failure and it did not have data regarding factors affecting nutritional status.
Comparing the present study with the results of the study done by Sinha T11in rural Chhattisgarh in the year 2017, stunting was 16% vs. 40.7%, wasting 14% vs. 29.3% and under-weight 17% vs. 44.3%. 80% of mothers received complete antenatal care as against 94% in the present study. With regards to breastfeeding, exclusive breastfeeding was 77% in the present study and 90% in their study. However, they have not compared any of the factors with anthropometry. The immunization coverage is relatively better in the present study as compared to the study by Sinha T, where only around 40% received the three doses of DPT as against 97% in the present study. This could be due to the study being done at a tribal area with poor health care structure and relatively strong primary health care system in Tamilnadu.
Ansuya et al.12 did a case-control study in rural Karnataka by comparing factors affecting nutritional status in malnourished and normal children. In their study, they found statistical significance for various factors like breastfeeding, recurrent diarrhoea, respiratory infections with anthropometry measures. In the present study statistical significance was found for the duration of breastfeeding and consumption of eggs only. However, in their study, they have included only under-weight children and stunting and wasting have not been taken into account.
Bhagwat B13 did a study on feeding practices and nutritional status in the year 2017 in urban Karnataka. In their study, they found statistical significance in children who consumed eggs with Weight for Age Z score(WAZ) and no significance with Height for Age Z score(HAZ). Whereas the present study significance was seen with regards to HAZ and not WAZ. With regards to breastfeeding, they have compared only the initiation of breastfeeding and not the total duration of breastfeeding. In that, they found statistical significance with WAZ. In the present study statistical significance was found for both HAZ and WAZ with increased duration of breastfeeding. They got significant values when comparing the consumption of meat with HAZ. In the present study, no statistical significance was found between consumption of meat and anthropometry. The study catered to only children aged between 1-2 years whereas the present study was among children 1-5 years.
A study conducted by Algur V14, in Bijapur, Karnataka found that 66% of the children were malnourished based on IAP classification. In the present study, it is only 16%. In their study, 45.2% of children had malnutrition based on MAC whereas, in the present study, only 1% had malnutrition based on MAC. Immunization cover was only 85% as compared to 97% in the present study. This difference could be attributed due to the study being done at different periods and IAP charts used in Algur study and WHO charts in the present study. One more reason could be the well structured Government medical services in Tamil Nadu.
CONCLUSION
In the study population, 20% of boys and 13% of girls are stunted and 16% of boys and 13% of girls have wasted.On average, around 80% of children have normal weight and height though on the lower side. Longer duration of breastfeeding has a positive effect on anthropometry. Consumption of eggs increases the chances of a child being of normal height. The overall immunization coverage is more than 90% inthe study population.
Acknowledgement: Authors acknowledge the immense help received from the scholars whose articles are cited and included in references to this manuscript. The authors are also grateful to authors/editors/publishers of all those articles, journals and books from where the literature for this article has been reviewed and discussed."
There is no conflict of interest and no funding has been received for this study.
Authors’s contribution
Dr V Nandhija Devi: Clinical Study
Dr Kishore Narayan: Study Design, Literature Review
Dr Balamma Sujatha: Manuscript preparation, Guarantor
Dr NazeemFathima: Clinical Study
Dr Rajesh S: Manuscript editing and review
DrSanthosh T: Data and Statistical analysis
References:
-
Guerrant RL, Schorling JB, McAuliffe JF, de Souza MA. Diarrhea as a cause and an effect of malnutrition: diarrhea prevents catch-up growth and malnutrition increases diarrhoea frequency and duration. Am J Trop Med Hyg1992;47:28-35.
-
WHO Working Group. Use and interpretation of anthropometric indicators of nutritional status. WHO Working Group. Bull World Health Organ 1986;64(6):929-941.
-
Walson JL, Berkley JA. The impact of malnutrition on childhood infections. CurrOpin Infect Dis 2018;31(3):231-236.
-
Rice Al, Sacco L, Hyder A, Black RE. Malnutrition as an underlying cause of childhood deaths associated with infections diseases in developing countries. Bull World Health Organ 2005;78:1207-1221.
-
Pelletier DL. The relationship between child anthropometry and mortality in developing countries: implications for policy, programs and future research. J Nutr. 1994;124(10 Suppl):2047S-2081S.
-
Schroeder DG, Brown KH. Nutritional status as a predictor of survival: summarizing the association and quantifying its global impact. Bull World Health Organization 1994;72(4):569-579.
-
World Health Organization. Management of severe malnutrition: a manual for physicians and other senior health works. Geneva: WHO; 1999
-
Park K. Park's textbook of Preventive and Social Medicine. 25th edition. Chapter 10, 2019; p 577.
-
International institute for population sciences. National family health survey (NFHS-4), 205-16; India.vol.1.mumbai, India; IIPS; 2017 available from: http://www.rchiips.org/nfhs/report.shtml. last accessed on 2020 September
-
Gupta V, Chawla S, Mohapatra D. Nutritional assessment among children (1-5 years of age) using various anthropometric indices in a rural area of Haryana, India. Indian J Community Fam Med 2019;5:39-45.
-
Sinha T, Singh G, Nag U. Nutritional Status of Children Under 5 Years in Tribal Villages of Bastar Chhattisgarh India. J Intern Med Prim Healthcare 2019;3:007.
-
Nayak BS, Unnikrishnan B, George A, Sashidhara YN, Mundkur SC.Risk factors for malnutrition among preschool children in rural Karnataka: a case-control study. BMC Public Health 2018;18:283.
-
Bhagwat B, ChandrashekarNooyi S, Krishnareddy D H, Murthy SN. Association of Practices Regarding Infant and Young Child Feeding with Anthropometry Measurements Among an Urban Population in Karnataka, India. Cureus. 2019;11(3): e4346.
-
Algur V, Yadavannavar MC, Patil SS. Assessment of Nutritional Status of Under Five Children in Urban Field Practice area. Int J Cur Res Rev 2012;04(22):122-126.
|
 IJCRR
IJCRR 


 This work is licensed under a Creative Commons Attribution-NonCommercial 4.0 International License


