IJCRR - 13(4), February, 2021
Pages: 70-75
Date of Publication: 16-Feb-2021
Print Article
Download XML Download PDF
Neurorespiratology: Respiratory Signal Analysis for Objective Assessment of Anxiety
Author: H. Haritha, R. Sarath Menon, A. Anand Kumar, C. Santhosh Kumar
Category: Healthcare
Abstract:Background: The physiology of respiration is modulated by autonomic efferent neurons and circulating hormones. Objective: We aim to compare the respiratory patterns in normal individuals, regular meditators and individuals with anxiety spectrum disorders, in an effort to automate the anxiety detection (AnD). Methods: Prospective cross sectional study which included 52 subjects, 20 normal population, 16 regular meditators and 16 subjects with anxiety disorders, was held at the Department of Neurology, Amrita Institute of Medical Sciences (AIMS), Kochi, Kerala, India (IEC: AIMS/2013/18). A 24 hours ambulatory monitoring of each subject was done during the sleep-wake cycle using the respiratory inductance plethysmography (RIP). We evaluated Respiratory Rate Variability (RRV), Thoraco-abdominal ratio (TAR%) and low frequency-high frequency ratio (LF/HF) for its effectiveness in AnD using p-values. Results: It was observed that RRV was lowest, TAR% and LF/HF ratios were highest in anxiety group compared to the meditation group (p=< 0.001). Further, we developed a AnD system with statistical features derived from the respiratory signal, and LF/ HF ratio as its input, with a support vector machine (SVM) backend classifier. With the use of efficient signal processing algorithms to remove the effect of patient-specific variations in the feature vectors derived from the respiratory signal, we were able to obtain a performance accuracy of 92.30% absolute. Conclusion: The study highlights that we can automate AnD, and thus minimize the effect of subjective factors in assessing AnD and consider the LF/HF ratio as a new surrogate marker for autonomic imbalance.
Keywords: Respiratory Signal Analysis, Respiratory Rate Variability, Ambulatory Respiratory Monitor, Coherent Breathing, Anxiety Detection System
Full Text:
Introduction
Manual measurements of RR and subjective assessment are the current standards of care for monitoring the respiratory status. However, these methods are highly inconsistent, depending on the clinician's level of expertise.1 Respiratory Rate measurement alone cannot guide us for early intervention in respiratory compromise.2 Hence it is necessary to validate a normal respiratory pattern which includes other respiratory parameters like RRV, TAR and LF/HF ratio, in non-intubated patients which would quantify adequacy of ventilation.3,4 No current technologies meet this requirement of noninvasively and accurately measuring and reporting the respiratory patterns. Such a device helps us for timely pickup and interventions during respiratory compromise with minimal complications, better safety profile and reduce healthcare cost.
Materials and Methods
Participants
The study was conducted over 2 years (October 2016 to October 2018) jointly by the Departments of Neurology & Psychiatry, Amrita Institute of Medical Sciences (AIMS), Kochi, Kerala, India and Machine Intelligence Research Lab, Amrita Vishwa Vidyapeetham, Coimbatore, India. The prospective cross-sectional study which included 52 subjects - 20 normal population, 16 regular meditators and 16 subjects with anxiety disorders diagnosed based on DSM V criteria.
The sex distribution and the age distribution of normal, meditation and anxiety groups are shown in Table 1 and Table 2 respectively.
All the subjects were evaluated based on their history and clinical examination and were grouped into 3 classes. Group 1 included normal individuals, who did not meet the criteria for any current psychiatric disorder and did not practice any meditation techniques. The subjects included in Group 2 (meditation group) were selected randomly from people who involved in mindfulness meditation technique (the combination of yoga and relaxation techniques), practising daily for 20 minutes for more than 6 months. The group 3 considered subjects with anxiety spectrum disorders, whose diagnosis was made based on DSM V (Diagnostic and Statistical Manual for Mental Disorders-V5 criteria by Department of Psychiatry, AIMS, Kochi, Kerala, India. 16 patients with anxiety spectrum disorders fitting to the inclusion criteria were included after psychiatric assessment, which comprised of 6 with a generalized anxiety disorder (GAD), 8 with panic disorders (PD), 1 patient with social phobia, 1 patient with GAD and Obsessive-Compulsive Disorder (OCD) traits.6
Procedure
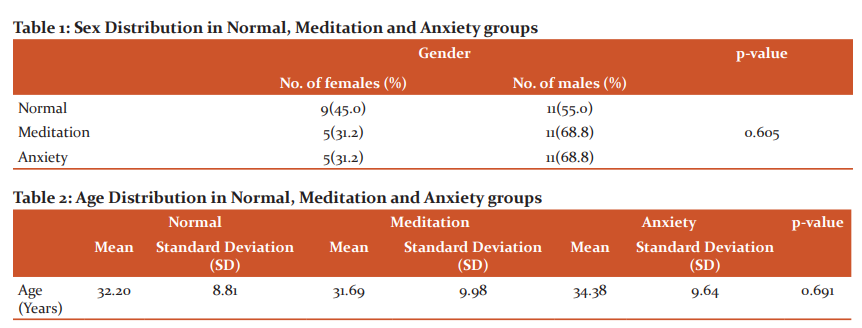
Written consent of all individuals was taken and the ethical issues were considered (IEC: AIMS/2013/18). No interventions or invasive procedures were carried out. After the diagnostic interview, participants received an individual appointment for a non-invasive set-up procedure in the informal environment of the Neurophysiology Lab at the Department of Neurology, AIMS, Kochi, Kerala, India starting at 8.00 AM. All the subjects were given a proforma to record all the activities carried out during 24 hours of study. The overall procedural setup of continuous ambulatory respiratory monitoring (CARM) is shown in Figure 1.
Feature Extraction
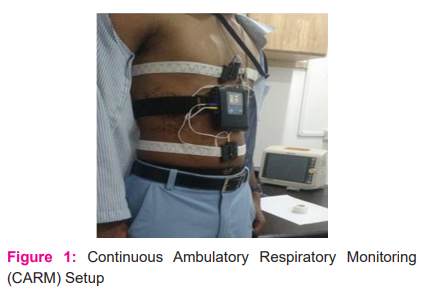
Respiratory Rate Variability (RRV)
RRV is the absolute value of the difference of successive periods of T1 and T2 i.e, absolute (T1-T2). Since units of the period are milliseconds, RRV also has units of milliseconds. Figure 2 shows the computation of RRV.
Respiratory Rate Variability (RRV%) = T2-T1T1 x 100
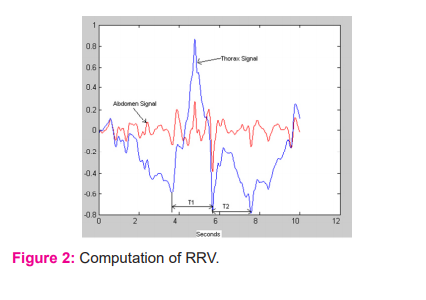
Horaco-abdominal Ratio (TAR)
TAR% gives a measure of relative expansion and contraction of Thorax to that of Abdomen. Figure 3 shows the computation of TAR.
LF/HF Ratio
Autonomic synergy and coherence suggest both the parasympathetic nervous system (PNS) and Sympathetic nervous system (SNS) competitively regulate respiration, where increased SNS activity is paired with decreased PNS activity and vice versa. The ratio of LF to HF power is called the LF/HF ratio. It is known that a low and high LF/HF ratio reflects greater parasympathetic activity and higher sympathetic activity, respectively. Hence the LF/HF ratio is also considered a marker for autonomic balance or adaptability7. The method that is adopted in this work for frequency domain analysis is Fast Lomb method.
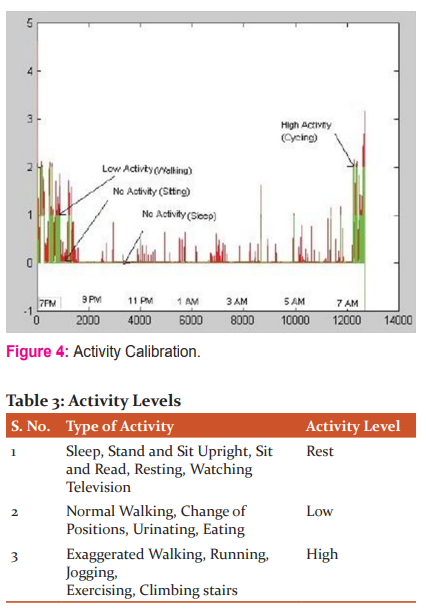
Activity Calibration
Using events recorded by the subjects and the activity information provided by the device, three different levels of activity were defined: No Activity (Rest), Low Activity, High Activity. Figure 5 shows part of the recording from 7 PM to 7.30 AM. The activity level between 1 and 2 is considered as low activity, below 1 and above 2 is considered as low and high activity, respectively. The defined activity threshold is indicated by green. The plot in red shows the activity information captured by the device.
The different activity levels are defined in table 3.
Statistical Analysis
The values of the study variables were expressed as mean and standard deviation (SD). To test the statistical significance of differences in values of variables, on an average, between two groups, Mann Whitney U test and among three groups, Kruskal-Wallis one way analysis of variance (ANOVA) followed by Bon-ferronis Multiple Comparison tests, were applied. To test the statistical significance of the differences in values of variables between two activities of the same individual, Wilcoxons Signed Rank test was applied. To test the statistical significance of the association of gender with the groups, the Chi-Square test was applied. The p-value bilaterally < 0.05 was significant.
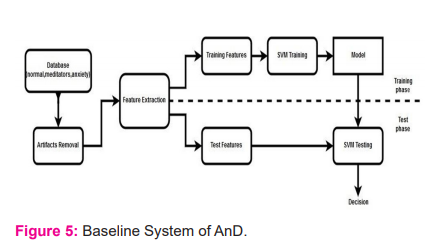
Anxiety Detection (AnD) System Description
Encouraged by the analysis of the respiratory signal, we then developed an AnD system using a respiratory signal as its input. Time and frequency domain statistical features8 derived from RRV is input to a support vector machine (SVM) backend classier.
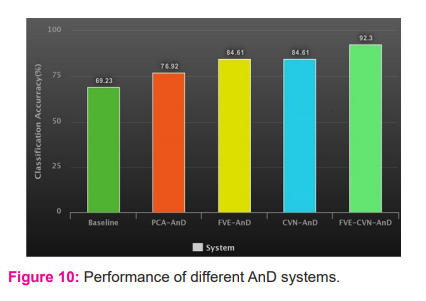
The methodology for the baseline system of AnD is shown in figure 5. It may be noted that for classification using SVM, either the features that match the kernel or the kernel that matches the features should be selected for optimum performance. Often, this process is very difficult, owing to the difficulty in identifying a matching kernel. Alternatively, we may transform the feature vectors to a higher dimensional linear space, and then use SVM with a linear kernel.9 We then explored several machine learning algorithms over the baseline system to improve the performance of AnD system. Any input feature vector can be refined using dimensionality reduction and feature transformation techniques. Hence, we used principal component analysis (PCA) for dimensionality reduction and hence to find the dimensions with significant information. It may be noted that there exist patient-specific variations in the feature vectors that affect the performance of the system adversely.
To make the feature space linearly separable, we experimented with a feature mapping technique using Fisher vector encoding (FVE). By using FVE to map input features to a higher dimension feature vector, we express every input feature vector in terms of parameters of a Gaussian mixture model (GMM) trained patient independently9. Further, the correlation between the features is reduced on using covariance normalization (CVN) which assumes that there exists an intrinsic relationship between the features. Subsequently, the feature mapping and feature normalization were combined and hence we obtained the expert system accuracy of 92.30% for FVE-CVN system.8
Results
In our study, the normal group had 55% of males and 45% females. The meditation group and anxiety groups had 68.8% males and 31.2% females. The differences were not statistically significant (p=0.605), the mean age of normal individuals, meditators and anxiety group were 32.2 years, 31.69 years, 34.38 years, respectively. This difference was not statistically significant (p=0.691).
RRV
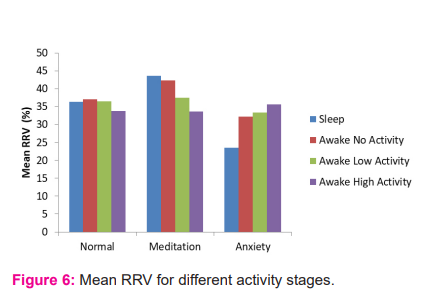
The study showed mean RRV during sleep in normal, meditation, anxiety groups were 36.34%, 43.60%, 23.51% respectively. The difference seen in the normal group compared to meditation and anxiety groups and meditation group to anxiety group during sleep were statistically significant (p=0.013, <0.001, <0.001). The mean RRV during rest in normal, meditation, anxiety groups were 37.12%, 42.38%, 32.28% respectively. The difference between meditation and anxiety groups was statistically significant (p=<0.001). Figure 6 shows the variation in mean RRV of normal individuals, regular meditators and individuals with anxiety disorders, during different activity stages.
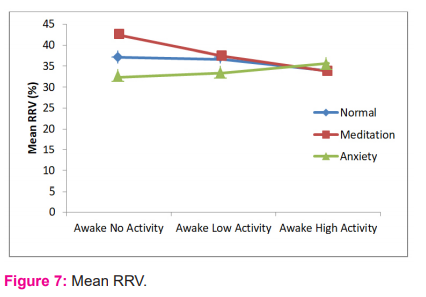
In the normal group, the difference between mean RRV during high activity and rest was statistically significant (p=0.028). In meditation group, the study showed the differences between mean RRV during both low activity, high activity and mean RRV during rest were found to be statistically significant (p=<0.001). In an anxiety group, the study showed a statistically significant difference between mean RRV during high activity and rest (p=0.005). Figure 7 shows the trend in mean RRV of normal individuals, regular meditators and individuals with anxiety disorders.
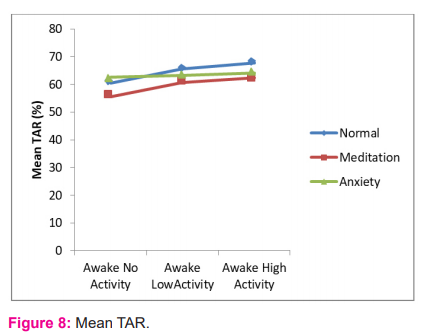
TAR
Mean TAR during sleep in normal, meditation, anxiety groups were 54.18%, 47.56%, 55.86% respectively. Mean TAR during rest in the 3 groups were 60.40%, 55.53%, 62.49% respectively. The difference between meditation and anxiety groups were statistically significant (p=0.048). Our study showed the difference between mean TAR during both awake low, high activities and mean % TAR during rest were statistically significant in normal and meditation groups (p=<0.001,<0.001 and p= 0.015, 0.003 respectively). Figure 8 shows the trend in mean TAR of normal individuals, regular meditators and individuals with anxiety disorders.
LF/HF
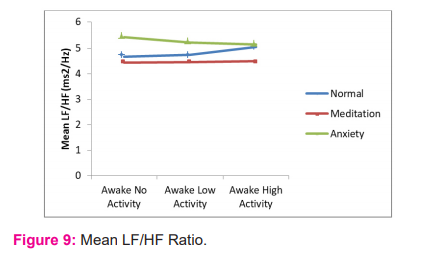
This study showed that mean LF/HF ratio was lowest in the meditation group and highest in anxiety group through the sleep-wake cycle. The study showed LF/HF ratio was almost same during physical activities in the meditation group, whereas in the normal group, LF/HF ratio increased during activities and in anxiety group, it got decreased during activities. Even though these differences were not statistically significant, we could see a different trend in all the 3 groups, as shown in figure 9.
Anxiety Detection System
Time and frequency domain statistical features were extracted and an SVM as the backend classifier was used. We obtained an accuracy of 69.23% for the baseline system. We used FVE for mapping the features to a higher dimensional linear space. FVE has also helped in removing the subject-specific variations in the statistical feature vector derived from the respiratory signal. Also, we examined PCA and CVN on the input and the transformed feature vectors, to reduce the effect of variations in the signal to improve the performance.
A performance improvement of 7.69%, 15.38% and 15.38% using PCA-AnD, FVE -AnD, CVN-AnD, respectively, over the base-line system, were obtained. Further, we combined FVE and CVN and obtained FVE-CVN system with a classification accuracy of 92.30%, which is 23.08% improvement over the baseline system.
Discussion
Since last few years, only a few studies have been carried out to study respiratory parameters in individuals using an ambulatory respiratory monitoring.6,10-12 Our study is a pilot study invalidating a normative respiratory pattern which emphasizes the importance of monitoring various respiratory parameters like RRV, TAR, LF/HF ratio, during the sleep-wake cycle and different physical activity levels using a 24 hr ambulatory respiratory monitor. Regarding the measurement instrument used, it should be emphasized that RIP is an appropriate method for evaluating breathing pattern and thoracoabdominal motion, because being an ambulatory device, the person is not constrained to be in a single position, and it has built-in sensors that record information of subject's body orientation and physical activity for 24 hours. Our results therefore were not confounded by possible anxiety-inducing aspects of a laboratory context.
The study showed subjects in meditation group showed higher RRV than other groups, which was more pronounced during sleep. The possible reason is meditation group had higher vagal tone compared to other groups. The study showed as physical activities increased, mean RRV% in anxiety group increased on physical activities. The reason might be as a patient with anxiety group engages in physical activities, resting sympathetic tone wanes off and there is increase vagal traffic. The study done by Pfaltz MC13 showed RRV values during activities in panic disorder patients were similar to normal, i.e, there was no decrease in RRV. The study showed sleep and resting RRV can be used as an index for sympathovagal balance.
The study showed that throughout the sleep-wake cycle, mean TAR was lowest in meditation group compared to others. This suggested people doing meditation had more abdominal breathing, which is a sign of effective respiration is influenced by vagal traffic. TAR% increased when the subject was in awake state & engages in physical activities. The study showed during activities, there was sympathetic activation. This suggests an autonomic imbalance or dysregulation in anxiety group which leads to more thoracic breathing and ineffective ventilation.
In this study, we found as individuals activity levels increases, LF/HF ratio decreases. This show, when a person’s activity level goes up, there is a shift to sympathetic activation from baseline and resting vagal tone. This study showed that mean LF/HF ratio was lowest in meditation group compared to others, which implies the meditation group had the lowest sympathetic traffic & highest inherent vagal tone. Further to the clinical trials in the study, we explored the development of a system for AnD using a respiratory signal as its input. It was seen that there is a clear distinction between the respiratory signal from the controls doing meditation, and those having a psychiatric disorder.
Conclusion
Our study is a phase I study that shows the importance of respiration in a state of coherence, well being and changes in respiratory parameters during autonomic regulation and sympathovagal activation. This emphasizes that respiration has both automatic (neural) and manual (voluntary) control, which makes it different from other systems. The anxiety detection (AnD) system developed using the normal population, regular meditators and individuals with anxiety disorders, validates our study. The study highlights that LF/HF ratio can be considered as a new surrogate marker for autonomic imbalance, and, by minimizing the effect of subjective factors, AnD can be automated. We would like to develop an ambulatory system with a bio-feedback mechanism for the detection of respiratory arrhythmias in our phase II study.
Acknowledgement: The authors would like to thank Dr. P.C. Kesavankutty Nayar, Dr. Chiranjeevi Kona, Dr. Akta Trivedi and Mr. Ajith from Amrita Institute of Medical Sciences (AIMS), Kochi, and Mr. Pradeep Kumar K.A. and Ms. Anjuprabha from Amrita School of Engineering, Coimbatore, for their help during this work. This research did not receive any specific grant from funding agencies in the public, commercial, or not-for-profit sectors. None of the authors declare any conflict of interest.
References:
[1] Hong W, Earnest A, Sultana P, Koh Z, Shahidah N, Ong ME. How accurate are vital signs in predicting clinical outcomes in critically ill emergency department patients? Eur J Emerg Med 2013;20(1):27-32.
[2] Ragnarsdóttir M, Kristinsdóttir EK. Breathing movements and breathing patterns among healthy men and women 20–69 years of age. Respiration 2006;73(1):48-54.
[3] Simoes EA, Roark R, Berman S, Esler LL, Murphy J. Respiratory rate: measurement of variability over time and accuracy at different counting periods. Arch Dis Childhood 1991;66(10):1199-1203.
[4] Vandana B, Vaidyanathan K, Saraswathy LA, Sundaram KR, Kumar H. Impact of integrated amrita meditation technique on adrenaline and cortisol levels in healthy volunteers. Evidence-Based Comple Altern Med 2011;2011.
[5] Vahia VN. Diagnostic and statistical manual of mental disorders: DSM-5. Indian J Psychiatry 2013;55(3): 220–223.
[6] Hoehn-Saric R, McLeod DR, Funderburk F, Kowalski P. Somatic symptoms and physiologic responses in generalized anxiety disorder and panic disorder: An ambulatory monitor study. Arch Gen Psychiatry 2004;61(9):913-921.
[7] Badra LJ, Cooke WH, Hoag JB, Crossman AA, Kuusela TA, Tahvanainen KU, et al. Respiratory modulation of human autonomic rhythms. Am J Physiol Heart Circ Physiol 2001;280(6): H2674-2688.
[8] Haritha H, Negi S, Menon RS, Kumar AA, Kumar CS. Automating anxiety detection using respiratory signal analysis. In2017 IEEE Region 10 Symposium (TENSYMP) 2017 Jul 14 (pp. 1-5).
[9] Kumar CS, Ramachandran KI, Kumar AA. Vital sign normalisation for improving the performance of multi-parameter patient monitors. Electr Lett 2015;51(25):2089-2090.
[10] Martinez JM, Papp LA, Coplan JD, Anderson DE, Mueller CM, Klein DF, et al. Ambulatory monitoring of respiration in anxiety. Anxiety 1996;2(6):296-302.
[11] Liu H, Allen J, Zheng D, Chen F. Recent development of respiratory rate measurement technologies. Physiol Measur 2019;40(7):07TR01.
[12] Pfaltz MC, Michael T, Grossman P, Blechert J, Wilhelm FH. Respiratory pathophysiology of panic disorder: an ambulatory monitoring study. Psychosom Med 2009;71(8):869-876.
[13] Pfaltz MC, Grossman P, Michael T, Margraf J, Wilhelm FH. Physical activity and respiratory behaviour in the daily life of patients with panic disorder and healthy controls. Int J Psychophysiol 2010;78(1):42-49.
|
 IJCRR
IJCRR 


 This work is licensed under a Creative Commons Attribution-NonCommercial 4.0 International License


