IJCRR - 8(4), February, 2016
Pages: 39-46
Date of Publication: 21-Feb-2016
Print Article
Download XML Download PDF
ASSESSMENT OF GROUND WATER QUALITY OF PEESANGAN BLOCK OF AJMER DISTRICT
Author: Priyanka Khanna, Nidhi Rai
Category: Healthcare
Abstract:Physicochemical study of the ground water of some rural areas of Peesangan Block of Ajmer district has been carried out to examine the suitability of water for drinking, irrigation and other domestic purposes. Water samples from these areas were collected during Pre-Monsoon (April-June) and Post monsoon seasons (Oct-Dec) of the year 2013. The data were analyzed for mainly Electrical Conductivity (EC), Total Dissolve Solids (TDS), Chloride (Cl-), Fluoride (F-), Nitrate (NO3-), Total Hardness, Alkalinity, Sodium (Na+), Potassium(K+), Carbonates(CO3-2), Bicarbonates (HCO-3) etc. with reference to BIS and WHO standards. It has been observed that most of the water samples have the concentration of different parameters beyond the permissible limits. The groundwater of the present study area was not found suitable for drinking and other domestic purpose.
Keywords: Ground water of rural area, Physicochemical characteristics, Drinking water, Water pollution.
Full Text:
INTRODUCTION
Water is one of the five (Earth, Air, water, fire and space) essential elements of life. The safe potable water is absolutely essential for healthy living. Groundwater is ultimate and most suitable fresh water resource for human consumption in both urban as well as rural areas. There are several states in India where more than 90% population is dependent on groundwater for drinking and other purposes (Ramachandraiah, 2004). Ground water is also being used frequently as the alternative source for agriculture and industry. Importance of groundwater for existence of human society cannot be overemphasized. India is a vast country with varied hydrogeological situations resulting from diversified geological, climatological and topographic settings.
The natural chemical composition of ground water is influenced predominantly by type and depth of soils and subsurface geological formations through which ground water passes. Ground water quality is also influenced by the atmosphere and surface water bodies. There are various ways of contamination of ground water such as use of fertilizers in farming seepage from effluent bearing water body, industrial discharge etc. Now a days qualitative analysis of ground water is very important as compared to the quantity available(Hem.J.D.).
However ground water quality have not received much attention although it is a one of the most important tool in Environmental impact assessment (EIA) (Krishna Rao,P.R.1971.), so attention on quality of ground water and to aware each person for their right of safe water for drinking and other domestic uses. Water is one of the most important compounds in the ecosystem. Better quality of water can be described by its Physical, Chemical and Biological characteristics. But some correlations are possible among these parameters and the significant one would be useful to indicate the quality of water. Due to increased population, industries, use of fertilizers in agriculture and Man-made activity, drinking water gets contaminated and due to use of Contaminated Drinking water,
Human Population Suffers From a variety of water borne diseases, so it becomes necessary to evaluate the Quality of Drinking water which should be done at regular intervals of time. It is difficult to understand The Biological Phenomena fully because the Chemistry of water reveals much about the metabolism of the ecosystem and explain the general Hydro biological relationship. The physicochemical parameters of water and the dependence of all life process of these.
STUDY AREA
Peesangan is a Tehsil in Ajmer District of Rajasthan State of India. The latitude 26.38°37'195" and longitude 74.41°05'291" are the geo-coordinates of the Peesangan tehsil. It belongs to Ajmer Division. It is located 31 KM towards west from District headquarters Ajmer, 180 km from State capital Jaipur towards East. Peesangan Tehsil is bounded by Riyan Badi Tehsil towards North, Ajmer Tehsil towards East, Beawar Tehsil towards South, Masooda Tehsil towards South. Ajmer City, Beawar, Nasirabad, Merta City are the nearby Cities to Pisangan. It is in the 438 m elevation (altitude). Near destinations for visit of tourist are Pushkar, Ajmer, Kishangarh, Kuchaman, Khimsar.
MATERIALS AND METHODS
Water samples were collected from various ground water sources covering the study area in two different seasons Premonsoon and Post-monsoon season of the year 2013. Samples were collected into pre-cleaned polyethylene bottles of one liter capacity with utmost care to avoid any kind of contamination and were brought to laboratory for the estimation of various physicochemical parameters. Volumetric and instrumental techniques were adopted for systematic analysis of the water samples using Standard procedures [APHA, BIS].
The analysis was carried out for estimation of pH, EC, TDS, Alkalinity, Hardness, Chloride, fluoride, Nitrate etc. The reagents were standardized from Standard solutions and instruments were calibrated by known standards before analysis. The reagents of AR grade were used for analysis work and double distilled water was used for the preparation of solutions.
RESULTS AND DISCUSSION:-
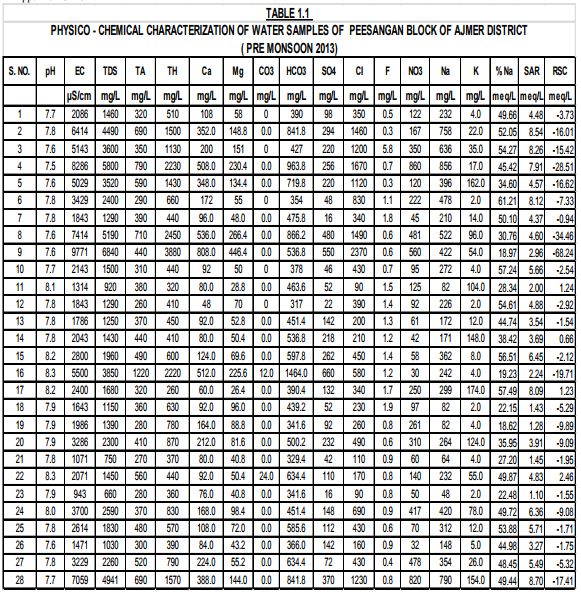
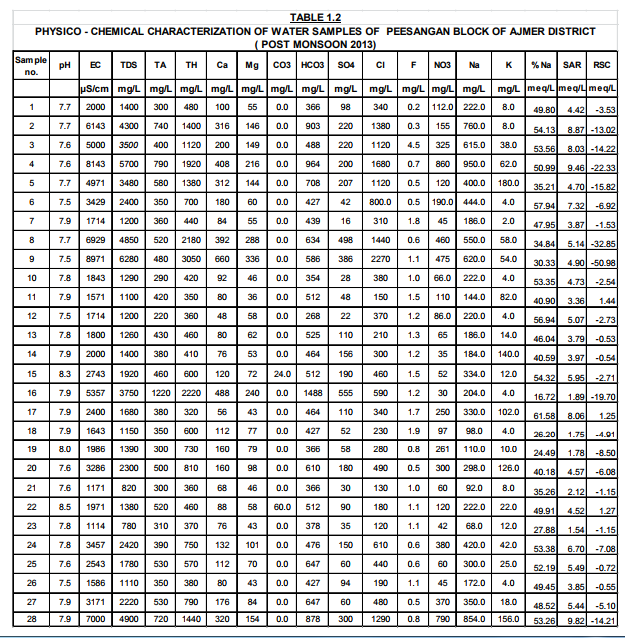
The results of Physicochemical Parameters obtained and seasonal variation are presented in Table1.1 and 1.2 In general Salinity, alkalinity, fluoride, nitrate and TDS are the major factors, which affect the water quality most. pH: As observed in the tables 1.1 and 1.2 the pH of ground water in this area varies within minimum 7.5 to maximum 8.5 in both seasons. Almost all the water samples in this area are alkaline in nature though the values of pH of all water samples were found to be within the permissible limits in both seasons.
The standard limits prescribed by WHO and IS 10500:2012 are 6.5- 8.5. Electrical Conductivity (EC): E.C. depends on the concentration of dissolved mineral matter content. The salt concentration is generally measured by detecting EC. In the present study area, the EC has been observed from 942 to 9771 μS.cm-1. About 60 % water samples have EC more than the permissible limit. If the TDS is high then EC will be high [Tiwari, T.N.; Das, S.C.; Bose, P.K. Poll. Res 1986].
Total Dissolved Solids(TDS):
The value of T.D.S. is very important for the assessment of water quality (Ahmad Ashfaq and Faizan Ahmad 2014). High TDS value of water indicates the higher mineralization of water. The desirable limit for TDS is 500 mg/L and maximum permissible limit is 2000 mg/L (Maruthi and Rao, 2004). As the result of analysis the values of total dissolved solid ranges from 660 to 6840 mg/L during pre-monsoon and 780 to 6280 mg/L in Post-monsoon season. Maximum TDS has been observed at handpump, Gomawat Mohalla near tanki inTabiji village. About 46% samples have TDS beyond permissible limit of 2000 mg/L. It concludes that mostly water is saline in Peesangan block of Ajmer district. This shows that anthropogenic impact which can be due to agricultural activity leading to local spatial and temporal variability of runoff (Chatterjee, R. Gourab 2010). Away from the permissible level, palatability decreases and may cause gastrointestinal irritation.
Alkalinity:
Alkalinity of the water is due to presence of carbonates, bicarbonates and hydroxide salts. The alkalinity values in the study area were recorded between 260 to 1220 mg/L in pre monsoon season and 220 to 1220 mg/L during Post-monsoon season. The hydroxide, carbonates and bicarbonate probably released from limestone sedimentary rocks, carbonate rich soils, cleaning agents etc.( Tiwari, T.N. Mishra). The Maximum value (1220 mg/l) is observed in Open well situated at Mayapur Road in Naharpura village and minimum value (220mg/l) recorded at Handpump, Bus stop, Daurai village. The Maximum permissible level of alkalinity is 600 mg/L (BIS Standard). About 83% of water samples tested were found to be within permissible limits.
High amount of alkalinity in water is harmful for irrigation which leads to soil damage and reduces crop yields. Chloride (Cl): All the natural types of water contain chlorides. Chloride is added to water due to the agricultural activities, industries and chloride rich rocks. itis a widely distributed element in all types of rocks in one or the other form. Its affinity towardssodium is high. High concentration of chloride is due to the invasion of domestic wastes and disposals by human activities (Jha and Verma, 2000). Soil porosity and permeability also play a key role in building up the chlorides concentration (Chanda D K, 1999,).
According to IS:10500:2012the desirable limit of chloride is 250 mg/Land the permissible limit is 1000mg/l. In the present analysis, chloride concentration lies between the range of 90 mg/L to 2370 mg/L in pre-monsoon season and Minimum and Maximum values are decreasing in post monsoon seasons.(120 to 2270 mg/l.). The highest value 0f 2370 mg/l is observed at Handpump of Gomawat Mohalla of Tabiji village. Excessive chloride in water is particularly not harmful but increase of chloride level in water is injurious to People suffering from heart and kidney diseases.(Sudhir Dahiya and Amarjeet Kaur, 1999).
Hardness:
The total hardness is the measure of the capacity of water to precipitate soap. Hardness of the water is due to presence of Ca and Mg salts. Usually the hardness is not harmful to health but it has been suspected to play some role in heart diseases (Ahmad Ashfaq and Faizan Ahmad2014). In this study area, the range of total hardness was found to be from 260 mg/L to maximum 3880mg/L in Pre-monsoon season and 320mg/L to 3050mg/L in Post-monsoon season in more than 50% of samples hardness as crossed permissible limit.
The hardness of the water is due to dissolved minerals from sedimentary rocks through seepage and runoff (Milovanovic, M. Desalination 2007), Detergents and soaps also aggravate the situations. The standard limits of total hardness are 200 to 600 mg/l. as per IS 10500:2012. Sulphate (SO4 ): In Present study area the sulphate values exhibited between 16 to 660 mg/l in pre monsoon season, and 16 mg/l to 555 mg/l. in Post-monsoon season Sulphate occurs naturally in water as a result of leaching from gypsum and other common minerals(Gupta S, KumarA, Ojha C K and Singh G, 2004).
Discharge of industrial wastes and domestic sewage tends to increase a concentration of sulfate in water. Only 3 samples have concentration beyond the permissible limit as prescribed by IS 10500:2012 (400 mg/l.).High concentration of sulphate may cause gastrointestinal irritation particularly when the concentration of magnesium and sodium is high. Nitrate(NO3 ): The values of nitrates in the study area were recorded between 30 mg/L and 860 mg/L.About 75% of samples exceed the desirable limit of 45 mg/L.
If the concentration of nitrate is higher than 45 mg/L, it will cause a disease called blue baby disease or methaemoglobinaemia in infants [Maruthi Devi, C.H.; Usha Madhuri, T. Nature, 2011]. The high level of nitrate in study area has reported that nitrate contamination of water is due to increasing use of nitrogenous fertilizers and nitrites can cause depletion of dissolve oxygen content of water [D. Fairchild,1987 and A.T.Ajao, G. B. Adebayo and S. E. Yakubu J. Microbiol. Biotech. Res., 2011]. NAEP have concluded that residual nitrate in the soil in the major cause of nitrate contamination in ground water. The appreciable quantities of nitrates and nitrites found in these investigations have some public health implications. Calcium:
The Calcium in the sampling sources ranges from 48 to 808 mg/L during pre-monsoon season and 48 to 660 mg/L during Post-monsoon season of 2013. In most of the samples it falls above the desirable limit of 75 mg/ L(IS:10500:2012), and only 30% samples have calcium concentration above the permissible limit of 200 mg/L. The higher value is mainly attributed due to the abundant availability of lime stone in the area. Consequently more solubility of calcium ions is present.
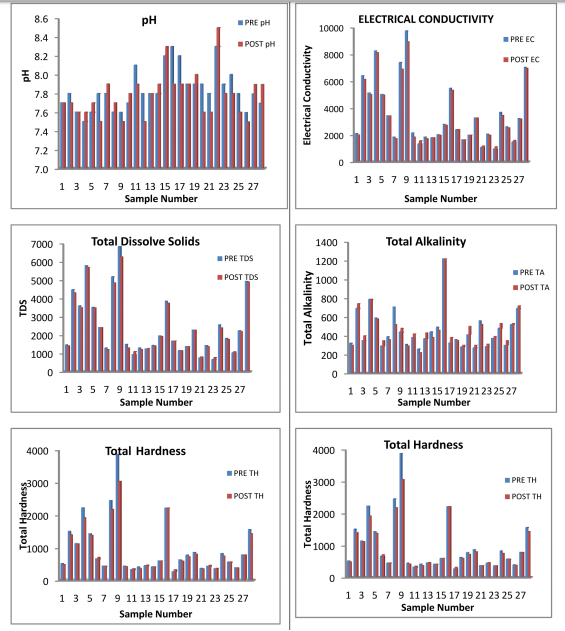
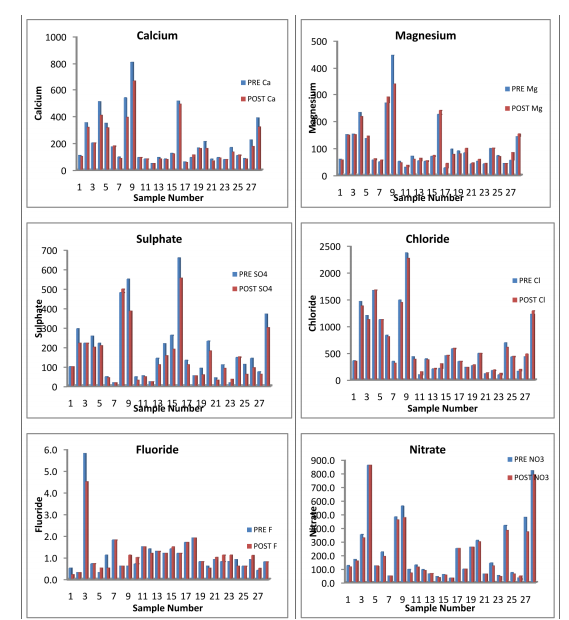
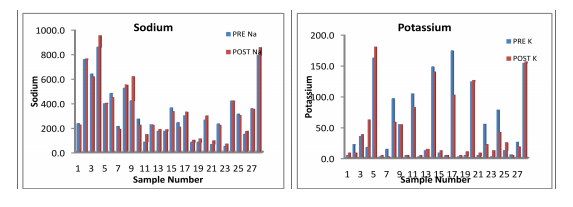
Magnesium In these samples, the minimum concentration of magnesium has been increased from 26 mg/L in Pre-monsoon to 36 mg/L in Post- monsoon season. But the maximum value decrees from 446 mg/L to 336 mg/L in post-monsoon season 2013.In all most of all the samples magnesium falls above the standard desirable limit 30 mg/L in both seasons. The concentration of magnesium may be due the dissolution of magnesium calcite, gypsum and dolomite [Garrels, R.M.;Christ, C.L. 1965 , Rao, S.N. 1997]. All the major parameters in both seasons were found to be in excess of the desirable limit given by WHO / ICMR / IS (10500:2012) standards, so that water quality of the study areas of poor quality as shown in the analysis tables 1.1 and 1.2 Further the comparative Water Quality values have been shown in the bar Diagrams.
CONCLUSION
The above observations in the present study indicate that about 75% samples exceed he permissible limits of most of the parameters of the samples. So the ground water of the Peesangan belt is saline in nature and unpotable for drinking and other domestic uses. They need to minimize the use of ground water for drinking purposes without treatment. The government is making new plans for supply of clean fresh treated water for drinking and other domestic uses for the population of the study area.
References:
1. Rijsberman, F. R. Agricultural Water Management, 2006, 80(1- 3), 5.
2. Burjia, J.S.; Romani, S.. Groundwater Development–Present scenario and future needs. Indian J. Pub. Adm. 2003, XLIX(3), 301. CPCB, Water Quality, Parivesh, 1995, 1(4), 6.
3. Abraham BairuGebrehiwot; NataTadesse; Elias Jigar. ISABB J. Food and Agriculture Sci.,2011, 1(1), 22.
4. Gupta S, Kumar A, Ojha C K and Singh G, 2004, Journal of Environmental Science and Engineering. 46(1), pp7478.
5. Lakshmanan, E; Kannan, K.; Senthil, M.K. Indian J. Env. Geosciences,2003, 10(4),157.
6. Kalavathy, S; RakeshSharmas, R; Sureshkumar, P. Arch. Environ.Sci., 2011, 5, 55.
7. APHA. 2005, Standard methods for the examination of water and waste water (2st Ed.), American Public Health Association, Washington.
8. BIS. 2003, Indian standards specifications for drinking water, IS:10500, Bureau of Indian Standards, New Delhi.
9. ICMR, 1975, Manual of standards of quality for drinking water supplies, Special report series no. 44, Indian Council of Medical Research, New Delhi.
10. D. Fairchild, Lewis Publication. Chelsea, Michigan., 1987, 402,161-174.
11. A.T. Ajao, G. B. Adebayo and S. E. Yakubu J. Microbiol. Biotech. Res., 2011, 1 (3), 50-56
12. WHO. 2005, International standards for drinking water, World Health Organisation, Geneva.
13. Vogel, A. I.; A textbook of Quantitative Inorganic Analysis Including Elementary Instrumental Analysis ,4th Ed., The English Language Book Society and Langman Co., 1978, 504-506.
14. Vasanthavigar, M; Srinivasamoorthy, K; Vijayaragavan, K; Gandhi, R; Chidambaram, S; Anandhan, P;Manivannan,R and Vasudevan.S, Environ Monitoring Assess.,2010, DOI 10.1007/ s10661-009-1302-1.
15. Tiwari, T.N.; Das, S.C.; Bose, P.K. Poll. Res., 1986, 5, 1.
16. Chatterjee, R; Gourab, T.; Paul,S. Bull. Eng. Geol. Environ., 2010, 69, 137.
17. Sudhir Dahiya and Amarjeet Kaur, 1999, J Environ Pollution, 6 (4), 281.
18. Garrels, R.M.;Christ, C.L. Solutions minerals and equilibrium, New York: Harper and Row,1965, 450.
19. Rao, S.N. Studies on water quality index in hard rock terrain of Guntur district Andhara Pradhesh, India. National Seminar on Hydrology of Precambrian Terrains and Hard Rock Areas, 1997, pp: 129-13425
21. Maruthi Devi, C.H.; UshaMadhuri, T. Nature, Environment and Pollution Technology, 2011, 10, 481.
22. Tiwari , T.N.; Mishra, M.A. Indian J. Env.Prot., 1985, 5, 276.
23. Garrels, R.M.; Christ, C.L. Solutions minerals and equilibrium, New York: Harper and Row, 1965, 450.
24. Rao, S.N. Studies on water quality index in hard rock terrain of Guntur district Andhara Pradhesh, India. National Seminar on Hydrology of Precambrian Terrains and Hard Rock Areas, 1997, pp: 129-134
25. Sinha, D.K.; Srivastava, A.K. Indian J.Env. Prot., 1994, 14(5), 340.
26. Ahmad Ashfaq and Faizan Ahmad (2014) Assessment of Drinking Water Quality: A Case Study, Civil Engineering and Technology, A.M.U., Aligarh, India.
27. Chanda D K, 1999,) Hydrology Journal, 7(5),pp 431439.
|


 This work is licensed under a Creative Commons Attribution-NonCommercial 4.0 International License