IJCRR - 8(7), April, 2016
Pages: 23-29
Date of Publication: 12-Apr-2016
Print Article
Download XML Download PDF
EFFECTS OF VITAMIN-D AND SUNLIGHT ON THE HEMATO-BIOCHEMICAL PARAMETERS IN MICE
Author: Muhammad Rakibul Hasan, Md. Kamrul Islam, Ziaul Haque
Category: Healthcare
Abstract:Moderate exposure to sunlight increases vitamin-D status in the body and vitamin-D helps in absorption of calcium from intestine. This study was aimed to investigate the efficacy of vitamin-D and sunlight on blood parameters and serum biochemistry in mice. For this purpose, 50 adult Swiss albino mice were collected and randomly divided into five equal groups (Group A, B, C, D and E). Group A was considered as control and fed only on balanced normal feed. Group B was supplied with 15% butter in feed as a semi-synthetic source of vitamin-D, group C was exposed to direct sunlight (1.5 hours daily) and group D and E were supplied with oral synthetic form of vitamin-D @ 50 IU and 100 IU daily, respectively. After 120 days, blood and serum samples were collected for analysis. Our results showed that total erythrocytes count (TEC) and total leukocytes count (TLC) were found higher in group D but insignificant. Lymphocytes were significantly (P< 0.001) higher in group D but neutrophils was significantly (P< 0.01) higher in group B. The aspartate transaminase (AST), alanine transaminase (ALT) and alkaline phosphatase (AP) levels were also raised very sharply with increased level of vitamin-D in blood. AST and AP level were found significantly (P< 0.001) higher in group B but ALT level was significantly (P< 0.001) higher in group E. The lipid profile such as total cholesterol (TC), high density lipoprotein (HDL) and triglyceride (TG) were also analyzed. TC level was slightly higher in group C but significantly (P< 0.01) lower in group E HDL was significantly increases with increased level of vitamin-D in treatment groups (P< 0.01). TG level was somewhat higher in group D but not significant. From our results it can be concluded that sunlight and butter are the potential sources of vitamin-D. Supplementation of vitamin-D at certain level improves health status but excessive supplementation cause harmful effects on the body systems.
Keywords: Sunlight, Vitamin-D, Blood, Biochemical analysis
Full Text:
INTRODUCTION Vitamin-D is needed for bone growth and bone remodeling from osteoblasts and osteoclasts (Cranneyet al., 2007). The main function of vitamin-D is maintaining calcium homeostasis and low levels of vitamin-D result in lower absorption of calcium from intestine (Lane, 2010). Without vitamin-D, the body cannot absorb calcium and phosphorus adequately, the skeleton loses mineral content (secondary osteoporosis) and new bone is not adequately mineralized (rickets or osteomalacia). It is recommended that dietary allowance for human is 600 IU in a day for ages 1-70 years for this vitamin (Aloia, 2011; Abrams, 2011; Gallagher et al., 2014).
Calcium and bone metabolism in adults depend heavily on concentration of vitamin-D (Silver, 2011). According to Bikle (1994), vitamin-D treatment is safe and probably most efficacious in populations with marginal vitamin-D intake or limited sunlight exposure and does not need high doses. Vitamin-D is present in many foods, including fishes, eggs, fortified milk, and cod liver oil. In this experiment butter is used as vitamin-D source. Although milk is normally low in vitamin-D but butter contains high fat and is rich in vitamin-D (Schmid and Walther, 2013).
Regular receiving of butter through diet may also be helpful for immunity development (Cope et al., 1996). Shankar et al. (2002), reported that moderate level of butter has some unique potential benefits on health, particularly in relationship to its vitamin-K and vitamin-D content. As per experiment of Astrup, (2014), consumption of yogurt and other dairy products like butter reduced risk of weight gain and obesity as well as of cardiovascular disease. Sunlight is an electromagnetic radiation and gives off different types of lights and rays having different wave length. They produce either positive or negative response in living cells. Moderate sun exposure, physical activity and normal-weight maintenance are modifiable factors, for improving vitaminD status (Touvieret al., 2014; Beneret al., 2009).
The ultraviolet radiation has both positive and negative health effects, as it is source of both vitamin-D3 and a mutagen (Osborne and Hutchinson, 2002; Ohnaka, 1993). Cholesterol under the skin surface called provitamin-D3 reacts with the ultravioletB rays to form vitamin-D3 . From there, it first goes to the liver and then through the kidneys, converting it into the form of active vitamin-D that the body needs (National Institutes of Health). Lack of sun exposure and vitamin-D deficiency has been linked to serious cardiovascular problems and cancers (Holick, 2008).
METHODOLOGY Animals: From seventy Swiss albino mice (Musmusculus), a total of 50 mice were randomly selected after acclimation for 7 days. Their weight was approximately 22-27 gm/mouse and the age was between 40 and 45 days which were divided into five equal groups. Treatment: One group was fed on balanced pellet only and was considered as control group (group A). The remaining groups were considered as treated groups (B, C, D and E). Among the treated groups, only group B was fed with butter supplemented diet (15% of solid feed) and others were maintained with balanced diet. Group C was directly exposed to sunlight for 1.5 hrs daily and group D was supplied with additional vitamin-D @ 50 I.U and group-E with vitamin-D @ 100 I.U orally.
This treatment regime was continued for 120 days without any changes. Sample Collection: Samples were collected from mice by sacrificing them for hematological and serological study. For hematological test, blood was stored in test tubes containing anticoagulant (3.8% sodium citrate) except for DLC (Differential Leukocyte Count). For serum collection, blood without anticoagulant was kept in slanting position and serum supernatant was collected after 24 hours and being centrifuged. A drop of blood directly placed on slide and made a thin smear for DLC. For blood and serum analysis, we collected 5 samples from each group. Blood Analysis: Hematological parameters were total erythrocytes count (TEC), estimation of hemoglobin by acid-hematin method, determination of erythrocyte sedimentation rate (ESR) by Wintrobe’s method, determination of packed cell volume (PCV) or hematocrit (Hct) value, total leukocytes count (TLC), differential leucocyte count (DLC).
All measurements were performed in the hematological laboratory, Department of Physiology, Bangladesh Agricultural University, Mymensingh, as described by Ghai (2008) Serum Biochemistry: Alanine transaminase (ALT/GOT) and aspartate transaminase (AST/GPT), alkaline phosphatase, triglyceride (TG), total cholesterol (TC), high density lipoprotein (HDL) were analyzed to know the blood and liver response to additional supplement of vitamin-D. For serological analysis end point method was used for AST, ALT and AP and kinetic method was used for TC, HDL and TG (Human Humalyzer-3000, Germany). Statistical analysis: The result was analyzed statistically by paired t-test and compared significance level at 95%, 99% and 99.99% by using SPSS software (Version 16.00, IBM Corporation). In this analysis, we compared each treatment group with control group separately.
RESULT Hematological Tests Table 1 and figure 1 shows the effects of vitamin-D and sunlight on blood parameters. The application of butter, sunlight and synthetic vitamin-D caused significant increase of blood cell counts in treated groups.
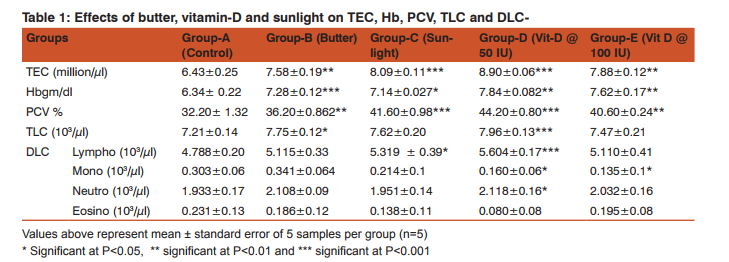
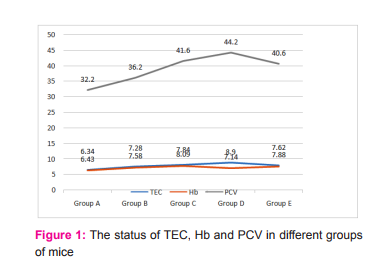
Hemoglobin level in experimental mice was gradually increased with increased level of vitamin-D supplementation (Figure-1).It was the highest in group-D (7.84±0.082 gm/ dl) followed by group E (7.62±0.17 gm/dl) in comparison to control group (6.34± 0.22 gm/dl). Its value was 7.28±0.12 gm/dl in group B and 7.14±0.027 gm/dl in group C. PCV was found significantly higher (44.20±0.80 %, P<0.001) in group D and group C (41.60±0.98%, P<0.01) but non-significant in group E and group B. Figure 1 shows that PCV level dramatically increases with treatment at certain level and then suddenly decrease with excessive supplementation (group E). TLC (illustrated in table1) was 7.21±0.14 thousand/µl in group, 7.75±0.12 thousand/µl in group B, 7.62±0.20 thousand/µl in group C in 7.96±0.13 thousand/µl in group D, and 7.47±0.21 thousand/µl in group E. TLC was highest in group D and lowest in group A (control group). In DLC, lymphocytes were significantly higher in vitaminD @ 50 IU (5604 /µl, P< 0.001) but when dose increased to 100 IU lymphocytes decreased to 5110/µl.
Table-1 shows that monocyte number decreases among the treatment except butter receiving mice. Monocyte number was higher in butter treated mice which was 0.341 thousand/µl (P< 0.001) than the control group (0.303 thousand/µl). Among the experimental mice it was lowest in group E (0.135 thousand/ µl) which was significant statistically (P<0.05). Neutrophil number was higher in groupD treated mice (2.118 thousand/ µl, P< 0.05) but insignificantly lowest in counting eosinophil in sunlight exposed group. In butter, sunlight and vitaminD @ 100 IU receiving mice neutrophil number was 2.108 thousand/µl, 1.951 thousand/µl and 2.032 thousand/µl, respectively. Neutrophils were significant at P<0.001 (group D). Conversely when eosinophil number increases, the neutrophil number decreases in experimental mice.
Biochemical Tests To know internal body functions, liver function tests and lipid profile tests were conducted. Liver functions test includes alanine transaminase (ALT), aspartate transaminase (AST), alkaline phosphatase (AP) and lipid profile tests includes High Density Lipoprotein (HDL), Total Cholesterol (TC) and Triglyceride (TG). The biochemical reports of different groups of mice are presented in table 2. The graphical presentation of liver function tests and lipid profile tests are shown in figure 2 and 3, respectively.
Test result shows that AST level is steadily increase with increase vitamin-D in group B, C, D and E than control group (49.11±8.82U/L). AST level reaches peak 84.88±25.17 U/L (P<0.001) in vitamin-D @50 IU treated group. Significantly highest (P<0.001) level also observed in sunlight group, C (78.21±23.78U/L) followed by butter treated group, B (75.77±6.39U/L). Suddenly, AST level was the lowest) in group E (64.21±15.93U/L, P<0.001) supplemented with very high doses of vitamin-D (@ 100 IU).
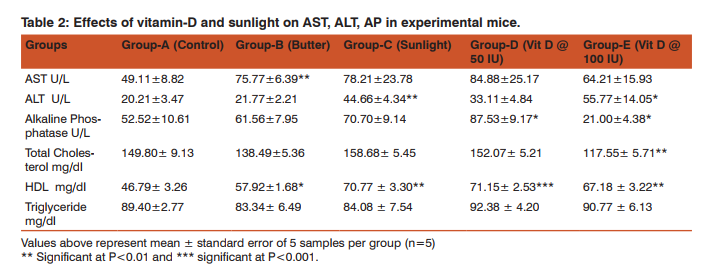

There is significant fluctuation of ALT level in experimental mice. This parameter is higher in group E (55.77±14.05 IU, P<0.01), followed by group C (44.66±4.34 IU). In group D, ALT level was lowest (33.11±4.84 IU) among the treated groups. But in butter treated group, ALT was (21.77±2.21 IU which was close to the control group 20.21±3.47 IU). All the values are statistically significant. AP is one of the major parameters to determine the activities of liver as well as bone restoration and formation.
According to Figure-2, AP level gradually increased up to group-D, then it dramatically dropped down in group-E (21.00 U/L). AP level is highest (P< 0.001) in vitamin treated group, group D (87.53±9.17 U/L). Significantly higher (P< 0.001) level was found in sun-light group, 70.70±9.14 U/L. Butter treated group showed AP level was medium (61.56±7.95 U/L P<0.001). Among the treatment groups, group E was the lowest (21.00±4.38 U/L).
Lipid Profile of Experimental Mice In our study, cholesterol level was near similar to the proportional level of triglyceride (Table 2 and figure 3) which was not steadily influenced by vitamin-D concentration. Cholesterol level was significant (P<0.01) in butter supplemented mice (138.49±5.36 mg/dl) and. However, it was 158.68 ± 5.45 mg/dl in sunlight exposed group, 152.07 ± 5.21 mg/dl in vitamin-D @ 50 IU and 117.55 ± 5.71 mg/dl in vitamin-D @ 100 IU treated groups, respectively. Table 2 represents HDL level significantly increased (P<0.001) in group D (71.15± 2.53 mg/dl). Second highest was 70.77 ± 3.30 mg/dl in group C which was gradually increased with vitamin-D concentration in blood. In control group HDL was 46.79± 3.26 mg/dl, 57.92±1.68 mg/dl in group B and 67.18 ± 3.22 mg/dl in group E.
Triglyceride level in different groups was different and fluctuated irregularly with vitamin-D concentration (Table 2). Triglyceride level in control group was 89.40±2.77 mg/dl whereas it was 83.34 ± 6.49 mg/dl in butter supplemented mice. The level of triglyceride was 84.08 ± 7.54 mg/dl in sunlight exposed group (group C) and 92.38 ± 4.20 mg/dl and 90.77 ± 6.13 mg/dl in vitamin-D @50 IU (group D) and 100 IU treated group (group E), respectively. All values were statistically significant (P< 0.001).
DISCUSSION Hematology: Application of excess vitamin-D than daily requirement is effective to improve RBC in peripheral blood and stimulates hemopoietic organs. On the other hand, sunlight produces good amount of vitamin-D (www.infinitheism.com), increases RBC level by acting on bone, liver and kidney. Besides that, butter may also act as a good source of vitamin-D but had lower strength to reveal effects on TEC values. At the same time vitamin-D in the diet is thought to invigorate the liver function that indirectly enhances erythropoiesis (Guyton and Hall, 2006). The table 1 revealed that stimulation in hemopoetic organs like bone and liver at adequate level may ameliorate Hb formation in comparison with control group (6.34± 0.22gm/dl).
From this finding it can be assumed that vitamin-D has positive effect on hemoglobin concentration. This finding is closely related to the findings of others (Jennifer et al,. 2013; Shuet al,.2011).When body exposed to excess vitamin-D, hemopoietic organ produce more blood cells and thus the level of PCVgrown up gradually. Although vitamin-D level was increases in treated mice but the There was no relation with vitamin-D concentration among the groups for counting WBC. The fluctuation was not equal in all cases. This may indicate that there was no similarity in increasing leukocytes which is also reported by Ashraf et al. (2012). This experiment reveals that vitaminD could be responsible for raising leucocytes number from normal condition. This is also described by Marwahet al. (2012). Increase number of leukocyte may be an indication of vitamin-D action on cell formation from bone by the activation of stem cells in the body (Cynthia, 2011). According to Charles et al. (2007) hepatic injury increases peripheral lymphocytes in blood which is similar to this experiment. Increase number of lymphocyte may increase the recruitment of cells in the inflammatory hepatocyte to minimize the lesion and improving healing process (Geoffrey et al., 2002; Patricia et al., 2002). Beside lymphocytes, the number of neutrophils significantly increases in treated groups. In vitamin-D @ 100 IU and butter treated mice this number was comparatively higher than others (P<0.01) which was also reviewed by some scientists.
The increase numbers of polymorphs indicate that there may be presence of inflammation and have possibility of hepatocyte degeneration (Jaeschke and Hasegawa,2006; Ramaiah and Jaeschke,2007). Monocyte number significantly decreases with increase vitamin-D in blood (Table 1). Although in butter supplemented group it is higher (4.40±0.40%, P<0.001) than other groups but it decreases with increase vitamin-D level in blood. The causes of reduction in number may be associated with chronic inflammatory problem in liverin where subset of monocyte may be happened for fibrogenesis (Liaskouet al., 2013; Frank, 2012). Eosinophil number was significantly (P<0.001) higher in treated groups (3.20±0.80%) in compare with control group (Table 1). However they were statistically significant. A low number of eosinophils in the blood (eosinopenia) could occur in stress condition caused by excess vitamin-D but does not usually cause problems (Merck Manual, 2013). There may be another reason of gradual decreasing eosinophil number was the infiltration of this cell in liver and it is an unusual condition (Hyun et al., 2012).
Liver Function Tests The excess and sudden low level of AST indicates that there may have both positive and negative effects of vitamin-D on liver enzyme production and very high dose may causes toxicity (Khaled et al., 2009). According to Holmes and Kummerow (1983) and Glenville (2008) vitamin-D is toxic compound and excessive amount causes calcification of softtissues. This toxicity and calcification may affect both liver and muscle and secrete more AST in blood serum. Nature like sunlight may not have enough effect to produce AST but increase level indicates that regular exposure to sunlight may create hepatocellular disease and raises transaminase activities (Beran and Ulker, 2006).
ALT level in mice was significantly changed with different treatment. This variation may depend on degree of liver damage (Amina et al., 2010; Zhou-wen et al., 2008). The ratio between AST and ALT in treatment group indicates that there is progressively high degeneration in hepatocytes (Raizaet al., 2014). In addition, calcification of liver may responsible for increasing level of ALT in blood (Holmes and Kummerow, 1983; Glenville, 2008). Alkaline Phosphatase level is increased with increasing vitamin-D concentration as linear motion than compared group (Figure 2).
The experimental data (Table 2) may cause bone turnover that means mineralization of bone is happened due to rise of vitamin-D volume (Guyton and Hall, 2006). The low level of AP in group E was due to vitamin-D toxicity in liver and kidney, and causes excessive damage to hepatocyte. Higher level of AP in other treated groups also indicator of liver damage (Khaled et al., 2009) and further the elevated AP levels accompanied by increased bone and liver activity (Konstantinos et al., 2002). This result could interfere with calcium metabolism and bony architecture either had positive or negative effect (http://labtestsonline.org).
Lipid Profile of Experimental mice Table 2 shows that there is no improvement or no significant effect of cholesterol due to over doses of vitamin-D supplement.Similar type of study have been trialed in man (Pondaet al., 2012; Asemi et al., 2012). There is presence of abnormal cholesterol level in group E where each mouse receives 100 IU vitamin-D daily. It may be for liver damages, thus liver could not synthesize adequate cholesterol. Such kind of information also reported earlier (Jerome and Robert, 1970).
This finding also supports that supplementation of diet with vitamin-D which enhances the beneficial effect of weight loss on plasma lipid and lipoprotein concentrations (Geneviève et al., 2007). Although vitamin-D is a fat soluble vitamin but increase of vitamin-D concentration improves HDL level. There may have possibility of increasing metabolism rate of liver and vitamin-D also increases blood circulation to the tissues. These two factors might be responsible for raising HDL in blood. The HDL level of this study is supported by Sun et al. (2014) and Jorde and Grimnes (2011).
According to their findings, serum 25(OH)-D is positively related with highdensity lipoprotein cholesterol (HDL-C) and is favorable to HDL-C and high-density lipoprotein cholesterol (LDL-C) ratio. Additional supplement of vitamin-D may improve lipid profile as well as serum HDL in aged people (Jungertet al., 2014). Triglyceride level fluctuates irregularly with different treatment. According to Ponda et al. (2012) vitamin-D could not improve triglyceride and has no direct effect on triglycer- ide levels (Figure 8). Vitamin-D supplementation can lower triglycerides (Jorde and Grimnes, 2011).
It is a comparable matter that the vitamin-D concentration at certain level may improve triglyceride (group B and C) but excess vitamin-D may be harmful for liver and kidney and is responsible for elevated triglyceride (José et al., 2009). Elevated triglyceride level is caused by medical conditions such as diabetes, hypothyroidism, kidney disease, or liver disease (Shaoqinget al., 2010; James et al., 2007). Vitamin-D treated group D and E shows slight high level of triglyceride compare to normal mice.
CONCLUSION The purpose of this study was to evaluate the role of vitaminD on the body and some special tissues and its side effects on body. In hematological tests, TEC and TLC level was higher in vitamin-D supplemented group. However, these values are statistically insignificant. Excess amount of vitamin-D would be harmful for blood cell production. One the other hand biochemical tests of serum may indicate the huge detoxifying activities of liver may produce cirrhosis and brings structural changes.
ACKNOWLEDGEMENTS I express my gratitude to all teachers of Physiology Department, Anatomy and Histology and Lab Associates. I am also thankful to Government of Bangladesh for funding in my Research by awarding NST scholarship.
References:
1. Abrams SA 2011: Calcium and vitamin-D requirements for optimal bone mass during adolescence. Current Opinion in Clinical Nutrition and Metabolic Care 14 605-609.
2. Aloia JF 2011: Clinical Review: The 2011 report on dietary reference intake for vitamin-D: where do we go from here? The Journal of Clinical Endocrinology and Metabolism 96 2987- 2996.
3. Amina N, Hussain MM, Aslam M 2010: Correlation of serum alanine aminotransferase and aspartate aminotransferase levels to liver histology in chronic hepatitis C. Journal of the College of Physicians and Surgeons Pakistan 20 657-661.
4. Asemi Z, Tabassi Z, Heidarzadeh Z, Khorammian H, Sabihi SS, Samimi M 2012: Effect of calcium-vitamin-D supplementation on metabolic profiles in pregnant women at risk for pre-eclampsia: a randomized placebo controlled trial. Pakistan Journal of Biological Sciences 15 316-324.
5. Ashraf TS, Eldabbagh M, Elawwa A, Saleem W 2012: Does vitamin-D therapy affects hematological indices in adolescents with vitamin-D deficiency? Indian Journal of Endocrinology and Metabolism 16 659–660.
6. Astrup A 2014: Yogurt and dairy product consumption to prevent cardiometabolic diseases: epidemiologic and experimental studies. The American Journal of Clinical Nutrition 99 1235- 1242.
7. Bener A, Al-Ali M, Hoffmann GF 2009: Vitamin-D deficiency in healthy children in a sunny country: associated factors. International Journal of Food Sciences and Nutrition 60 60-70.
8. Beran Y, Ulker DC 2006: Seasonal and physiological variations in serum chemistry and mineral concentrations in Cattle. Biological Trace Element Research 10 255-266.
9. Bikle DD 1994: Role of vitamin-D, its metabolites, and analogs in the management of osteoporosis. Rheumatic Disease Clinics of North America 20 759-775.
10. Charles CC, Johannes T, Alex B 2007: Lymphocyte function during hepatic ischemia/reperfusion injury. Journal of Leukocyte Biology 82 457-464.
11. Cope RB, Bosnic M, Boehm-Wilcox C, Mohr D, Reeve VE 1996: Dietary butter protects against ultraviolet radiation-induced suppression of contact hypersensitivity in Skh:HR-1 hairless mice. Journal of Nutrition 126 681-692.
12. Cranney C, Horsely T, O’Donnell S, Weiler H, Ooi D, Atkinson S 2007: Effectiveness and safety of vitamin-D. Evidence Report/ Technology Assessment No. 158 prepared by the University of Ottawa Evidence-based Practice Center under Contract No. 290-02.0021. AHRQ Publication No. 07-E013. Rockville, MD: Agency for Healthcare Research and Quality.
13. Cynthia A 2011: Vitamin-D and the Immune System. Journal of Investigative Medicine 59 881–886.
14. Frank T 2012: Functional role of intrahepatic monocyte subsets for the progression of liver inflammation and liver fibrosis in vivo. Fibrogenesis and Tissue Repair 5 27-35.
15. Gallagher JC, Smith LM, Yalamanchili V 2014: Incidence of hypercalciuria and hypercalcemia during vitamin-D and calcium supplementation in older women. Menopause 21 1173-1180.
16. Geneviève CM, Francine A, Jean D, Sakouna P, Angelo T 2007: Supplementation with calcium + vitamin-D enhances the beneficial effect of weight loss on plasma lipid and lipoprotein concentrations. The American Journal of Clinical Nutrition 85 54-59.
17. Geoffrey H, Patricia FL, Stefan GH, David HA 2002: Lymphocyte recruitment to the liver in alcoholic liver disease. Alcohol 27 29-36.
18. Ghai CL 2008: A Text Book of Practical Physiology. 7th edition, Jaypee Brothers, Medical Publishers (P) Ltd. New Delhi. pp 63- 110.
19. Glenville J 2008: Pharmacokinetics of vitamin-D toxicity. American Journal of Clinical Nutrition 88 582-586.
20. Guyton AC, Hall JE 2006: A Text Book of Medical Physiology. 11th edition, Saunders, Elsevier, Philadelphia, Pennsylvania. pp 967.
21. Holick MF 2008. Vitamin-D and sunlight: strategies for cancer prevention and other health benefits. Clinical Journal of the American Society of Nephrology 3 1548-1554.
22. Holmes RP, Kummerow FA 1983: The relationship of adequate and excessive intake of vitamin-D to health and disease. Journal of the American College of Nutrition 2 173-199.
23. http://labtestsonline.org/understanding/analytes/alp/tab/test
24. Hyun JL, Dae JK, Jin HH, Kyoung AK, Sang WY, Jong TL 2012: Eosinophilic Infiltration in the Liver: Unusual Manifestation of Hepatic Segmental Involvement. Journal of The Korean Society of Magnetic Resonance in Medicine 16 76-80.
25. Jaeschke H, Hasegawa T 2006: Role of neutrophils in acute inflammatory liver injury. Liver International 26 912-919.
26. James HL, Mary EM, Steven Z, Mary JF, Jeffrey RM, Rene B 2007: Efficacy and safety of high-dose pravastatin in hypercholesterolemic patients with well-compensated chronic liver disease: Results of a prospective, randomized, double-blind, placebo-controlled, multicenter trial. Hepatology 46 1453–1463.
27. Jennifer AB, Kranthi NS, Grace M, Madhuri JS, Thomas M 2013: Vitamin-D level and its correlation with hemoglobin in pediatric sickle cell disease patients. Blood 122 4677.
28. Jerome BS, Robert S 1970: Serum cholesterol esterification in liver disease — importance of lecithin-cholesterol acyltransferase. The New England Journal of Medicine 283 841-846.
29. Jorde R, Grimnes G 2011: Vitamin-D and metabolic health with special reference to the effect of vitamin-D on serum lipids. Progress in Lipid Research 50 303-312.
30. José LP, Laura AM, Gemma V, Javier del PM, Daniel de L, Antonio Due?as L 2009: Clinical study vitamin-D levels and lipid response to atorvastatin. International Journal of Endocrinology 2010 Article ID 320721.
31. Jungert A, Roth HJ, Neuhäuser BM 2014: Associations of serum 25-hydroxycholecalciferol and parathyroid hormone with serum lipids differ by sex and vitamin-D status. Public Health Nutrition 30 1-8.
32. Khaled H, Serge C, Kamel J, Slaheddine M, Samiha L, Dorra A, Fatma A, Abdelfattah E 2009: 1α,25 Dihydroxyvitamin-D3: Therapeutic and preventive effects against oxidative stress, hepatic, pancreatic and renal injury in alloxan-induced diabetes in rats. Journal of Nutritional Science and Vitaminology 55 215- 222.
33. Konstantinos V, Maria M, Petros MZ, Stamatia D, Eleni V, Basilios T, Angeliki S 2002: Alkaline phosphatase and its isoenzyme activity for the evaluation of bone metabolism in children receiving anticonvulsant monotherapy. Seizure 11 377–380.
34. Lane NE 2010: Vitamin-D and systemic lupus erythematosus: bones, muscles, and joints. Current Rheumatology Reports 12 259-263.
35. Liaskou E, Zimmermann HW, Li KK, Oo YH, Suresh S, Stamataki Z, Qureshi O, Lalor PF, Shaw J, Syn WK, Curbishley SM, Adams DH 2013: Monocyte subsets in human liver disease show distinct phenotypic and functional characteristics. Hepatology 57 385-398.
36. Marwah S, Walls A, Blann AD 2012: Relationship between vitamin-D and red blood cell indices in South Asians and White Europeans. British Journal of Biomedical Science 69 1-3.
37. Merck Manual 2013: Eosinophilic Disorders by Mary Territo. www.merckmanuals.com
38. National Institutes of Health. Health Information. Department of Health and Human Services, U.S.A. http://www.nih.gov.
39. Ohnaka T 1993. Health effects of ultraviolet radiation. Journal of Physiological Anthropology 12 1-10.
40. Osborne JE, Hutchinson PE 2002: Vitamin-D and systemic cancer: Is this relevant to malignant melanoma? British Journal of Dermatology 147 197–213.
41. Patricia FL, Philip S, Allister J G, David HA 2002: Recruitment of lymphocytes to the human liver. Immunology and Cell Biology 80 52–64.
42. Ponda MP, Dowd K, Finkielstein D, Holt PR, Breslow JL 2012: The short-term effects of vitamin-D repletion on cholesterol: a randomized, placebo-controlled trial. Arteriosclerosis, Thrombosis, and Vascular Biology 32 2510-2515.
43. Ponda MP, Huang X, Odeh MA, Breslow JL, Kaufman HW 2012: Vitamin-D may not improve lipid levels: a serial clinical laboratory data study. Circulation 126 270-277.
44. Raiza P, Michelle M, Suchetha KN, Damodara GKM, Jayaprakash SK 2014: Evalation of relationship between markers of liver function and the onset of type 2 diabetes. Nitte University Journal of Health Science 4 90-93.
45. Ramaiah SK, Jaeschke H 2007: Role of neutrophils in the pathogenesis of acute inflammatory liver injury. Toxicological Pathology 35 757-766.
46. Schmid A, Walther B 2013: Natural vitamin-D content in animal products. Advances in Nutrition 4 453-462.
47. Shankar SR, Bijlani RL, Baveja T 2002: Effect of partial replacement of visible fat by ghee (clarified butter) on serum lipid profile. Indian Journal of Physiology and Pharmacology 46 355- 60.
48. Shaoqing H, Christopher M, John ZL, Rita G, Lisa K, Nick VG, Jonathan CC, Helen HH 2010: A Sequence Variation (I148M) in PNPLA3 Associated with Nonalcoholic Fatty Liver Disease Disrupts Triglyceride Hydrolysis. The Journal of Biological Chemistry 285 6706–6715.
49. Shu M, Masuomi T, Takeshi K, Kiyoe K, Henpiru O, Akira A, Ryo I, Shu T, Toshihide K, Yoshihito A, Hiroshi I, Hideki H 2011: Plasma 25-Hydroxyvitamin-D Is Independently Associated with Hemoglobin Concentration in Male Subjects with Type 2 Diabetes Mellitus. International Journal of Endocrinology 2011 362981 doi: 10.1155/2011/362981.
50. Silver DS 2011: Calcium and vitamin-D controversies. Rheumatic Disease Clinics of North America 37 351-363.
51. SPSS software, Version 16.00, IBM Corporation, USA.
52. Sun X, Cao ZB, Tanisawa K, Ito T, Oshima S, Ishimi Y, Tabata I, Higuchi M 2014: Associations between the serum 25(OH)-D concentration and lipid profiles in japanese men. Journal of Atherosclerosis and Thrombosis PMID:25346256.
53. Touvier M, Deschasaux M, Montourcy M, Sutton A, Charnaux N, Kesse GE, Assmann KE, Fezeu L, Latino-Martel P, DruesnePecollo N, Guinot C, Latreille J, Malvy D, Galan P, Hercberg S, Le CS, Souberbielle JC, Ezzedine K 2014: Determinants of vitamin-d status in caucasian adults: influence of sun exposure, dietary intake, socio-demographic, lifestyle, anthropometric and genetic factors. Journal of Investigative Dermatology Sep 11. doi: 10.1038/jid.2014.400.
54. www.infinitheism.com: Discover The Effects of Sunlight! Posted by Infinitheism Admin on February 5th, 2014 and filed under Featured, Health.
55. Zhou-wen C, Li-ying C, Hong-lei D, Jian-hua C, Li-zheng F 2008: Relationship between alanine aminotransferase levels and metabolic syndrome in nonalcoholic fatty liver disease. Journal of Zhejiang University Science B. 9 616–622.
|
 IJCRR
IJCRR 


 This work is licensed under a Creative Commons Attribution-NonCommercial 4.0 International License


