IJCRR - 9(7), April, 2017
Pages: 05-10
Date of Publication: 11-Apr-2017
Print Article
Download XML Download PDF
Changes in Levels of Soil Carbon and Forest Floor Carbon Stocks in the different Temperate Forests of Garhwal Himalaya
Author: Ram Krishan, Om Prakash Tiwari, Yashwant Singh Rana, Ashish K. Mishra, C. M. Sharma
Category: General Sciences
Abstract:Objectives: Since soil carbon (C) is a principal source of energy for the nutrient-recycling activities of heterotrophic soil organisms, the maintenance of belowground C stocks is vital for sustaining forest productivity.
Methods: The present study was conducted in temperate region of the Garhwal Himalaya during the year 2014-2016 to assess the belowground carbon flux in the forest ecosystem. In the study, we studied the component wise belowground carbon flux in trees, soil organic carbon (SOC) and litter carbon of six different forest types for measuring total belowground carbon allocation (TBCA).
Results and Conclusion: The total belowground carbon of live trees varies 20.02 to 60.58 MgC/ha, whereas stock root carbon (14.01-38.27 MgC/ha), lateral roots carbon (5.24-17.57 MgC/ha) and fine root carbon (0.67-12.2 MgC/ha) in selected forest types were recorded. The maximum SOC was exhibited by Abies pindrow forest (110.83\? 5.04 MgC/ha), followed by Pinus roxburghii forest (108.22\?13.03MgC/ha), Quercus floribunda forest (97.37\?7.64 MgC/ha), whereas minimum SOC was recorded in Cedrus deodara forest (56.94\?5.13 MgC/ha). The maximum value of litter carbon was recorded for Abies pindrow forest (2.94\?1.02 MgC/ha), followed by Quercus semecarpifolia forest (2.22\?0.33 MgC/ha), Quercus floribunda forest (2.06\?0.28 MgC/ha), Cedrus deodara forest (1.86\?0.26 MgC/ha), Quercus leucotrichophora forest (1.44\?0.27 MgC/ha), Pinus roxburghii forest (0.84\?0.10 MgC/ha). Forest ecosystem in Garhwal Himalaya appears to be the most conducive soil\?climatic environment for higher accumulation of SOC, thus helping in maintaining the soil quality. The study showed that belowground carbon stocks in Abies pindrow forests seems has maximum in carbon assimilatory capacity, whereas Cedrus deodara forest has minimum BGC stocks. There is a huge potential to increase SOC potential through the soil conservation and hence should be implemented.
Keywords: Soil organic carbon, Biomass, Garhwal himalaya, Climate change
Full Text:
Introduction:
Carbon sequestration through forestry has immense potential and plays a significant role in solving critical global environmental problems such as atmospheric accumulation of Green House gases (GHG) and climate change. Estimates of existing C stock pools, stored in various forest types can be helpful in making decisions about C management. Forest biomass constitutes the largest terrestrial carbon sink for CO2 removal from the atmosphere through the process of photosynthesis. Forests absorb CO2 from the surrounding atmosphere and store carbon in their different components like wood, leaves, litter, roots and soil allocating as “carbon sinks” (Haripriya, 2003). The major carbon pools in forest ecosystem are plant biomass (above and below ground), coarse woody debris, litter and soil (Sharma et al., 2016a). In most forested ecosystems, the majority of the carbon is stored below ground as roots and decaying biomass or as dead organic matter (DOM). Forest floor contribute large amounts of organic material to the soil in the form of different components such as leaves, twigs, branches, reproductive parts, fruits, where their decomposition releases different nutrients into the soil (Tandel et al., 2009). However, belowground biomass (stock, lateral and fine roots components of trees) also plays an important role in carbon sequestration. Total Belowground Carbon (TBGC) is a large fraction of gross primary production (more than 30%) (Ryan et al., 1994; Gower et al., 1996). In some ecosystem, amount of TBGC can surpass the values of aboveground net primary production (Law et al., 1999) and provides the principal source of detritus C to mineral soil. Despite the significant role of TBGC in the C budget of terrestrial ecosystems, controls on TBGC are poorly understood. There is a large dissimilarities in the rate and the length of time that forest floor carbon may sequestered in soil that are related to the vegetation productivity, biological and physical conditions in the soil, the past history of soil organic carbon inputs and various disturbances including physical and anthropogenic (Post and Kwon, 2000).
Forest ecosystem in Garhwal Himalaya appears to be the most conducive soil–climatic environment for higher accumulation of SOC, thus helping in maintaining the soil quality. It is essential to examine the changes in carbon fluxes derived from land-use change patterns to obtain basic information on the carbon contents associated with the various stocks of the natural forests. In earlier studies from Garhwal Himalaya, various researchers (Chaturvedi et al., 1982; Rawat and Singh, 1988; Adikari et al., 1995) from Kumoun Himalaya and (Sharma et al., 2010; Gairola et al., 2011; Sharma et al., 2016c) from Garhwal Himalaya attempted to predict biomass and carbon stocks. The present paper aimed at the assessment of the forest diversity, componentised contribution of belowground carbon accumulation of tree species, litter fall and soil organic carbon (SOC) stocks of the different forests of Garhwal Himalaya under temperate conditions.
Method and methodology:
Study area
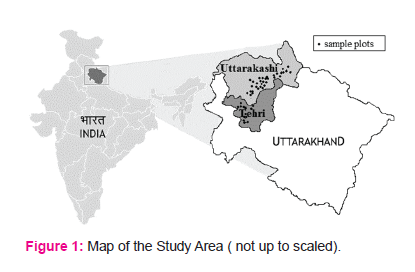
The Uttarakhand state is located in North-West part of the country. Its geographical area is 53,483 km2 which constitutes 1.63% of total area of the country (FSI, 2013). The present study was conducted in temperate region of the Garhwal Himalaya during the year 2014-2016 to assess the belowground carbon flux in the forest ecosystem. The study area is located in Uttarkashi and Tehri district of Garhwal Himalaya along the catchment area of Bhagirathi River (tributary of river Ganga). In this study, general survey of the area was carried out at selected sites of Tehri and Uttarkashi district of Garhwal Himalaya (Figure1). After the reconnaissance survey, we selected following six dominant forest types were named according to the classification given by Champion and Seth (1968) viz,
(i) Pinus wallichiana forest (PF) - Pine Forest (9/C1b)
(ii) Quercus leucotrichophora forest (QLF) - Ban Oak forest (12/C1a)
(iii) Quercus floribunda forest (QFF) - Moru Oak Forest (12/C1b)
(iv) Quercus semecarpifolia forest (QSF) - West Himalayan Upper Oak Forest (12/C2b)
(v) Cedrus deodara forest (CF) - Dry Deodar Forest (13/C2b)
(vi) Abies spectabilis forest (AF) - West Himalayan Sub-alpine Fir Forest (14/C1a)
Methodology:
To analyse the forest vegetation on different ridge tops, 10 sample plots of 0.1 ha each were laid out in 6 selected ridge tops of each forest types (10 plots × 06 forest types = total 60 sample plots). All individuals ≥ 10 cm diameter at breast height (DBH = 1.37 m from ground) were considered as tree in each sample plot. The DBH and height of all the trees falling within the sample plot were measured by tree Calliper and Ravi multimeter respectively. The tree height on different slope positions was measured following MacDicken et al. (1991). The slope correction was employed for the sample plots which are located on a slope > 10%, so that the adjustment can be made to the plot area at the time of analysis. The slope angle was measured by clinometer.
The biomass of the tree species were calculated by regression equations. The tree components (bole, bole bark, branches, twigs, leaves, stump roots, lateral roots, fine roots) were calculated by various equations developed by Rawat and Singh (1988), Garkoti and Singh (1992) and Adhikari et al. (1995). Biomass equations by tree components were developed to relate oven dry weight to tree cbh. The form of the allometric function of the equation was:
Ln Y= a + b Ln X
Where, Y is weight of tree component in kilograms, and X is tree circumference in centimetres measured at breast height (CBH), a and b is the intercept and slope of the particular tree species respectively. The total Carbon density (TCD) was estimated by the following formula (Sharma et al., 2010):
Carbon (C Mg/ha) = Biomass (Mg/ha) ×Carbon %
Forest litter was collected by using 1×1m randomly placed quadrat at three places in 0.1ha sample plot. Litter was collected three times in a year consisted of basically fresh and partially decomposed leaves, bark and reproductive parts. Fresh weight was determined in the field. The collected litter was brought to the laboratory and oven dried at 800C up to the constant weights. The biomass hence obtained from the detritus was then multiplied by appropriate carbon fraction according to IPCC (2006) and extrapolated for a hectare.
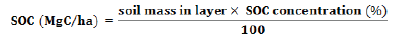
For organic C determination, the soil samples were sieved through a 2 mm sieve and then thoroughly mixed. Modified Walkley and Black’s rapid titration method (Walkley, 1947) was used to estimate the SOC content in the collected soil samples (Mehta et al., 2014). The contents of organic carbon in soil estimated in percentage were then converted to tonnes per hectare using bulk density, depth of soil and area.
Results:
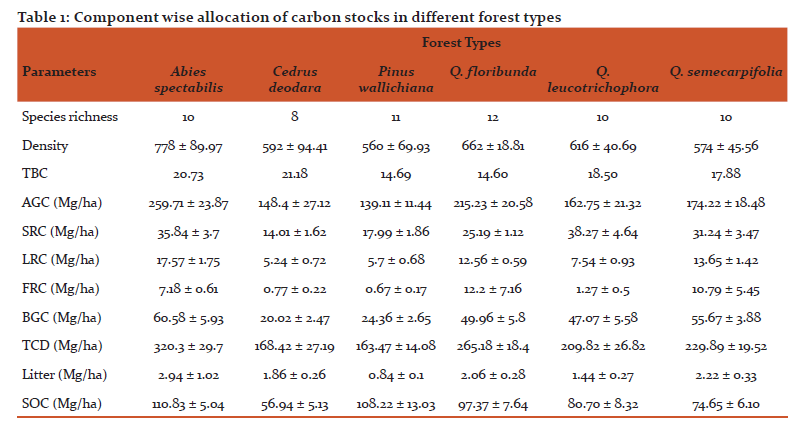
The mean values of density, species richness and belowground carbon allocation in different forest types are shown in table 1. A total of 27 tree species were occurred in all six studied forest types, out of which highest 12 species were recorded in QFF and least 8 species were found in CF. The highest stem density was seen AF (778 ± 89.97 trees/ha) followed by QFF and the lowest density seen in pine forest (560 ± 69.93 trees/ha). The different studied forests showed their distribution above 1500m asl. upto 3500 m asl. with QFF have showed narrow distributional range whereas, QLF and QSF distributed over broad elevational range.
The total live tree carbon stocks in these studied forest types were seen in the range of 163.47 ± 14.08 Mg C ha-1 to 320.3 ± 29.7 Mg C ha-1, Out of which the variation in TBCA seen in the range of 20.02 ± 2.47 to 60.58 ± 5.93 Mg C ha-1. AF had the highest value of carbon stock followed by PF, CF had the lowest TBCA in case of conifer dominated forests. In case of broad-leaved forests, QSF forests has highest carbon stocks value, whereas QFF and QLF had showed carbon stocks in the range of 49.96 ± 5.8 Mg C ha-1 and 47.07 ± 5.58 Mg C ha-1 respectively. In our study, the component wise distribution of carbon in burial parts of trees shows that stock roots (14.01-38.27 MgC/ha) stores more carbon than other roots followed by lateral roots carbon (5.24-17.57 MgC/ha) and fine root carbon (0.67-12.2 MgC/ha) in selected forest types were recorded. In different forest types, QLF shows highest value of Stock roots Carbon, AF shows highest value of Lateral roots carbon and QFF shows highest carbon storage in lateral roots system. However, mean value of aboveground biomass and carbon stocks are seen in highest in AF (259.71 ± 23.87 MgC/ha) followed by QFF (215.23 ± 20.58 MgC/ha) and least value in PF (139.11 ± 11.44 MgC/ha).
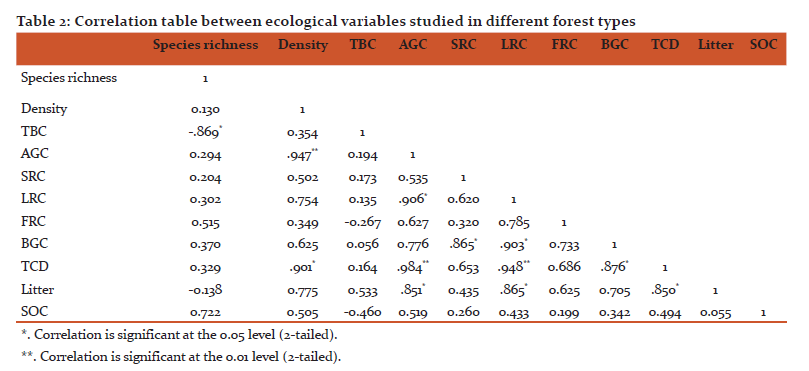
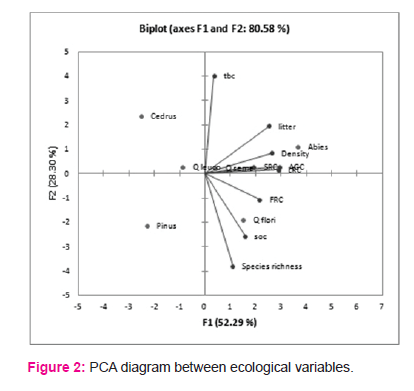
The soil organic carbon (SOC) in different forest types are shown in Table 1. The maximum value of litter carbon was recorded for Abies pindrow forest (2.94±1.02 MgC/ha), followed by Quercus semecarpifolia forest (2.22±0.33 MgC/ha), Quercus floribunda forest (2.06±0.28 MgC/ha), Cedrus deodara forest (1.86±0.26 MgC/ha), Quercus leucotrichophora forest (1.44±0.27 MgC/ha), Pinus roxburghii forest (0.84±0.10 MgC/ha). The maximum SOC was exhibited by Abies pindrow forest (110.83± 5.04 MgC/ha), followed by Pinus roxburghii forest (108.22±13 MgC/ha), Quercus floribunda forest (97.37±7.64 MgC/ha), whereas minimum SOC was recorded in Cedrus deodara forest (56.94±5.13 MgC/ha). The correlation between different carbon components and diversity indices are shown in table 2. Total basal cover and species richness show negative correlation, however density shows positive correlation with AGC and TCD. The patterns of variations in different forest types across different ecological varibles are presented by mean of PCA diagram (Figure 2). The distance between ecological parameters (blue dots) approximates the dissimilarity of distribution of relative abundance of those species across these forests. The distance between forests (red dots) show which ecological parameter effects the forest composition within the forest and between the forests.
Discussion:
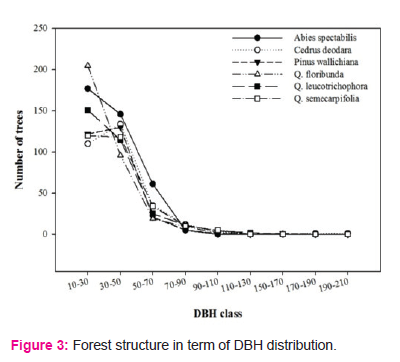
Along with the climatic variations, lower elevational QLF had comparatively higher number of species than lower number of species was found at higher elevational AF, which implies the climatic adaptation of plant species. There is also seen exponential decline in biomass and carbon increment with increasing DBH as observed in our study is primarily related to the age of trees (Figure 3). Elevation and temperature, rainfall are main physical factors for forest structure and carbon allocation in different in Garhwal Himalaya. Forests in studied area were mature with higher girth values as they were undisturbed. According to Saxena et al. (1979), trees with higher girths indicate the best representation of a species in the particular forest in specific environmental conditions whereas, lower girths either indicate the chance occurrence of the species in that area or show presence of the biotic disturbance in the past. Age-related declines in carbon stocks are widely documented (e.g., Pregitzer and Euskirchen, 2004; Bradford and Kastendick, 2010; D’Amato et al., 2011).
Tree biomass and carbon stocks in forest ecosystems vary with forest type, species composition, stand age, size class of trees, site conditions, rainfall pattern and altitude (Sharma et al., 2016a; 2016b; 2016c; Gairola et al., 2011; Zhao et al., 2014). The values of belowground biomass density in the present study ranged between of 20.02 ± 2.47 to 60.58 ± 5.93 Mg C ha-1. Negi et al. (2003) observed that the conifers have maximum C stored followed by mixed and broad leaved forests. The BGCA values obtained were lowered than Sheikh et al 2012 but followed the values reported by Sharma et al. (2010). These values are higher than earlier reported values from Garhwal Himalaya, comparative values of TBD and TCD from Uttarakhand and other parts of India.
Type stratum AF in general exhibited higher values for higher SOC density (110.83± 5.04 MgC/ha) followed by in PF (108.22±13.03 MgC/ha) and lowest value of SOC were calculated in QSF (74.65±6.10 MgC/ha) which may be due to the presence of mature girth classes compared to other type strata and existence of coniferous leaves, which generally decompose slower than leaves of broadleaf species (Mendoza-Vega et al., 2003). Lower temperatures may be also one of the reasons for highest carbon stocks at higher altitudes Schlesinger (1997). However, Liebens and VanMolle (2003) also reported the soils of coniferous forest might store more SOC per hectare than broadleaf forest soils. Litter fall carbon also shower highest value in AF (2.94 ± 1.02 MgC/ha) and lowest in PF (0.84 ± 0.1 MgC/ha). Hobbie et al. (2006) also found that litter turnover rate was positively correlated with mean annual soil temperature.
The study showed that belowground carbon stocks in Abies pindrow forests seems has maximum in carbon assimilatory capacity, whereas Cedrus deodara forest has minimum BGC stocks. These Forest floor thus play a key role in the global carbon budget in Garhwal Himalaya and can have large impact on carbon release under a climate change scenario (Lal, 2002). These forests have huge potential to increase SOC potential through the soil conservation and hence should be implemented.
As the climate change issues became prominent on political and corporate agenda, it is duty of people of India and other countries to start recognizing their responsibility towards taking action against global warming. The prevention of deforestation and promotion of afforestation have often been cited as strategies to slow down global warming and climate change (Bala et al., 2007) and help in increase to sinks more carbon from their present potential. Agro forestry practices are the agents that can enhance the ability of forest to sink more carbon (Ahmed et al., 2016). Alternate production of energy like Hydro power and solar energy can significantly reduce the pressure on forest in terms of fuel wood removal.
Conclusion:
The present study showed the AF, CF and oak forests and stored more biomass and carbon stocks than other forests; hence these forests have higher potential C sinks to tone down the global warming consequences as well as meet our future energy demands. Data obtained through regular assessments of these carbon stocks will yield knowledge on the impacts of particular conservation and management regimes on the forest resources that can assist the enhanced carbon management. Optimized forest management with regard to conservation should implement to secure a high productivity of the forest and avoid disturbances as much as possible. Sustainable use of the forest resources will enable us to conserve them for future generation.
Acknowledgements:
Authors acknowledge the immense help received from the scholars whose articles are cited and included in references of this manuscript. The authors are also grateful to authors / editors / publishers of all those articles, journals and books from where the literature for this article has been reviewed and discussed.
Source of Funding:
The authors are also thankful to Department of Science and Technology, Government of India, New Delhi, India for providing financial support (Project No. SERB/SR/SO/PS/14/2010) and also one of the author is thankful to University Grant Commission, India for providing fellowship under Rajiv Gandhi National fellowship for SC scheme.
Conflict of interest:
The authors declare that they have no conflict of interest.
References:
Adhikari BS, Rawat YS, Singh SP. Structure and function of high altitude forests in Central Himalaya. II. Nutrient dynamics. Annals of Botany 1995; 75:249–258.
Ahmed A, Kurian J, Raghavan A. Biochar influences on agricultural soils, crop production, and the environment: A review. Environmental Reviews 2016; 24(4):495–502.
Bala G, Caldeira K, Wickett M, Phillips TJ, Lobel DB, Delire C, Mirin A. Combined climate and carbon-cycle effects of large scale deforestation. Proceedings of National Academy of Science, USA. 2007; 104:6550–6555
Chaturvedi OP, Singh SP. Total biomass and biomass production of Pinus roxburgii trees growing in all-aged natural forests. Canadian Journal of Forest Research 1982; 12:632–640.
FSI. State of Forest Report 2013, Dehradun, India: Forest Survey of India, Ministry of Environment and Forests, Government of India; 2013. p. 209–211
Gairola S, Sharma CM, Ghildiyal SK, Suyal S. Live tree biomass and carbon variation along an altitudinal gradient in moist temperate valley slopes of the Garhwal Himalaya (India). Current Science 2011; 100(12):1862–1870.
Garkoti SC, Singh SP. Biomass, productivity and nutrient cycling in alpine Rhododendron community of Central Himalaya. Oecologia Montana 1992; 2:21–32.
Gower ST, Pongracic S, Landsberg JJ. A global trend in belowground carbon allocation: can we use the relationship at smaller scales? Ecology 1996; 77:1750–1755.
Haripriya GS. Carbon budget of the Indian forest ecosystem. Climatic Change 2003; 56 (3):291–319.
IPPC. Climate Change 1995 Impacts, adaptations and mitigation of climate: scientific –technical analyses. In contribution of II to the second assessment report of the Intergovernmental Panel on Climate Change. U. K.: Cambridge University Press, Cambridge; 1996.
Lal R. The potential of soils of the tropics to sequester carbon and mitigate the greenhouse effect. Advances in Agronomy 2002; 74:155–192.
Law BE, Ryan MG, Anthoni PM. Seasonal and annual respiration of a ponderosa pine ecosystem. Global Change Biology 1999; 5:169–82.
Liebens J, VanMolle M. Influence of estimation procedure on soil organic carbon stock assessment in Flanders, Belgium. Soil Use and Management 2003; 19(4):364–71.
Mehta JP, Shreshthamani, Bhatt VP. Analysis of the physico-chemical properties of the soil and climatic attribute on vegetation in Central Himalaya. Nature and Science 2014; 12(11):46-54.
Negi JDS, Chauhan PS, Negi M. Evidences of climate change and its impact on structure and function of forest ecosystems in and around Doon valley. Indian Forester 2003; 129:757–769.
Post WM, Kwon KC. Soil carbon sequestration and land-use change: processes and potential. Global Change Biology. 2000; 6:317–327.
Pregitzer KS, Euskirchen ES. Carbon cycling and storage in world forests, biome patterns related to forest age. Global Change Biology 2004; 10:2052–2077.
Rawat YS, Singh JS. Structure and function of Oak forests in Central Himalaya. I. Dry matter dynamics. Annals of Botany 1988; 62(4):397–411.
Ryan MG, Linder S, Vose JM, Hubbard RM. Dark respiration in pines. In: Gholz HL, Linder S, McMurtrie RE, editors. Ecological Bulletins 43, Environmental constraints on the structure and productivity of pine forest ecosystems: a comparative analysis. Uppsala, Sweden: Munksgaard; 1994. p 50–63.
Saxena AK, Singh JS. A phytosociological analysis of woody species in forest communities of a part of Kumaun Himalaya. Vegetatio 1982; 5:03–22.
Sharma CM, Baduni NP, Gairola S, Ghildiyal SK, Suyal S. Tree diversity and carbon stocks of some major forest types of Garhwal Himalaya, India. Forest Ecology and Management 2010; 260:2170–2179
Sharma CM, Mishra AK, Krishan R, Tiwari OP, Rana YS. Variation in vegetation composition, biomass production, and carbon storage in ridge top forests of high mountains of Garhwal Himalaya. Journal of Sustainable Forestry 2016a; 35 (2):119–132.
Sharma CM, Mishra AK, Krishan R, Tiwari OP, Rana YS. Impact of climate on structure and composition of ridge top forests in Garhwal Himalaya. Taiwania 2016b; 61(2):61–69.
Sharma CM, Tiwari OP, Rana YS, Krishan R, Mishra AK. Plant diversity, tree regeneration, biomass Production and carbon storage in different Oak forests on ridge tops of Garhwal Himalaya. Journal of Forest and Environmental Science. 2016c; 32(4):329–343.
Tandel M B, Kukadia M U, Kulambe B N, Jadeja D B. Influence of tree cover on physical properties of soil. Indian Forester, 2009; 135(3):420–424
Walkley A. A critical examination of a rapid method for determining organic carbon in soils: effect of variations in digestion conditions and inorganic soil constituents. Soil Science 1947; 63:251–264.
Zhao J, Kang F, Wang L, Yu X, Zhao W, Song X, Zhang Y, Chen F, Sun Y, He T, Han H. Patterns of biomass and carbon distribution across a chronosequence of Chinese pine Pinus tabulaeformis forests. PLoS One 2014; (4):e94966. Doi:10.1371/journal.pone.0094966.
|
 IJCRR
IJCRR 


 This work is licensed under a Creative Commons Attribution-NonCommercial 4.0 International License


