IJCRR - 9(21), November, 2017
Pages: 45-53
Print Article
Download XML Download PDF
Optimization study of sweeteners for preparation of syrup for sugar free Traditional sweet: Gulab jamun
Author: Radha Kushwaha, Vinti Singh, Maya Prakash, Devinder Kaur
Category: Healthcare
Abstract:Aim: Study was conducted with artificial sweetener based syrups to be used in the preparation of Gulab jamun with an objective to get low calorie foods.
Methods: The sweeteners used in the study were Stevia, Maltitol and Sucralose. For sugar free product the syrup concentration was optimized using response surface methodology. A rotatable central composite design (CCRD) was applied on three controlled variables viz. Maltitol, Stevia and Sucralose. Sweetness, lingering sweetness, color, softness, and textural properties were evaluated by trained sensory panelists using combined methods Quantitative Descriptive Analysis. Texture and taste profile was done by Texture Profile Analyzer and Electronic Tongue respectively.
Results: Threshold values for Stevia, Maltitol and Sucralose were 0.0027, 1.78, and 0.005% respectively. The hardness of fresh Gulab jamun samples ranged from 1.8-3.86N. E-tounge graph shows the variance of 2DFA (DF1 and DF2) in which DF1 ranges from 89.61 -96.54% and DF2 ranged between 3.05-8.83%.
Conclusion: All three responses were significantly (p < 0.05) affected by the combinations of independent variable. The numerical optimization suggested a proportion (% w/w) of maltitol: stevia: sucralose in 5.92:0.0325:0.0054 with high overall acceptability.
Keywords: Gulab jamun, Response surface methodology (RSM), central composite design, Sugar substitute, Quantitative Descriptive Analysis
Full Text:
Introduction
Sweets plays very important role in our society. Sweets which are made from sugar adds calorie intake of consumer. Additional intake of sweets which are prepared from sugar causes diabetes, it also causes obesity and overweight. Obesity and overweight in people are associated with various risk factors for cardiovascular disease [1, 2]. People suffering from Diabetes are advised to restrict the use of sugars. To avoid these risks nowadays artificial or alternative sweeteners are in use. Use of these artificial sweeteners can help to maintain weight and normal blood glucose level [3]. Sweeteners are not only providing flavor to foods but they can also used to preserve foods, provide body and texture, enhance other flavors and facilitate fermentation process.
Stevia and Sucralose belongs to high intensity sweeteners which added in many food products like diabetic and dietetic baked products, confectionary and dairy based products. Storage studies of artificially sweetened lassi with binary sweeteners found beneficial to consumer choices for low calorie products [4, 5]. Use of low calorie sweeteners in various products sometimes reduces costs and enhances product taste and stability. Polyols/bulk sweeteners can be used alone or with the combination of artificial sweeteners [6]. A large number of sweeteners available, each one can be used in the situations they are best suited for [7]. Sensory analysis could be an important tool in product development. Sensory analysis is an effective way to give accurate quality assessment, but it is also have limitation by various factors such as taste saturation and sweetness differences if any sample has very minute changes. So it is an urgent problem to find a rapid, simple, credible way to determine the sweetness differences among samples [8]. To overcome the above problem Electronic tongue (E-tongue) used, it is a mimic of human taste device and have been fruitfully applied to discriminating different beers, milk [9, 10], fruit juices [9-13]. Keeping significance of these sweeteners in mind, this present work was done to check the texture and overall acceptability of products with blend of sweeteners in Gulab jamun. It is a traditional food prepared by a mixture of khoa and refined wheat flour with baking powder. Response Surface Methodology (RSM) was found to the most effective tool for optimization process and to understand the interaction of various variables and find the optimum concentration of components that affects the responses.
MATERIALS AND METHODS
Materials
Maltitol and Sucralose food grade sample was procured from laboratory of CFTRI, Mysore, Stevia food grade sample was procured from Stevia World Agrotech Pvt, Ltd. Bangalore, Gulab jamun mix of MTR Bangalore, palm oil purchased from local market.
Threshold measurements
Threshold test for the sugar and intense sweeteners were conducted as per the method IS: 5126[14]. This arithmetic series was ranges from 0.1 to .6% for sugar was prepared and tasted by trained panelists. The arithmetic series for sweeteners were ranges from Maltitol (0.15 to 0.9%) Stevia (0.005 to 0.03%) and Sucralose (0.0025 to 0.0125%).
Time-Intensity
This test was performed according to method of Patil et al. [15]. A known concentration of sweeteners were taken for the preparation of syrup solution and presented this set to trained panelists. The panelists were asked to mark the intensity of the perceived sensation on the score card.
Preparation of syrup and Gulab jamun
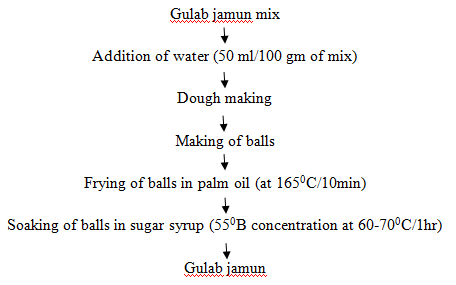
Sugar syrup was prepared by dissolving 100g sugar in 50 mL of water and then boiled for 5 minutes on medium heat. Optimization of Maltitol syrup, Stevia, and Sucralose as the blend for the preparation of low calorie syrup than sugar syrup are given below in table 1. Weighed the given amount of sweetener in which added 5 ml of water and dissolved properly. Thus for the preparation of syrup all the sweeteners increased 10 times and dissolved in 30 mL of water and boiled for 4-5 minutes on medium heat, and concentration should be 550B [6].
Rheological properties of syrup
Rheological properties of the syrup made by different type of sweeteners were measured by using a Rheaometer (MCR 52, Anton Paar Graz, Australia). For rheological measurement used Measuring plate of PP75 with Rotational tests at controlled shear rate (CSR). All rheological measurements were conducted to duplicate samples [0-200 shear rate (1/s)].
Electronic Tongue analysis of syrup
Electronic Tongue (Auto-sampler, Model: ASTREE, α- M.O.S, Toulose, France) was used for analysis of the syrups to get the pattern matching of sweetness among them. Acquisition Delay 0.0(s); Acquisition time 120(s); Acquisition period 1.0(s); and Stirring rate 1.0 were used for analysis.
Texture analysis of Gulab jamun
The texture properties of the Gulab jamun prepared with different syrup was measured by force in compression using a Texture Analyzer (Model:TA-HDi Texture Analyzer). For the textural analysis 50 mm dia. cylinder aluminum probe was used. The load cell was 50 kg and the crosshead speed was 10mm/min. the peak force which is required to compress Gulab jamun was recorded in Newton's (N).
Sensory analysis
Sensory analysis should be carried out in the sensory booth room consisted of individual booths equipped with fluorescent lights, temperature maintained at 25�20C, and free from noise and odor built as per the standard conditions according to ASTM 1996[16]. The selected panel consisted of 10 judges from Sensory Science department who regularly participated in sensory analysis studies.
Method of scaling
For sensory analysis of product Quantitative descriptive analysis (QDA) method of intensity scaling was followed [17]. This score card consisted of 15 cm QDA scale where in 1.25 cm was showed detection threshold and 13.75 cm saturation threshold. Panel members were asked to mark the perceived intensity of the attribute by drawing a line on the scale.
Statistical analysis and Experimental design
All experiments were conducted in triplicate and the mean were reported. Discriminant function analysis (DFA), optimization design (response surface methodology), generation of response surfaces were created by using statistical software SPSS for identifying attributes causing affect among the samples.
Central composite design
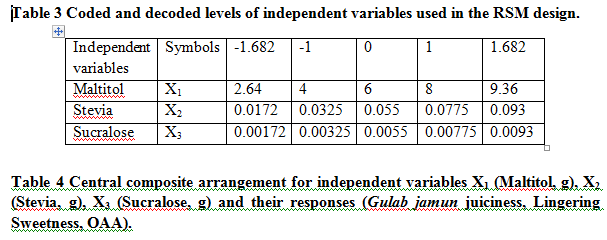
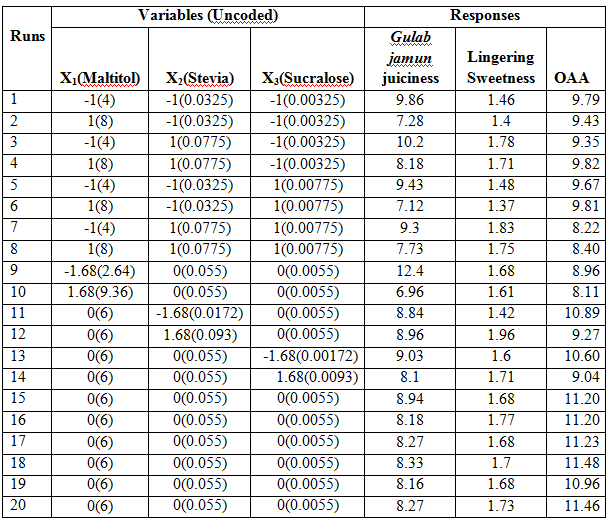
The central composite rotatable design (CCRD), Design Expert version 7.0.0 Stat-Ease, USA was used in designing the experiments. Twenty experiments were carried out according to design with 3 factors 5 levels for each variable. Five levels of variables were applied to study the responses pattern viz., Gulab jamun juiciness, lingering sweetness and overall acceptability on QDA scale. A rotatable central composite design was applied to optimize the syrup formulation (Table 4). The independent variables that were optimized are: Maltitol (X1), Stevia (X2) and Sucralose (X3) (Table 3). Levels of these 3 independent variables were selected on the basis of laboratory trials. The effect of all three independent variables on juiciness, lingering sweetness and overall acceptability were investigated using central composite rotatable design.

Yk= β0 + β1x1 + β2x2+ β3x3 + β11x12 + β22x2 2+ β33x32 + β12x1x2 + β23x2x3 + β13x1x3 (Eq.2)
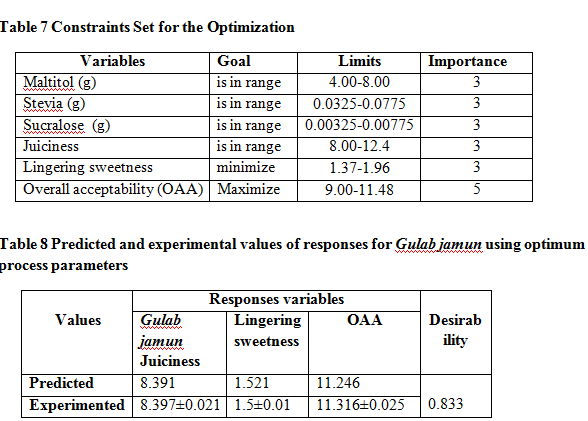
The predicted values were obtained from the regression equation and analyzed for coefficient of determination (R2), standard error. Analysis of the coefficients of regression models was carried out using analysis of variance (ANOVA) technique to know the significance of each coefficient. The lack of fit was also calculated. Response surface plots were developed using second order polynomial models for all responses keeping the two processing variables at centre point. A second-order polynomial equation was used to fit the experimental data given in Table 4. Different constraints were set for independent and dependent variables along with their relative importance (Table 7). Optimization of the fitted polynomials was done using a desirability function [18]. The optimum condition was verified by conducting experiments at predicted values of variables. Responses were monitored and results were compared with model predictions.
RESULTS
Threshold measurements
The psychometric study showed that the threshold values for Stevia, Maltitol and Sucralose was 0.0027, 1.78, and 0.005% respectively.
Time- intensity profile of Gulab jamun Syrup
Time intensity tests are conducted to recognize the persistence rates of the samples in mouth. Persistence is explained by localized increase in the stimulus concentration in the receptor environment resulting from the ionic surface of proteins in the taste cell membrane [15]. Generally the taste intensity of the compound decreases with time. A 10 second time interval
Rheological properties of syrup
The effects of concentration of sweeteners on rheological properties of syrups are shown in Table 1. There is a significant difference in viscosity of syrups at different concentration of sweeteners .The viscosity of syrup of Gulab jamun was analyzed through 0-200s-1 shear rate. There was gradual decrease with viscosity of all the syrup samples showed with increased shear rate.
Electronic Tongue Analysis
The intensity of sweetness of blend syrup was done by using of e-tongue. Y-axis indicated the voltage difference between the sensor and the reference electrode, and X-axis showed measurement time. DFA pattern showed in the Figure 2 indicates that all samples were different with respect their taste profile as indicated by the clusters formed. The following graph shows the variance of 2DFA (DF1 and DF2) in which DF1 ranges from 89.61-96.54% and DF2 ranged between 3.05-8.83%. It is observed that the distance between all the samples are more thus indicating different taste properties.
Texture Analysis of the Gulab jamun
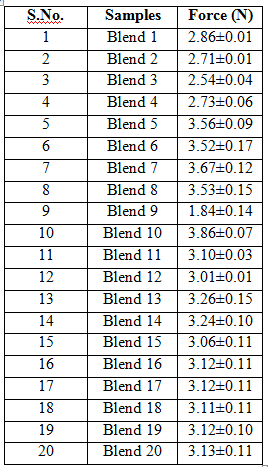
Texture measurements of all the samples were performed in three replicates and average values were reported with their means and relative standard deviation. Table 2 shows the results obtained. Hardness is the measure of stress required to deform a material. It is the peak force (N) of the first compression of the sample. The hardness values of fresh Gulab jamun samples ranged from 1.84-3.86N.
Sensory analysis of Gulab jamun
The Gulab jamun samples were analyzed for sensory quality in terms of color; syrup sweetness; textural attributes such as softness, mealiness, juiciness and chewiness. Milky aroma and lingering sweetness which is typical of intense sweetness were recorded and based on these impact making attributes the overall quality was assessed. Syrup penetration was found to be adequate in all the blend syrup without any separate core in the centre, but it was the least in Gulab jamun which was prepared with blend 7. Similar trends were observed in juiciness of the samples. Gulab jamun prepared with blend 12 had more lingering sweetness than others.
Response surface methodology
The effect of Maltitol, Stevia and Sucralose on juiciness, lingering sweetness and overall acceptability of Gulab jamun are shown in Table 4. The independent and dependent variables were fitted to the second order model equation and evaluated for the goodness of fit. The lack of fit is a measure of the failure of a model to represent data in the experimental domain at which parts were not included in the regression [19].
Effect on juiciness of Gulab jamun
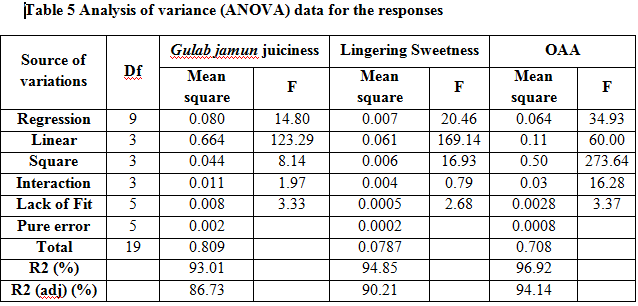
Response surface plot showing the effects of Maltitol, Stevia and Sucralose on the Gulab jamun juiciness are presented in Figure 4A-C. It was observed from ANOVA data that the model was significant (p <0.05) and lack of fit was not significant (Table 5). Test on individual parameters depicts that the juiciness of Gulab jamun was significantly (p<0.05) influenced only by the linear term of Maltitol and all the three quadratic terms, Interaction terms except (X1*X2) were not significant (p>0.05) to affect the juiciness within the experimental domain (Table 5). Coefficient of determination, R2 was 0.9301 suggesting 93.01% of the variability in the data was explained by the model. Therefore, model was adequate to predict the response and interpret the effect of variables on the response. Effects of the independent variables on the juiciness of Gulab jamun were characterized by the response surface and contours (Fig.4A-C). The equation of the model fitted for juiciness of Gulab jamun in the actual form of process variables is
Y1=2.89-0.21X1+0.025X2-0.043X3+0.052X12+0.018X22-0.0025X32+0.030X1X2 0.016X2X3+0.013X1X3 (Eq.3)
Effect on Lingering sweetness
The regression equation for lingering sweetness of Gulab jamun was determined in terms of coded variables as Eq.4. An ANOVA result for quadratic models of lingering sweetness is given in Table 2. Acceptable coefficient of determination value (R2 = 0.9485 suggesting 94.85%) was obtained for significant model of sweetness with not significant lack-of-fit variation. Linear terms of Maltitol, and Stevia and interaction coefficients of same variables X1*X2, had significant (p< 0.05) effects on the lingering sweetness of Gulab jamun. ANOVA also showed that there was a non-significant (p< 0.1513) lack of fit which further validates the model. The 3D response plot (Fig. 5A-C) is the graphical representation of the regression equations from where the values of responses can be predicted with respect to the variable factors. The equation of the model fitted for lingering sweetness is
Y2 = 1.31-0.013X1+0.065X2+1.847E-003 X1X2 (Eq.4)
Effect on Overall acceptability
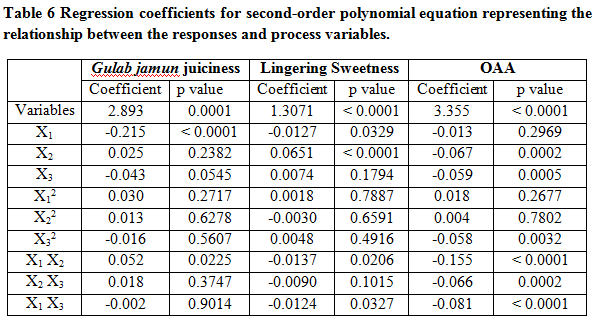
The effects of sweeteners on the overall acceptability among consumers of Gulab jamun are represented by the response surface plots (Fig. 6A-C). The value of R2 is 96.92%, indicates that 3.08% of the total variation was not explained by the model. The value of adjusted determination coefficient (Adjusted R2=94.14%) was high to advocate a high significance of the model and indicated that second order terms were sufficient and higher order terms were not necessary. The magnitude of p-value (Table 6 ) indicates that the effect of all interaction terms, two linear (X2 and X3) and one quadratic (X32) have significant effect at 5% level of significance (p <0.05) on overall acceptability while others are non-significant. ANOVA data showed that model is significant and lack of fit (value, 0.0028) is not significant (Table 5). Overall acceptability scores varied between 8.1 -11.5. The second-order polynomial equation takes the following form.
Y3=3.36-0.013X1-0.067X2-0.0.059X3-0.16X12-0.0663X22-0.081X32+0.018X1X2-0.058X2 X3+0.0043 X1 X3 (Eq.5)
DISCUSSIONS
Time- intensity profile of Gulab jamun Syrup
A 10 second time interval was followed and results were given in Fig.1. After swallowing syrup intensity was higher and then a clear decline in the values of the sweetener (syrup) intensity was observed as the time increased. Souza et al. [20] had found the similar results of jam with the addition of sucrose and jams sweetened with different sweeteners. According to Cliff et al. [21] sweeteners leave an aftertaste in the mouth; a bitter, residual taste, as well as other unwanted characteristics, thus different behaviors of sweeteners compared with sucrose with respect to bitterness were expected
Rheological properties of syrup
Table.1 showed the viscosity change at different shear rates. The gradual decreasing of viscosity with increasing shear rate indicated that all samples belong to non-Newtonian fluid; exhibiting shears thinning liquid properties. Following table showed that Blend 10 has the highest viscosity, followed by blend 5 and Blend 7. Maltitol shows significant and positive effect on the apparent viscosity of blends. Chethana et al. [22] had found the rheograms comprising shear stress and shear rate for different trials show non-Newtonian shear thinning behavior excepting for sorbitol and sucrose solutions.
Electronic Tongue Analysis
All the samples segregated from each other with the level of sweetness as shown in Figure 2. Sample II and III show smaller distances thus indicate lesser variance between the taste properties. Jack and Melissa [23] assessed the feasibility of taste making and compared the taste intensity during formulation development using a multichannel taste sensor system. Taste-making efficiency was evaluated using quinine as a bitter model compound as a sweetener, Acesulfame-K, as a bitterness inhibitor.
Texture Analysis of the Gulab jamun
Maximum hardness was observed in Gulab jamun samples dipped with Blend 10.While minimum hardness was observed in Gulab jamun sample treated with Blend 9 with a value of 1.84N. The softness depends on the absorption of syrup, higher the absorption higher will be the softness. Rao et al. [24] also reported similar results that a high syrup concentration decreased the volume expansion and increased the hardness of Gulab jamun. Chetana et al. [6] found similar trends that lower concentrations of the syrup (450B), there is increased syrup penetration due to the lower viscosity of the syrup and the resulting product was softer.
Sensory analysis of Gulab jamun
Overall quality of all samples was very good. But the results indicate that optimum concentration of sweeteners lie at the midpoint of the range of variables involved as shown Figure 3. Sweetness perception of Gulab jamun was the highest in blend 9 followed by blend 10. Souza et al. [20] determine the equivalent amount of Sucralose and Acesulfame-K essential to endorse the same degree of ideal sweetness in mixed fruit jam and to characterize the time-intensity profile and consumer acceptance.
Effect of sweeteners on juiciness, sweetness, and overall acceptability of Gulab jamun
Response surface plots showed the magnitude of β coefficients revealed that the linear term of maltitol have the maximum negative effect (β= -0.215) where as interaction term of maltitol and stevia have maximum positive effect on juiciness of Gulab jamun.
The magnitude of β coefficients (Table 6) revealed that the interaction term of maltitol and stevia have the maximum negative effect followed by linear term of maltitol content whereas linear term of stevia has positive effect on lingering sweetness of Gulab jamun, which indicates that with increase of maltitol content, there will be decrease in lingering sweetness of Gulab jamun and vice versa with stevia.
From the response surfaces and contour plots it is clear that overall acceptability value showed positive effect with interaction of Maltitol: Stevia and Maltitol: Sucralose content. It is clear from the response surfaces and contour Plots (Fig.5A-C) that with increase in Maltitol, Stevia and Sucralose over all acceptability increased up to some values and further decreased showing that optimum amount of all three factors is acceptable in product. Acosta et al. [25] had worked on tropical mixed fruit jelly to see the effect of three factors or ingredients and they found that sweetener and pectin were non-significant for overall acceptability. The higher values of R2 prove the applicability of proposed model with greater accuracy to study the effect of preparation conditions on the acceptability of the blends.
Optimum concentration
Optimization was done by using a multiple response method called desirability. The optimum concentration was determined by superimposing the contour plots of all the responses and finding the region where amount of sweetener s were 'near' optimal for all the responses [26]. Based on the results, it can be asserted that the Gulab jamun production was dependent on the interaction of the different factors. The predicted values of the responses under optimum condition of concentration are juiciness 8.39, lingering sweetness 1.52, and overall acceptability score 11.25, respectively (Fig.7). The calculated desirability for this formulation was 0.833. This set of concentration was determined to be optimum by the RSM optimization approach and was used to validate experimentally. The experimental values, mean of three trials (Table 8) were found to be in close agreement with the predicted values and were within the acceptable limits showed the adequacy of selected models.
CONCLUSIONS
RSM was successfully applied to assess and model effects of three levels of three ingredients (Maltitol, Stevia and Sucralose) on the overall acceptability of product. In the preparation of Gulab jamun syrup has great effect on the texture and overall acceptability. For the optimization of sweeteners used for preparation syrup Response Surface methodology was found to the best tool. Thus Gulab jamun can be prepared without sugar keeping desirable quality par requirement.
ACKNOWLEDGEMENT
Authors acknowledge the immense help received from the scholars whose articles are cited and included in references of this manuscript. The authors are also grateful to authors / editors / publishers of all those articles, journals and books from where the literature for this article has been reviewed and discussed.
Conflict of Interest
The authors declare that there are no conflicts of interest.
Ethics approval
This article does not contain any studies with human participants or animals performed by any of the authors.
Appendix-I
Table 1 Viscosity values of syrup sample at different shear rate
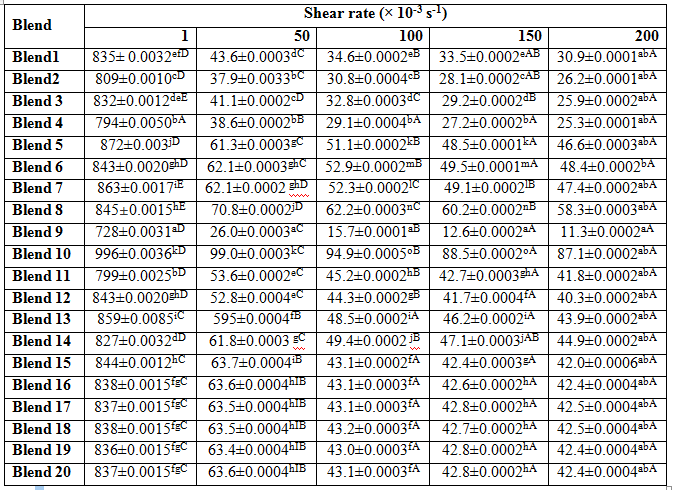
All values are means  standard deviations of data from three independent experiments (n=3). Different superscripts (a-o) with in row and (A-E) in the same column indicate significant difference at P <0.05.
Table 2 Texture analysis of Gulab jamun

References:
- Freedman DS, Dietz WH, Srinivasan SR, Berenson GS. The relation of overweight to cardiovascular risk factors among children and adolescents: the Bogalusa heart study. Pediatr 1999; 103:1175-1182.
- Sumit A. Switching Sweeteners- A sweet approach. Dairy Chemistry Division, N.D.R.I, Karnal, 2008; 221-226.
- Hunty ADL, Gibson S, Aswell M. A review of the effectiveness of aspartame in helping with weight control. Nutr Bulletin 2006, 31:115-128.
- George V, Arora S, Wadhwa BK, Singh AK. Analysis of multiple sweeteners and their degradation products in lassi by HPLC and HPTLC plates. J Food Sci Technol 2010; 47:408-413.
- George V, Arora S, Wadhwa BK, Sharma GS, Sharma V, Singh AK. Sweeteners analysis and stability a review. Indian J Dairy Sci 2006; 59:351-358.
- Chetana R, Manohar B, Reddy S, Reddy Y. Process optimization of Gulab jamun, an Indian traditional sweet, using sugar substitutes. Eur Food Res Technol 2004; 219:386-392.
- Mayer S. Investigating taste interactions. Fruit process 2002; 12:224-227.
- Melo LLMM, Bolini HMA, Efraim P. Sensory profile, acceptability, and their relationship for diabetic/reduced calorie chocolates. Food Qual Prefer 2009; 20:138-143.
- Wang J, Xiao H. Discrimination of different white chrysanthemum by electronic tongue. J Food Sci Technol 2013; 50:986-992.
- Legin A, Rudnitskaya A, Vlasov Y, Di Natale C, Davide F, D'Amico A. Tasting of beverages using an electronic tongue. Sensor Actuat B-Chem 1997; 44:291-296.
- Ciosek P, Brzozka Z, Wroblewski W. Electronic tongue for flow-through analysis of beverages. Sensor Actuat B-Chem 2006; 118:454-460.
- Ciosek P, Brzozka Z, Wroblewski W. Classification of beverages using a reduced sensor array. Sensor Actuat B-Chem 2004; 103:76-83.
- Gallardo J, Alegret S, Valle M. Application of a potentiometric electronic tongue as a classification tool in food analysis. Talanta 2005; 66:1303-1309.
- IS: Indian Standards Institute, No.5126 (1969) Glossary of general terms for sensory evaluation of foods, Part I, Methodology. Indian Standards Institute, New Delhi.
- Patil S, Ravi R, Saraswathi G, Prakash M. Development of low calorie snack food based on intense sweeteners. J Food Sci Technol 2014; 51:4096-4101.
- ASTM Sensory Testing Methods In: Chamber E IV, Wolf MB (eds) American society for testing materials, manual 26, 2nd edn. ASTM, West Conshohocken, 1996; p 54-72.
- Stone H, Sidel TC. Quantitative descriptive analysis: developments, applications and the future. Food technol 1998; 52, 48-52.
- Smith, WF. Experimental design for formulation. Society for industrial and applied mathematics. Philadelphia: SIAM 2005.
- Varnalis AI, Brennan JG, Macdougall DB, Gilmour SG. Optimization of high temperature puffing of potato cubes using response surface methodology. J Food Eng. 2004; 61(2):153-163.
- Souza VR, Pereira PA, Pinheiro ACM, Bolini H, Borges SV, Queiroz F. Analysis of various sweeteners in low-sugar mixed fruit jam: equivalent sweetness, time-intensity analysis and acceptance test. Food Sci Technol 2013; 48:1541-1548.
- Cliff M, Heymann H. Development and use of time-intensity methodology for sensory evaluation: a review. Food Res Int 1993; 26:375-385.
- Chetana R, Krishnamurthy S, Reddy S, Reddy Y Rheological behavior of syrups containing sugar substitutes. Eur Food Res Technol 2004; 218:345-348.
- Jack ZY, Melissa KP. Taste making analysis in pharmaceutical formulation development using an electronic tongue. Int. J Pharm 2006; 310:118-124.
- Rao VHP, Singh RRB, Jha A, Patel AA. Effect of sugar syrup concentration on certain physical properties of Gulab jamun prepared from a ready mix. Indian J Dairy Sci 2002; 55:270-275.
- Acosta O, Viquez F, Cubero E Optimization of low calorie mixed fruit jelly by response surface methodology. Food Qual Prefer 2008; 19:79-85.
- Cadena RS, Cruz AG, Netto RR, Castro WF, Faria JDAF, Bolini HMA. Sensory profile and physicochemical characteristics of mango nectar sweetened with high intensity sweeteners throughout storage time. Food Res Int 2013; 54:1670-1679.
|


 This work is licensed under a Creative Commons Attribution-NonCommercial 4.0 International License