IJCRR - 9(21), November, 2017
Pages: 24-36
Print Article
Download XML Download PDF
Verification of VARSHA Rainfall Forecasts for Summer Monsoon Seasons of 2009 and 2010
Author: S. Karuna Sagar, G. Mrudula, K. Vijaya Kumari, S. Vijaya Bhaskara Rao
Category: General Sciences
Abstract:Objective: The monsoon year 2009 is a severe drought with 21.8% deficit rainfall from the long period average according to India Meteorological Department (IMD) over India since the past decade and 2010 is a normal monsoon year. Therefore, the verification skill of the VARSHA model has been computed for one normal monsoon and one drought year.
Method: The statistical parameters like mean error, root mean square error and correlation coefficient has been computed at every model grid point and verified against the rainfall observations from India Meteorological Department and Tropical Rainfall Measuring Mission (TRMM). The analysis is also extended to dichotomous forecasts, i.e. yes/no forecasts, by using contingency tables. The four regions namely, South peninsula, Central India, North-East and North-West regions of Indian land mass have been considered for the verification analysis.
Result: India receives a major portion of its annual rainfall during the summer monsoon season (June to September) and thus accurate prediction of summer monsoon rainfall is very crucial. Rainfall is a discrete parameter which shows large variations spatially as well as temporally. VARSHA, a hydrostatic global circulation model, developed at Flosolver unit, National Aerospace Laboratories (NAL), Bangalore, is used to predict summer monsoon rainfall from the year 2005 onwards. Forecast verification serves to assess the state of the art of forecasting. Therefore, verification of the model forecast is an important task for any numerical weather prediction centre. In this study, an attempt has been made to examine the skill of VARSHA model in predicting the rainfall during summer monsoon period of 2009 and 2010.
Conclusion: The results show that model forecasts are useful at medium range and the performance of VARSHA is better in 2010 compared to 2009. The statistical skill scores show high predictability for light rain events with a decreasing tendency with an increase in intensity.
Keywords: Rainfall, VARSHA GCM, Verification skill, Contingency table
Full Text:
INTRODUCTION
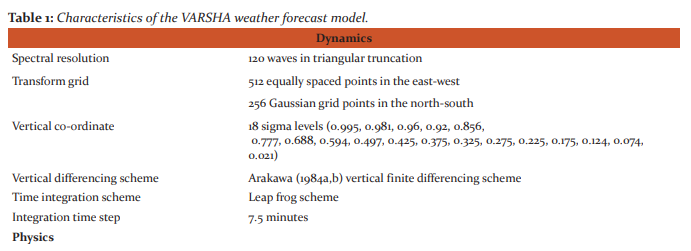
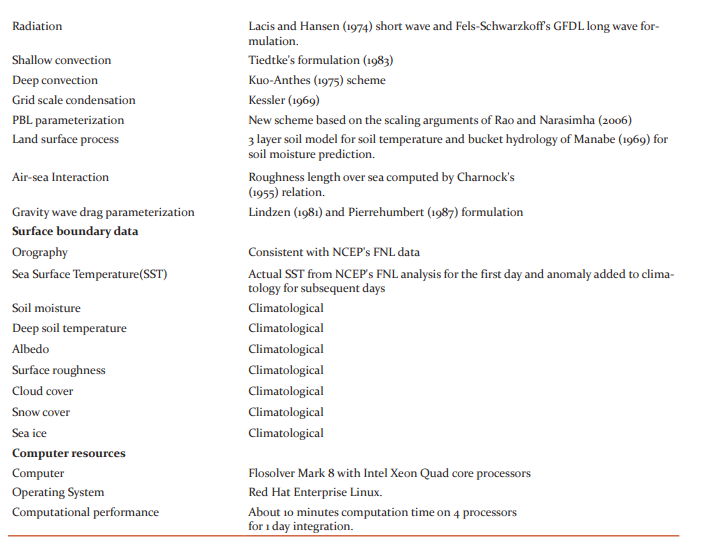
Climate of Asia is dominant by the south west monsoon rainfall, especially over India. The Indian summer monsoon season is one of the most spectacular manifestations of atmospheric circulations including regional and global characteristics as well as its associated connections (Mandal et.al., 2006). During the South-West Monsoon (also known as Summer Monsoon) which starts from June to September, India receives a major portion of its annual rainfall. The seasonal rainfall as a whole over India is about 89cm with 10% coefficient of variation (Rajeevan et.al., 2005). However, the IJCRR Section: General Science Sci. Journal Impact Factor 4.016 ICV: 71.54 Research Article contribution of rainfall due to pre-monsoon (March, April and May) and post-monsoon (October, November and December) to the annual rainfall is about 11% (Guhathakurta and Rajeevan, 2008). Therefore, taking the information on the progress, forecasting of monsoon which is necessary to the farmers and other users well in advance is highly important. Realistic prediction of Indian summer monsoon rainfall on different space and time scales is a challenging task. Various studies on summer monsoon characteristics, modeling aspects, teleconnections with various global parameters, indices, interannual variability, intra-seasonal variability have been carried out and documented (Sikka and Gadgil, 1980; Shukla and Mooley, 1987; Annamalai, 2001; Goswami et al., 2001; Gadgil, 2003; Gadgil and Gadgil, 2006; Goswamy, 2005; Mitra et.al., 2005; Webster et al., 1998, 2006; Basu, 2001, 2005; Gadgil et al., 2007, Rajeevan et al., 2006, 2008; Kelkar, 2009; Rajeevan, 2010; Janakiraman, 2011). Various atmospheric models with different resolutions, i.e., climate, global and regional models have been developed to predict rainfall accurately. All the studies have suggested that the model skills are good (Buizza, et.al., 1999; Cherubini, 2002) in predicting the low intensity rainfall than the high intensity rainfall. However, in general, mostly the models overestimated the actually observed rainfall intensities. A small fluctuation in seasonal rainfall will show a large effect on the economy in agricultural countries like India (Rajeevan et.al. 2004). Therefore prediction of rainfall event with intensity is very crucial. Verification of model forecasts is very important, because, it tells how to make the best use of the forecasts at any weather prediction centre. Meteorologists have developed and devoted to forecasting verification regarding both verification methods and application of these methods in operational and experimental centres (Murphy and Daan, 1985). A general frame work for forecast verification was developed by Murphy and Winkler (1987). VARSHA, a hydrostatic spectral Global Circulation Model (GCM) (Nanjundaiah and Sinha, 1999), developed at Flosolver unit, National Aerospace Laboratories (NAL), Bangalore, is used for the daily forecast of the Indian monsoon. The model is integrated up to 31 days ahead to forecast the atmosphere from the initial condition prepared using Final Analysis (FNL) from National Center for Environmental Prediction (NCEP). Later the model has integrated up to 36days (to implement ensembles with 5 days). VARSHA model has roots in National Center for Medium Range Weather Forecasting (NCMRWF) T-80 code, later it was parallelized and re-engineered using new boundary layer (Rao and Narasimha, 2005) and radiation (Varghese et al, 2003) schemes by National Aerospace Laboratories in 1993 (Sinha et al, 1994). The code has a special boundary layer parameterization scheme for the tropics and a refined scheme for the moist adiabat. The spectral truncation of the model version used is at 120 waves in triangular truncation with 512 grid points in east-west and 256 grid points in north-south. The vertical resolution of the model is up to 18 levels in sigma coordinates and persisted Sea Surface Temperature (SST) is used. Persisted method assumes that tomorrow’s weather will be the same as today’s weather i.e. the conditions at the time of forecast will not change. The detailed model characteristics are explained in Table.1 (Basu et.al. 2010). As a part of NAL-CSIR collaborations with various universities, Department of Physics, Sri Venkateswara University, Tirupati was selected as one of the major universities to study the characteristics of Monsoon through NMITLI (New Millennium Indian Technology Leadership Initiatives) Modeling based joint CSIR-NAL project on North East Monsoon prediction using VARSHA GCM. The scope of the verification is (a) to monitor forecast quality over time (b) to compare the quality of different forecast systems i.e., to what extent does one forecast system gives better forecast than the other, and (c) to improve the quality of the forecasts through better understanding of the forecast errors. Verification of VARSHA forecasts for the south west monsoon seasons of 2009 and 2010 was carried out in the present study. The years 2009 and 2010 were selected as 2009 is a severe drought with 21.8% deficit rainfall from the long period average according to India Meteorological Department over India since the past decade and 2010 is a normal monsoon year.
DATA
The verification analysis of VARSHA rainfall forecasts is done for 122 days i.e., summer monsoon season (1st June to 30th September) for the years 2009 and 2010. The qualitative and quantitative verification has been done from 1-day forecast to 15-day forecast lengths. However, in the present study, the verification at different forecast lengths, i.e., 1-day, 3-day, 5-day, 7-day, 10-day and 15-day against the observations are only presented. For spatial verification Tropical Rainfall Measuring Mission 3B42RT data with 0.25º × 0.25º degree (lat × lon) (Huffman et al 2007) are used. As the resolution of VARSHA forecasts is 0.7º × 0.7º, Tropical Rainfall Measuring Mission data has been interpolated to the resolution of 0.7 degree using bilinear interpolation method. For temporal verification analysis in addition to the Tropical Rainfall Measuring Mission data, high resolution real time gridded rainfall data at 0.5 degree resolution from Indian Meteorological Department (Rajeevan et al, 2009) are also used.
METHODOLOGY
Various methods have been developed (Murphy, et.al., 1988; Casati, 2008; Nurmy, 2003; Rajeevan, et.al., 2005; Stanski, et.al., 1989) to compare the distribution of forecasts against the observations. In this paper some important verification methods are used to assess the performance of VARSHA GCM for the summer monsoon seasons of 2009 and 2010. Towards the quantitative verification of the model, the Mean Error (ME), Root Mean Square Error (RMSE) and the Pearson’s Correlation Coefficient (CC) between observations and forecasts at each grid point, averaged over central India and Indian land mass as a whole is computed. The verification scores computed are as follows:
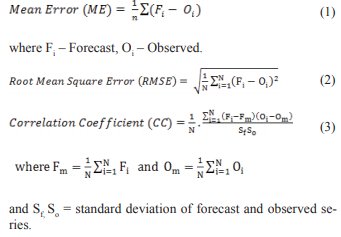
The verification analysis is also carried for dichotomous forecasts, i.e., yes/ no forecasts. A dichotomous forecast says, "yes, an event will happen”, or “no, the event will not happen". The combination of forecasts (yes/no) and observations (yes/no) are Hit - event forecast occurred and did occur Miss - event forecast not to occur but did occur False alarm - event forecast occurred but did not occur Correct negative - event forecast not to occur and did not occur The analysis has been carried out for various thresholds of rainfall intensity. An event "ye" is defined as if the rainfall greater than or equal to the threshold value, else it is a non event i.e “no”. This kind of verification is done by using the contingency table (Table.2). A perfect forecast system will produce only Hits and Correct Negatives, and no Miss or False Alarm. Murphy (1993) had suggested nine skill scores for forecast verification. Some of the skill scores have been computed in this report and are listed below.
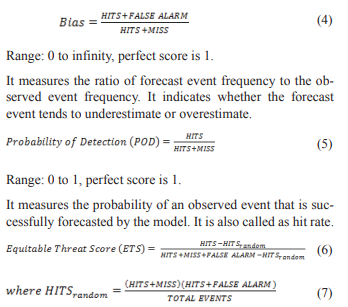
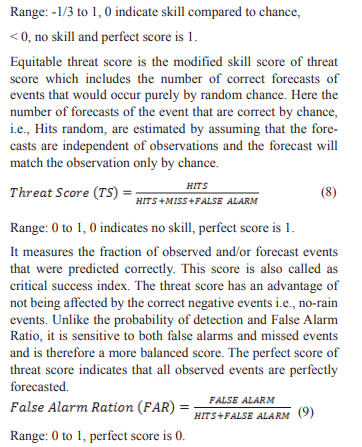
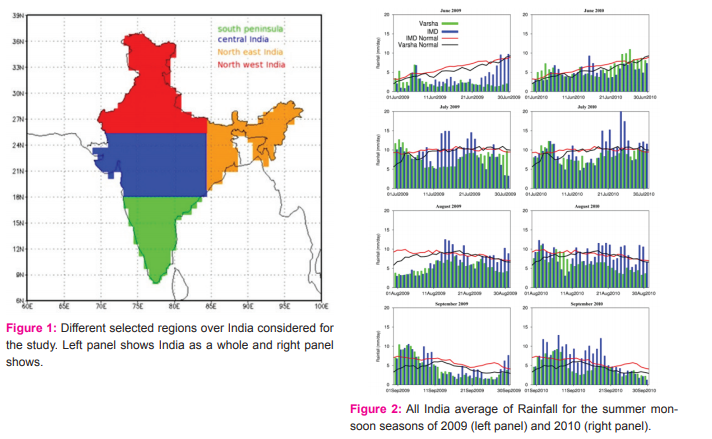
It gives the measure of forecast events that were observed to non events. It is sensitive to false predictions but ignores misses. This score can always be increased by under forecasting the number of sever events, but only at the cost of more missed events which are not seen by the score. The rainfall variation over the entire country is not homogeneous. Therefore the country was classified into four geographical sub regions by India Meteorological Department i.e., North-West India, North-East India, Central India and South Peninsular India as shown in Fig.1. The verification is carried out for rainfall at every grid point over India, rainfall averaged over the Indian land mass, over South Peninsula (area marked by green colour), Central India (area marked by blue colour), North-East India (area marked by orange colour) and North-West India (area marked by red color).
RESULTS
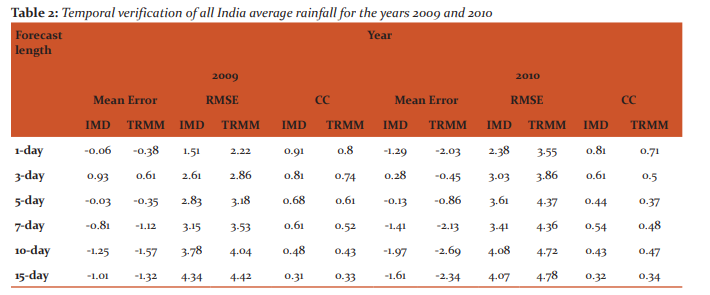
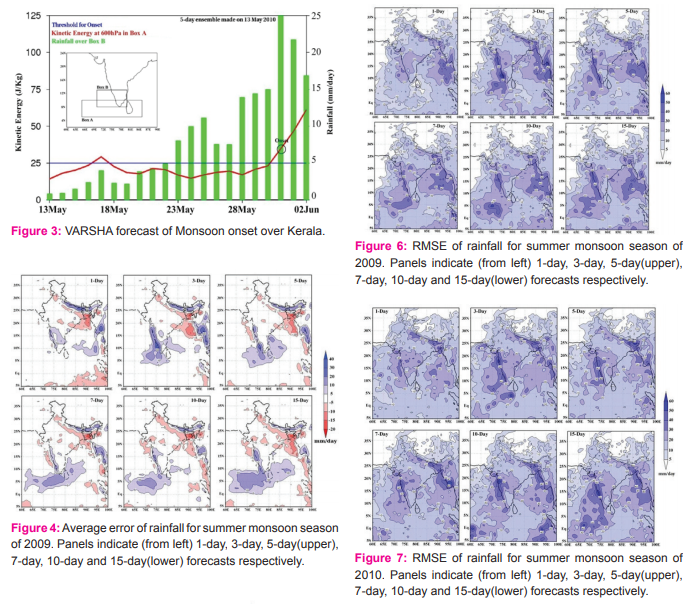
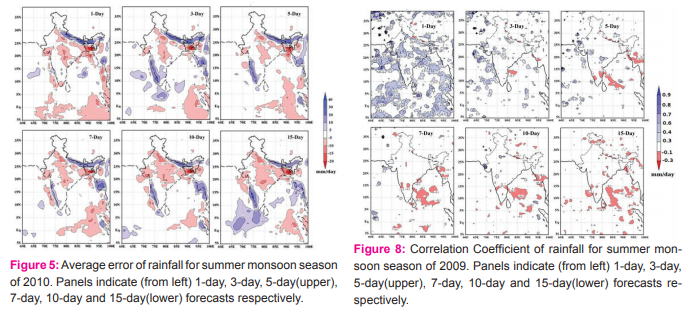
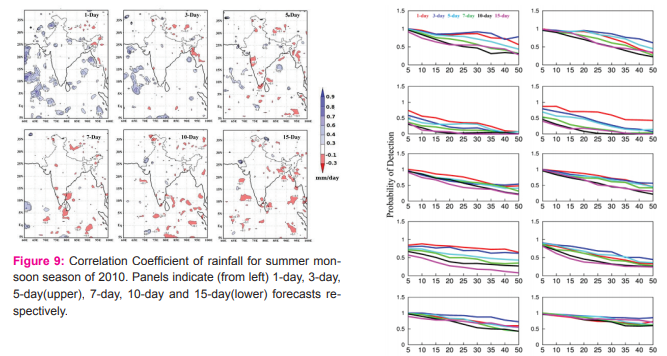
Spatial verification of VARSHA rainfall forecasts of various forecast lengths, i.e., 1-day, 3-day, 5-day, 7-day, 10-day and 15-day has been done against the observations from Tropical Rainfall Measuring Mission for the years of 2009 and 2010. During the year 2009, most of the subdivisions are in deficient condition. The All India Average Rainfall (AIAR) for the summer monsoon season is 23% lesser than from its normal which is comparable to the most severe drought (24% in 1972) in the last 100 years and for June it was 48% which is recorded as the lowest rainfall since 1871 (Francis and Gadgil, 2009). Even though monsoon arrived early over India in 2009 on 23rd May, the country experienced severe drought. Immediately after the declaration of onset over Kerala, a severe cyclonic storm had formed over Bay of Bengal which helped to get an advance of monsoon over Indian states; later the monsoon never gained its normal position. Droughts in India are mainly associated with El-Nino events. The El-Nino phase of the southern oscillation has a direct impact on India which leads to weak or enhanced summer monsoon. The comparison of VARSHA forecast of all India average rainfall with India Meteorological Department observation for the summer monsoon seasons of 2009 (left panel) and 2010 (right panel) is shown in Fig.2. The first panel indicates for June, second, third and fourth panels indicate July, August and September months respectively. From the Figure, the observed All India Average Rainfall (blue bars) during the summer monsoon months is below normal (red line) for 2009. The VARSHA forecast of All India Average Rainfall is well projected the deficiency of rainfall in all monsoon months. However, in the normal monsoon year of 2010, the observed All India Average Rainfall during June July August September is just above the normal where as VARSHA forecast for 2010 depicts the All India Average Rainfall is just below normal. Therefore, the severe drought in 2009 was reasonably well predicted by VARSHA model, in particular, VARSHA model does not over predict the rainfall (Sinha, 2010). The normal monsoon year is also predicted with less magnitude. During the monsoon season of 2009, the onset over Kerala is on 23rd May which is 8 days earlier to the normal onset date i.e. 1st June. However, in 2010, the onset over Kerala is on 31st May. The forecast of monsoon onset over Kerala is also attempted well in advance every year using VARSHA GCM with a specified criterion as mentioned below. A Continuous increase of Kinetic Energy with a minimum of 25 J/Kg at 600hPa in the box A (Fig.3). Mean zonal wind at 600hPa in a box A should be positive An average rainfall of more than 5 mm for 3 consecutive days in box B(Fig.3) Then the 1st day is declared as monsoon onset date with a model error of ±3 days. With the above criterion, the VARSHA GCM had predicted the monsoon onset over Kerala accurately for the both years 2009 (Karuna Sagar and Mrudula, 2010) and 2010 (Fig.3). Fig.4 shows the spatial distribution of mean error for the summer monsoon season of 2009 with different length of day forecasts. The upper panel represents 1-day, 3-day and 5-day forecast lengths and lower panel indicates 7-day, 10- day and 15-day forecast lengths. The error has been calculated by subtracting the observed rainfall from the forecast quantity. The figure depicts that there are large differences between observed and model forecasts of rainfall. The positive errors can be seen over south-west peninsula region and are increasing with forecast lengths in particular over the Arabian Sea and southern Bay of Bengal region. Another patch of positive error is noticed over foothills of Himalayas. Fig.5 depicts the mean error for the summer monsoon season of the normal year 2010. Form the figure, it can be seen that the model overestimates rainfall over the southern peninsula and foot hills of Himalayas and also the magnitude of the error is increasing with forecast length over these regions. However, a strong positive error can be noticed over most of the Indian landmass except southern peninsula. Since model forecasts are good over Indian land mass during 2009, it depicts that VARSHA GCM well predicted the drought rainfall whereas, in good monsoon period (2010), the model shows excess in both positive and negative side. However, the above described mean error showing the seasonal mean error may not be fully informative, because the errors of opposite signs may get cancelled or added due to the summing up for the entire season. Hence, root mean square error values for the above mentioned regions have been calculated.
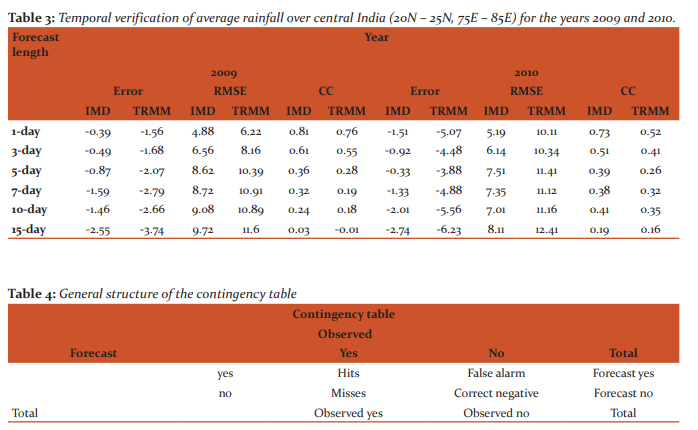
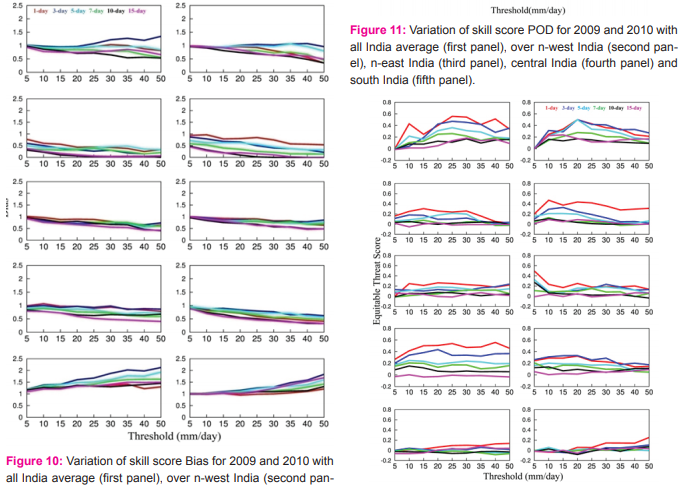
Spatial root mean square errors estimated and are shown in Fig.6 (2009) and Fig.7 (2010). These figures depict that magnitude of root mean square error is more along the south west coast, over Bay of Bengal and the Himalayan region which may be attributed to the topography/orography effect or due to the model physics. Root mean square error over these specified regions is more for 3-day forecast than that of 1-day forecast and 5-day forecast. Beyond this forecast length the root mean square error values are seen increasing. Higher values of root mean square error are found over Ocean region than land region and its magnitude is oscillating around a threshold with forecast length. Over central India, the magnitude of Root mean square error values are quite less and over southern land mass it is more. A similar kind of pattern in Root mean square error is seen in 2010 with an extendable area over Central India. The magnitude of Root mean square error is increasing with forecast day length for both 2009 and 2010 over Indian Ocean. Efforts are needed to improve the physics in the model which plays a major role in rainfall prediction. Analysis of Pearson’s correlation coefficient (Fig.8) shows that model predictions were well correlated with the observations up to 5 days in 2009 and further the correlation coefficient is weakening and become negative. For the year 2010 (Fig.9), the model predictions are in phase with the observations up to 3-day forecasts and partially with 5-day forecasts. From the 5-day forecast length, the predictions are out of phase for most of the regions. However, in both the years, higher values of correlation coefficient can be seen over ocean than in Indian land mass. The spatial variation of correlation coefficient from region to region is large in 2009 for 1-day forecast, whereas in 2010, the spatial variation of correlation coefficient is less. The above three statistics reveals that the model forecasts have better skill in predicting the monsoon rainfall in 2009 than in 2010. Temporal verification of all India average rainfall is also carried out for the years 2009 and 2010. The skill scores like mean error, root mean square error and correlation coefficient has been computed for the entire Indian land mass as a whole (Table.2) and over a box spanning from 20ºN – 25ºN and 75ºE – 85ºE (Table.3). The observations from both India Meteorological Department and Tropical Rainfall Measuring Mission are used for this analysis. From Table.2, the mean error over Indian land mass is negative for all the forecast lengths which indicate that the model forecasts of rainfall intensity are comparatively less than the observations from both India Meteorological Department and Tropical Rainfall Measuring Mission. However, the observed rainfall from Tropical Rainfall Measuring Mission is more than the gauge rainfall (India Meteorological Department). Therefore, the magnitude of root mean square error is smaller when forecasts are compared with India Meteorological Department than with Tropical Rainfall Measuring Mission. This is due to the unpredictable behaviour of the model over Ocean region. Whereas, the Root mean square error is seen increasing with forecast length for both 2009 and 2010. Highest value of correlation coefficient (0.91 and 0.81 with India Meteorological Department, 0.8 and 0.71 with Tropical Rainfall Measuring Mission) are found in 1-day forecasts. Therefore 1-day forecasts are in phase with the observations and have a decreasing tendency with the length of forecast. But the forecasts are significant up to 10-day forecasts for All India Rainfall over the above regions. Similar kind of phase is reflected when verification is carried out over central India. The VARSHA forecasts are very close in magnitude and in phase with India Meteorological Department observations than Tropical Rainfall Measuring Mission for different forecasts lengths. For the verification of dichotomous forecasts, a contingency table is prepared to compare with Tropical Rainfall Measuring Mission observations. Various skill scores have been computed with various thresholds for different lengths of forecasts. The analysis is carried out at every grid point and over four selected regions by considering the threshold value from 5mm to 50mm/day. Fig.10 shows the Bias scores for the years 2009 (left panel) and 2010 (right panel) which includes rainfall averaged over Indian land mass (upper first panel) and second, third and fourth panel indicates other four selected geographical regions i.e., n-west India, n-east India, central India and south India respectively. Bias score for all India average rainfall is high at lower threshold of rainfall and varying between 0.5-1.0 for higher threshold with different day forecasts. The Bias skill score has a decreasing tendency as length of day forecast increases, but has a slight variation in magnitude with the increase in the rainfall threshold value. From the figure, it can be seen that the magnitude of bias is small over the selected geographical regions than India as whole, except over southern India. The model forecasts are much closer to the observations when the number of grid points taken for the average is increasing. The model tendency to overestimate an event is less for light rain cases and increasing with forecast length. But the magnitude of Bias over south peninsula is more than 1 and increasing with the threshold, which suggests that the model forecasts are overestimated over the south Indian region.
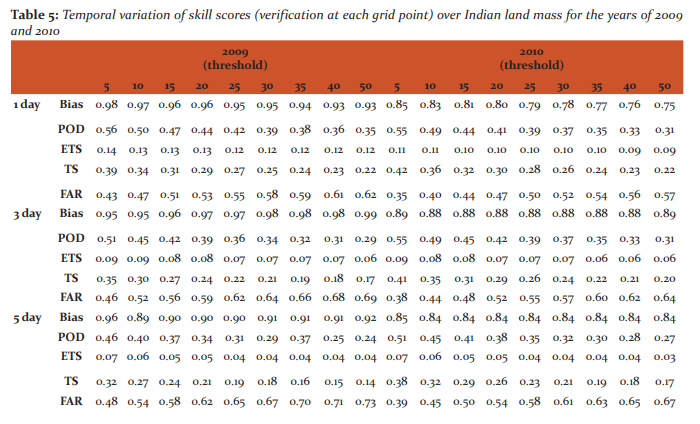
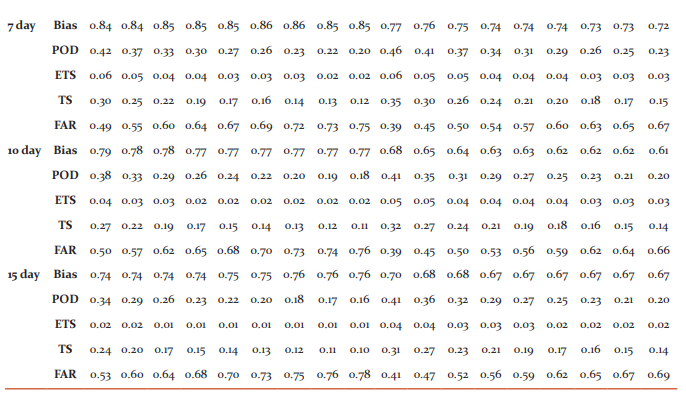
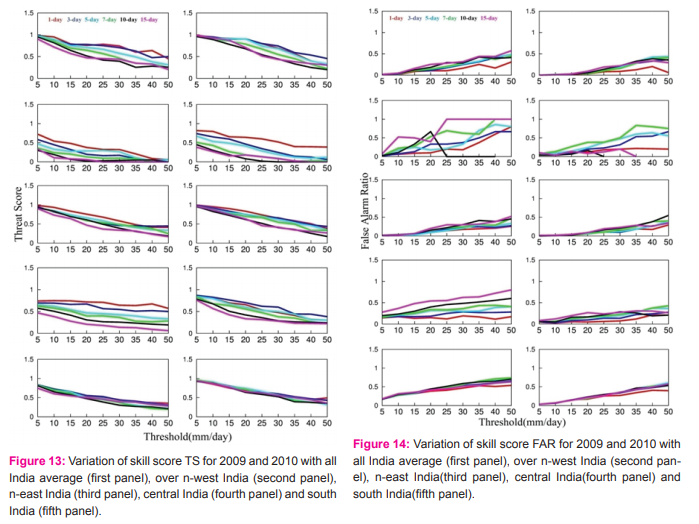
Fig.11 shows the verification of skill score probability of detection for the above two years over India as a whole and the four geographical regions. Probability of detection is noticed to be consistently very high for all forecast lengths with threshold value 5mm to 20mm. But over the North West Indian region, the magnitude of probability of detection is less when compared to the other regions especially in 2009. The magnitude of probability of detection decreases with increase in the threshold amount of rainfall in all the regions in both the years. High value of probability of detection indicates that model can forecast majority of the observed yes/ no rainfall events. Thus, it can be concluded that light rain events are correctly predicted by the model for all forecast day lengths. The minimum probability of detection can be seen in North West Indian region at the higher threshold rainfall value. Over the remaining specified domains, the minimum value of probability of detection is more than 0.2 which tells that model skills are considerable for higher rainfall threshold also. probability of detection has an increasing trend from individual grid points to all India verification. The behaviour of the equitable threat score for 2009 and 2010 is presented in Fig.12. Highest magnitude of equitable threat score is obtained when all India average is considered and it is seen to be less and varying between 0 and 1.5 when individual grid points are considered. From the verification, it can be seen that the spread between the equitable threat score values of different day forecasts is increasing from grid point to all India average. The spread is more while considering the thresholds between 20mm and 40mm with both inclusive. The lowest value of equitable threat score indicates that the percentage of model forecasts for ‘no’ events is high. The performance of threat score skill is shown in Fig.13. The threat score value with rainfall average over Indian landmass is above 0.9 for 2009 and 0.95 for 2010. The value of threat score is reducing with the increase in the number of grid points considered for averaging. From the figure, the magnitude of threat score is noted to decrease with the increase of rainfall threshold and the length of forecast. Highest threat score value at low rainfall threshold indicates that the less rainfall events were correctly diagnosed. The False Alarm Ratio, which ignores misses and sensitive to the false alarm, has been calculated for the summer monsoon season of 2009 and 2010 and summarized in Fig.14. It depicts that the value of False Alarm Ratio is increasing with the increase of rainfall threshold and forecast length, where as False Alarm Ratio is decreasing with the increase of number of grid points considered for averaging. The temporal variation of different skill scores at each grid point over the Indian land mass by using different thresholds of rainfall for the years of 2009 and 2010 is shown in Table.5. The magnitude of all skill scores for the year 2009 is more than 2010, which depicts that at every grid point the model forecasts are captured the true events in 2009 than in 2010.
DISCUSSION
Francis and Gadgil (2009) reported that a drought was not predicted by the leading centres in the world using the complex models of the coupled atmosphere system. However, the models had predicted above average rainfall for June, July and August. The forecasts of VARSHA suggest that the all India average rainfall for June is below the long-term mean (Sinha, 2010). It also predicted a 51% of deficiency for June. VARSHA predicted well the drought rainfall whereas, in 2010, the model shows excess. The increase in the magnitude of the root mean square error over Indian Ocean is noticed in both 2009 and 2010. The analysis suggests that the forecasts are much closure with India Meteorological Department than Tropical Rainfall Measuring Mission. The spread between the equitable threat score value is increasing from grid point to all India average. The false alarm is also more in the forecast and increasing with forecast length. CONCLUSIONS Statistical verification of the performance of VARSHA rainfall forecasts with observations using different forecast lengths has been carried out for summer monsoon seasons of 2009 and 2010. The VARSHA rainfall forecasts are nearer to the observations and the skill is better for rainfall averaged over the entire Indian landmass than at each individual grid point. The prediction skill is more in 2009 i.e., for the severe drought year than normal monsoon year i.e., in 2010. The skill is seen decreasing with the increase of the rainfall threshold value and forecast length. The model forecasts are over estimated over the south peninsula region and foot hills of Himalayas. However, the under estimation of rainfall is noticed over the most of the Indian land region and northern Bay of Bengal. The magnitude of the error is increasing with the forecast lengths as it was well known. The model forecasts are in phase with the observations up to 5 to 7-day forecast lengths. The VARSHA forecasts of rainfall are much closer to the India Meteorological Department observations than Tropical Rainfall Measuring Mission over oceanic regions. Similarly, a good prediction skill of VARSHA is noticed for the low frequency rainfall. This study shows that VARSHA forecasts can be useful in medium range forecasting especially over the country as a whole. Its forecast skills are very useful to the farmers and the Government to make the seasonal analysis.
ACKNOWLEDGEMENTS
We acknowledged the director, NAL-CSIR for his support to carry out this work. We extend our sincere gratitude to Dr. M. Rajeevan, Secretary, MoES, New-Delhi, for his valuable suggestions and guidance. We extend our sincere thanks to Dr. U. N. Sinha, Distinguished Scientist for his encouragement and support. We are also thankful to Dr. T. N. Venkatesh, Mr. Arshad Shameem for their support. The data used in this study were acquired using the GES-DISC Interactive Online Visualization and analysis Infrastructure (Giovanni) as part of the NASA’s Goddard Earth Sciences (GES) Data and Information Services Center (DISC). We also extend our gratitude to UGC-SVU center for MST Radar Applications and Advanced center for Atmospheric Science for providing the funds to carry out the research work. Authors acknowledge the immense help received from the scholars whose articles are cited and included in references of this manuscript. The authors are also grateful to authors / editors / publishers of all those articles, journals and books from where the literature for this article has been reviewed and discussed.
References:
1. Buizza R, Hollingsworth A, Lalaurette F, Ghelli A. Probabilistic Predictions of Precipitation Using the ECMWF Ensemble Prediction System. Wea. Forecasting 1999; 14: 168-189.
2. Casati B, Wilson LJ, Stephenson DB, Nurmi P, Ghelli A, Pocernich M, et al. Forecast verification: current status and future directions. Met. Apps 2008; 15: 3-18. doi:10.1002/met.52rubuni.
3. Cherubini T, Anna Ghelli, Francois Lalaurette. Verification of precipitation forecasts over the Alpine region using a high-density observing network, Wea. Forecasting 2002; 17: 238-249.
4. Francis PA, Sulochana Gadgil. The Aberrant behaviour of the Indian monsoon in June 2009, Curr. Scie. 2009; 97:1291-1295.
5. Gadgil Sulochana. The Indian monsoon and its variability. Annu. Rev. Earth Planet. Sci. 2003; 31:429-467.
6. Gadgil Sulochana, Siddhartha Gadgil. The Indian monsoon, GDP and agriculture. Economic and Political Weekly 2006; XLI, 4887-4895.
7. Gadgil Sulochana, Rajeevan M, Francis PA. Monsoon variability: Links to major oscillations over the equatorial Pacific and Indian oceans. Curr. Sci. 2007; 93(2): 182-194.
8. Goswami BN. Intraseasonal variability (ISV) of South Asian Summer Monsoon; In: Intraseasonal Variability of the Atmosphere - Ocean Climate system (eds) Lau K and Waliser D, Springer-Praxis 2005; Chichester, UK.
9. Guhathakurta P, Rajeevan M. Trends in the rainfall pattern over India, Int. J. Climatol. 2008; 28: 1453 - 1469.
10. Janakiraman S, Mohit Ved, Ramesh Naidu L, Priyanka Yadav, Sulochana Gadgil. Prediction of the Indian summer monsoon rainfall using a state-of-the-art coupled ocean-atmospheric model, Curr. Sci. 2011; 100(3): 354-362.
11. Karuna Sagar S, Mrudula G. Kinetic Energy - A Predictor for Indian Summer monsoon onset, Proceedings 2010; METOC-2010, pp:198-204.
12. Karuna Sagar S, Rajeevan M, Vijaya Bhaskara Rao S. On increasing monsoon rainstorms over India. Nat. Hazards 2017; 85(3): 1743-1757.
13. Kelkar KK. Monsoon Prediction, BS Publications 2009; ISBN-978-81-7800-185-2, p:1-231.
14. Mandal V, De UK, Basu BK. Precipitation forecast verification of the Indian summer monsoon with intercomparison of three diverse regions, Wea. Forecasting 2006; 22:428-443.
15. Mitra AK, Stefanova L, Vijaya Kumar TSV, Krishnamurti TN. Seasonal prediction for the Indian monsoon region with FSU ocean-atmosphere coupled model: Model mean and 2002 anomalous drought, Pure and Applied geophysics 2005; 1431-1454.
16. Murphy AH, Daan H. Forecast Evaluation: Probability, statistics and decision making in the atmospheric Sciences, A.H. Murphy and R.W. Katz, Eds., Westview Press 1985; 379-437.
17. Murphy AH. Skill scores based on the mean square error and their relationships to the correlation coefficient. Mon. Wea. Rev. 1988; 116, 2417-2424.
18. Murphy AH, Robert L Winkler. A general frame work for forecast verification, Mon. Wea. Rev. 1987; Vol:115, 1330-1338.
19. Murphy AH. What Is a Good Forecast? An Essay on the Nature of Goodness in Weather Forecasting. Wea. Forecasting 1993; 8: 281-293,
20. Nanjundaiah SR, Sinha UN. Impact of modern software engineering practices on the capabilities of an atmospheric general circulation model, Curr. Sci. 1999: Vol:76, 1114-1116.
21. Nurmy P. Recommendations on the verification of local weather forecasts, ECMWF Tech. Memo. 2003; 430, 18 pp.
22. Rajeevan M, Pai DS, Dikshit SK, Kelkar RR. IMD's new operational models for long range forecast of southwest monsoon rainfall over India and their verification for 2003, Curr. Sci. 2004; Vol:86, No.3, 422-431.
23. Rajeevan M, Pai DS, Anil Kumar R. New statistical models for long range forecasting of south west monsoon rainfall over India, NCC research report 2005.
24. Rajeevan M, Jyoti Bhate, Kale JD. High resolution daily gridded rainfall data for the Indian region: Analysis of break and active monsoon spells. Curr. Sci. 2006; 91: 296-306.
25. Rajeevan M, Jyothi Bhate, Jaswal AK. Analysis of variability and trends of extreme rainfall events over India using 104 years of gridded daily rainfall data. Geophys. Res. Lett. 2008; 35, L18707, DOI:10.1029/2008GL035143.
26. Rajeevan M, Amit Kesarkar, Jyoti Bhate, Unnikrishnan CK, Madhu Latha, Sreeram Mahesh. Development of a Real Time Short-range Weather Forecasting System and its verification during the 2009 Southwest Monsoon Season, local report, 2009; WCRG, Gadanki.
27. Rajeevan M, Sulochana Gadgil, Jyothi Bhate. Active and Break spells of the Indian summer monsoon. J. Earth syst. Sci. 2010; 119(3): 229-247.
28. Rao GK, Narasimha R. Heat-flux scaling for weakly forced turbulent convection in the atmosphere, Jor. Fluid Mech. 2005; 547:115-135.
29. Shukla J, Mooley DA. Empirical prediction of the monsoon rainfall over India, mon. wea. Rev. 1987; 115: 695-703.
30. Sinha UN, Sarasamma VR, Rajalakshmy S, Subramanian KR, Bharadwaj PVR, Chandrashekar CS, et al. Monsoon forecasting on parallel computers, Curr. Sci. 1994; 67: 178-184.
31. Sinha UN. On the predictive behaviour o f the Indian monsoon in June 2009, Curr. Sci. 2010; 98: 134-135.
32. Sikka DR, Gadgil S. On the maximum cloud zone and the ITCZ over Indian longitude during the Southwest monsoon. Mon. Wea. Rev. 1980;108: 1840-1853.
33. Stanski HR, Wilson LJ, Burrows WR. Survey of common verification methods in meteorology, World Weather Watch Tech. Rept, 1989; No.8, WMO/TD No.358, WMO, Geneva, 114 pp.
34. Varghese S, Vasudeva Murthy AS, Roddam Narasimha. A fast accurate method of computing near-surface longwave fluxes and cooling rates in the atmosphere, Jor. Atmos. Sci. 2003;60:2869-2886.
35. W.M.O., Recommendations for the verification and intercomparison of QPFs and PQPFs from Operational NWP Models, 2008; Revision 2, WWRP 2009-1, TD-No.1485, 34PP.
36. WWRP/WGNE joint working group on forecast verification Research group. Forecast verification - Issues, methods and FAQ, 2008; WCRP.

|


 This work is licensed under a Creative Commons Attribution-NonCommercial 4.0 International License