IJCRR - 4(17), September, 2012
Pages: 145-152
Date of Publication: 14-Sep-2012
Print Article
Download XML Download PDF
CONSTRUCTION OF THE MATHEMATICAL MODEL FOR EVALUATION AND FORECAST OF INTERURBAN
PASSENGERS TRAVEL
Author: Eng. Shkelqim GJEVORI
Category: General Sciences
Abstract:For a more harmonious development between economy and transport and for a close relation supply and
demand for travel, proper scientific studies should be conducted to determine operational instruments for
resolving the contradictions between this report and especially those technical instruments should rovide recommendations on permanent and long-term planning that preceded the decision and policy-makers. One of these instruments that are in use with much interest and after 50 years are mathematical models in transportation. They are based on the assumption that a linear equation could represent the relationship between a dependent variable \"Y \" that represents a pointer or economic phenomenon and one or more independent variables \" X , X ....X p 1 2 \" and that each of them taken separately can satisfy the assumption of linearity that is expressed in mathematical form as follows, y F a a X a X a X e n n ? ? ? ?. ? ?...... ? 0 1 1 2 2 (1.0) It is important that we have implemented practical use of information which is part of a database system for collection and data management of travel and road traffic in our country. In particular and very carefully, we have also defined specific requirements for input data analysis and have made their selection for the purpose of constructing the model.
Keywords: O/D matrix, demand modelling, supply, variables, balance.
Full Text:
INTRODUCTION
Theoretical treatment and research on our part has been extended by examining all transport?s components, taking into account the current information system that forms the basis of existing data, and providing other forms of data impossible to ensure up to now but that are indispensable. On the other hand refereed to the specific conditions of Albania's research and collection of appropriate data is not easy mainly because of the fragmented characteristics of existing statistical data and lack of time series. Basic variables which we are supported affect the quantity and quality of travels and we have grouped into three categories as follows, demographic, economic, territorial factors.
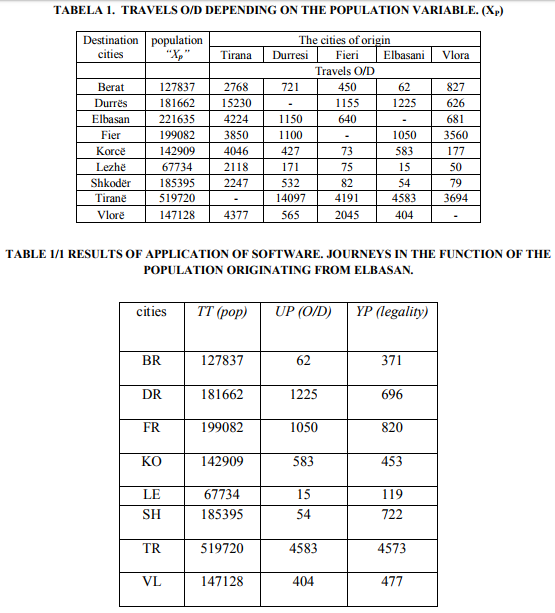
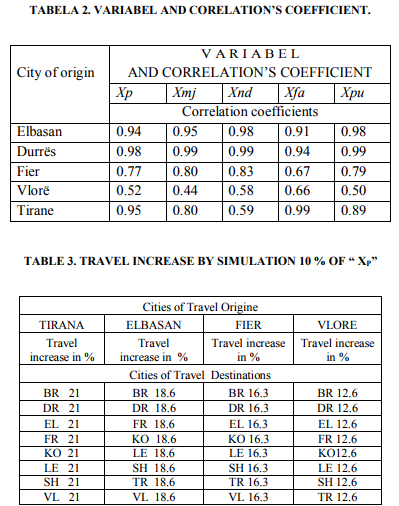
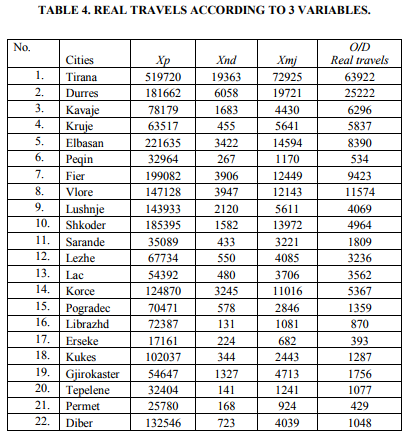
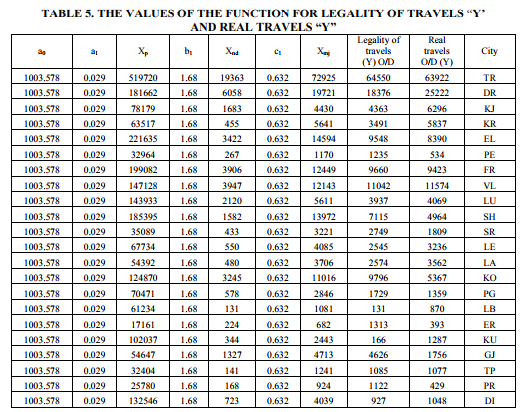
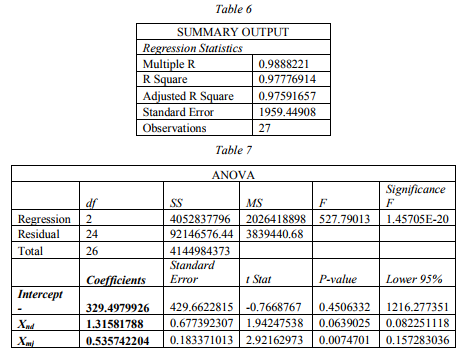
MATERIALS AND METHODS Based on three categories of the above variables from an analysis of their grouping, have deemed to representation and application of the travel modeling, the following variables as, resident population in cities, the number of passenger vehicles, and the active forces able to work, economically active enterprises, number of employees. With travel ensuring O/D (origin-destination) between the cities of the country and variables expressed above we have ensured the necessary database for the travel modeling through the application of selected mathematical model. To derive the travel legality in the function of variables "Xi" selected according to the recommendations and analysis made by us, we were focused on some of the country's main towns which make up about 96 % of the population and economic activities, of variables "Xi" taken into consideration. Starting from the given travel data O/D and for the 5 selected variables we have draw 5 tables. Starting from the given travel data O/D and for the 5 selected variables we have draw 5 tables, travels O/D depending on 1.the population variable (Xp), 2.number of economically active enterprises (Xnd), 3.vehicle of transportation for passengers (Xmj), 4.active work force (Xap) and 5.number of employees.(Xnp) as an example only one of them (table 1) for, a) selection of independent variables classifying by weight occupied by each of them, and to make a second selection of the 5 variables in the three we have applied the mathematical model of the shape force, 2 1 c Y ? c X (1.1) and for, b) modeling and forecast of interurban trips we shall apply the mathematical model of linear form, Y a a X a X a X e ? 0 ? 1 1 ? 2 2 ? ?... n n ? (1.2) Mathematical model of the selected form Y = c1X c2 is based on comparing of the process conduct and this of the model, especially when the dependence between the "Y" and "Xi" is not linear and more so when there is no identity of conduct. The objective of the method is to modify the model parameters in order to achieve a better fit by assuring a very fast convergence and adjacent to the redevelopment status and optimal. The result of the model describes a relationship between average variables of the two variables. The results given by the model are tabular and in graphical form, showing except of the parameters values (coefficients before variables "Xi"), and some important indicators that show the reliability of the model and extent of links between the two sizes "X and Y" such as, R, R 2 (or R 2 correlation coefficients, an indication that express the value of the model), adjusted R 2 (or Adjuster R) is useful in comparing this model with other models, F (value of the coefficient of reliability, Pvalue (probability value of reliability of coefficients before variables "Xi", etc. Based on the selected mathematical model we have applied software of this model (1.1) for nine main cities like Tirana, Durres, Vlora, Elbasan, Fieri, Korca, Berat, Shkodra, Lezha, representing cities centers of the county towns that constitute the major economic, social and cultural potentials, taking as the origin one city and destination eight other cities and so changing the positions of origin of travels to eight cities in an order we have received the following results which express the legality of dependency between variables "Xi" and function "Y". In here we are providing only one of the results of application of software. Journeys in the function of the population origination from Elbasan. (table 1/1) where; TT(pop)-is variable “Xp” that gives the number of population for cities Berat, Durres, Fier, Korca, Lezha, Shkodra, Tirana and Vlora (which are marked with the indices according to the vehicles number plates of the respective cities). UP(O/D)-are current journeys originating travel between the city of Elbasan and 8 other cities of destination (which in fact is the value of the function of “Y” mathematical model that we implemented) YP(legality), is the result of the travel legality "Y" according to the application of mathematical model. From the results of model we are taking, Fopt = 3.762306016217445E-002 Copt(1)=2.658623009781310E007 Copt(2)=1.790759920467837 where; Fopt-function value (Y legality) Copt(1), Copt(2)- values of model parameters. In that way the function has the form, 1.790 Y ? 0.0000002658X p (1.3) In the same way we extracted the results and for eight other cities taken by order as the origin of travels. In this way the characteristics of transport in urban areas reflect in a broad way the social, economic, physical conditions at a given point in a given time. In Table 2 are given the variables and the correlation?s coefficient. Thus from the 200 directions of travel between 8 cities in the study, about 80-85% of them express a reliable correlation between the curve of O/D and that of legality of the O/D found by modeling the remaining 15-20% displays a correlation not very satisfactory. To select which of the variables “Xi” influence more on trips O/D, it was applied their simulation “Xp, Xmj, Xnd, Xfa, Xpu” by increasing them to the extent of 10%. From the application of mathematical model of the type power (equation 1.1) we obtained 200 values of trips O/D between the couple of cities and we get the following results. Specifically for simulation with 10 % of “Xp” we get the results as table 3. As a conclusion based on the above two assessments therefore; 1) to the extent of influence after the simulation with 10% of variables, 2) and coefficient “kO/D/Xi” [travel/unit variable]. Have made their classification, from which we selected three of variables that have significant impact on the generation and attraction of trips which are, population (Xp), vehicle of transportation of passengers (Xmj), and economic enterprises (Xnd) Based on these three selected variables in accord with (equation1.2) "construct" the model of trips generated or attracted in nationally rate, where, e-error term, for X1=Xp,; X2=Xnd and X3=Xmj. Then our function will have the following form, Y = a0 + a1Xp + a2Xnd + a3Xmj + e (1.64) STATISTICAL METHODS. Descriptive statistics, mean and standard deviation were tabulated using SPSS 16.0 software. RESULTS. Based on official data of INSTAT and the values of travel according to the matrix O/D we have benefited Table 4. To obtain the mathematical form of the model for interurban travel in national scale have applied software SPSS, where we have the following results and linear form of mathematical model of interurban travel. According to the results of software and the taken coefficients interurban travel modeling has the form of general equation as follows, Y=1003.578–0.029Xp+1.68Xnd+0.632Xmj (1.7) Based on the above model we calculated the values of the function “Y“ for 22 centering (cities) and the results are given in table 5. In this case, model rejected by the negative value of coefficient “a1 = -0.029 ” variable that is before "Xp" which is impossible, because it is in confrontation to the generation theory and trips attraction which estimate that the population is the community of variables that affect positively in increasing the travel. This discrepancy is due to multicorelation among the selected variables by our side with the desire to include as many variables in the modeling of travel. To continue to the realization of the goal of work shall exclude the variable "Xp" from the table 5 above and would appreciate the dependence of travels with two other variables “Xmj,and Xnd”. Besides the elimination of population variables we have increased the number of zone (cities) to have an even greater representation of spatial interaction. To obtain the mathematical form of model for generation interurban trips (table 5) in nationally scale we have applied again software SPSS, where we get the following results and linear form of mathematical model of generating interurban travel. (table 6,7)
DISCUSSION
According to the results of software and coefficients of Table 7, are, a0 = - 329.479; a1= 1.315; a2= 0.535; (1.8) and interurban travel modeling generation has the form of general equation as follows Ygj = - 329.4+1.315*Xnd+ 0.535*Xmj (1.9) Regarding the reliability of function (1.9) we halted in the analysis of some parameters that are evaluated by software through ANOVA (analysis of variation). From the results of tables 6 and 7 we see that the coefficient of determination is R 2=0.97 or 97%, which highlights the extent of variation of the “Y” from two variables “Xmj,andXnd” and from statistical theory is considered as a criterion to judge objectively on the quality of the model because it is the indicator of the degree of approximation of “Y and Xi” likewise, “R” corrected (adjusted R Square) and "R" Multiple, have very high values that attests to a strong correlation between independent variables and dependent variable. The data results of Table ANOVA according the table OUTPUT SUMMARY results that Significance F=1.45705E-20 is less than ? ? 0.05 so we are within a specified condition, while the validity coefficient (importance) to the ? ? 0.05 According the values of table I the book of Statistics) we have that probability of regression coefficient at the variable “Xnd" is 90% as the P-value=0:06, while the probability of the coefficient of regression at the variable "Xmj" is 95% as the Pvalue =0007 so many good values which estimate the model of "construction". Above model parameters carry a significant meaning so the regression parameter a1=1.315 before variable "Xnd" indicates that when the number of enterprises increased by 1% the number of trips generated will increase by 1.31% while for the regression parameter a2=0.535 before variable "Xmj" it shows that when the number of vehicles increased by 1% the number of trips generated will be increased by 0535%. Regarding the parameter a0 = - 329.479 in general have no much sense and requires great care in interpretation.
CONCLUSION
The Design of a model for the evaluation of interurban trips will help decision makers in policy planning, management and investment in the transport field.
ACKNOWLEDGEMENT.
I thank the staff of the Institute of Transport for the support given in data-base as well as colleagues of the Faculty of Mechanical Engineering, Polytechnic University of Tirana. Also thank the authors and co-authors for the literature that was useful in this publication. Authors acknowledge the immense help received from the scholars whose articles are cited and included in the references of this manuscript.
References:
1. John P. Sammon, Robert J. Caverly 2007. Transportation Systems.
2. Josef Sussman 2005. Introduction to Transportation System.
3. Kumares C. Sinha, Samuel Labi. 2007. Transportation Decision Making.
4. Avishai Ceder 2007. Public Transport Planning and Oparation.
5. C.S. Papacostas. P.D. Prevedours 2005. Transportation Engineering and Planning.
6. Prof.Dr. Myslym Osmani. 2005 Statistics.
7. Louis Berger. S.p.a. 2009. Albania National Transport Plan.
8. INSTAT 2009. Indicators by Prefectures.
9. Peter R. Stopher. Arnim H. Meyburg.Urban Transportation Modeling and Planning. 1975
10. Michael D. Meyer, Eric J. Miller. 2001 Urban Transportation Planning; a decisionoriented approach.
11. Susan Hanson. The geography of urban transportation. Aug 6. 2004
12. Ryuichi Kitamura, Satoshi Fujii, and Eric I. Pas. Time-use data analysis and modeling: toward the next generation of transportation planning methodologies. 1997
13. David A.Hensher, Kenneth J.Button. 2000. Handbook of Transport Modelling.
|
 IJCRR
IJCRR 


 This work is licensed under a Creative Commons Attribution-NonCommercial 4.0 International License


