IJCRR - 3(3), March, 2011
Pages: 52-58
Print Article
Download XML Download PDF
DEVELOPMENT OF FINGERPRINTS FOR SINGLE COMPONENT ANALYSIS OF AN AYURVEDIC
FORMULATION (PIPPLI CHURNA) BY HIGH PERFORMANCE LIQUID CHROMATOGRAPHY
Author: Gupta Vishvnath, Jain U. K.
Category: Technology
Abstract:Pippli Churna (PC) is a most popular Ayurvedic formulations among the Ayurvedic medicines,
Piperine is one of the major constituent of Pippli Churna. The process of development of HPLC
fingerprints for Pippli Churna extract is introduced in detail. The three laboratory batches and
three marketed batches were taken in this study to estimate the % of piperine in this indigenous
formulation. The selection of a suitable chromatographic system, the screening for important
parameters, and gradient optimization to method validation, and an integrated and universal
HPLC fingerprint approach was performed. This improves the separation quality of the
fingerprint. The detection wavelength of piperine was 343 nm. Thethree laboratory batches and
three marketed batches were taken in this study to estimate the % of piperine in this indigenous
formulation. The results of the method validation, based on the relative standard deviation of
relative retention times and relative peak areas, were acceptable. Calibration curves showed good
linearregression (R2 > 0.999) within test range. The LODs and the LOQs for the piperine were
0.063 mg/ml and 0.071 mg/ml. This strategy is used for the estimation of piperine in Pippli
Churna(PC) formulation and identifies and assessedits quality. Results of statistical analysis show
present HPLC method for determination of Piperine is simple, precise, accurate and suitable for
routine analysis of Piperine in PC. The developed fingerprints can be used as a standard and
Piperine can be used as a possible marker compound for fingerprinting of PC.
Keywords: Fingerprints, Pippli churna (PC), Piper species, Piperine marker, HPLC.
Full Text:
INRODUCTION
India has a vast heritage of traditional system of medicine (Ayurveda, Siddha and Unani), due to the lack of precise quality control measures and finger printing methods, the benefits of these systems remains largely underutilized 1. Keeping this thing in mind, from the last two decades, efforts have been made in developing quality control parameters for Ayurvedic formulations by means of chromatographic finger printing methods2,12. World Health Organization (WHO) has emphasized the need to ensure the quality of medicinal plant products by using modern controlled technique and applying suitable standards8 . For standardization of natural product drugs,
single chemical entities, “marker compounds,” may be used as potency standards in high performance liquid chromatography (HPLC) analysis. These marker compounds may be used to help identify herbal materials, set specifications for raw materials, HPLC analysis for marker compounds may provide additional information in the form of chromatographic fingerprints. The present study is undertaken to develop certain fingerprints for an Ayurvedic formulation. Pippli churna used for cough and cold, spleen disorders, fever, diabetes, piles, tuberculosis, abdominal disease ,thrust warms, leprosy, pain ( colicspasmodic) and digestive impairments. Pippli churna possesses bioavailability enhancing properties.,ie. antitubercular drugs and antilaprotic drug. The essential oils of pipali churna have antibacterial and antifungal activities. Ayurvedic formulary of India has given the specification for the composition of PC, it should contain piper species as a major ingredient apart from different herbs3,4 .
AIMS AND OBJECTIVES
Pharmacopoeial standards for Ayurvedic formulations published by the Central Council for Research in Ayurveda and Siddha gives certain physical parameters as standards for churna, these standards are not based on modern analytical methods5 . It is therefore essential to develop definite and accurate analytical tools to as certain consistency and quality of Ayurvedic preparation from batch to batch in pharmaceuticals which may results in acceptability world wide. In present study we tried to develop a method that serves as fingerprinting method for Pippli churna(PC).
EXPERIMENTAL
All the solvents for HPLC analysis were HPLC grade and purchased from E. Merck and S. D. Fine Chemicals, Mumbai. All solvents used for extraction were primarily distilled before use. SHIMADZU – LC10AT HPLC was used for piperine analysis. All the results are obtained by repetition of the each experiment six times (n= 6).
Procurement of drug
Crude drugs were procured from local market and identified by macroscopic10,11 and microscopic characters6,7,8,9 .
Preparation of formulations
1. Three batches were prepared in laboratory (named as PC-I,PC-II and PC-III) according to strict methods of „Ayurvedic formulary of India? and Sarangadhara-samhita. 2. Commercially available brands PC-A, PC-B, and PC-C, of Pippli churna were procured from local market.
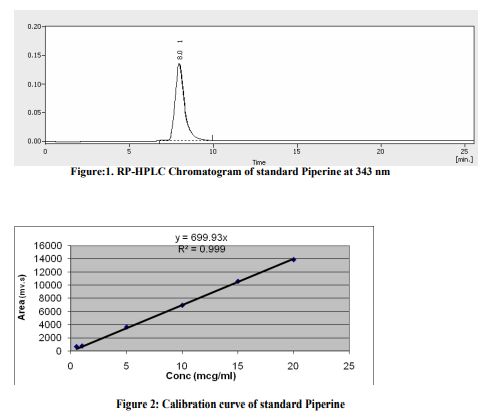
Sample preparation for estimation of Piperine content 1.5 gm Pippli churna was refluxed for 1 hour with 100 ml of methanol. The volume were reduced under pressure and filtered by 0.2 μm membrane filters. The filtrate was diluted up to 100 ml with methanol. To the 20 ml of resulting solution, 2 ml of 0.5- mg/ml solution of p-dimethyl amino benzaldehyde (internal standard) was added, and made the final volume 25 ml with methanol .7,12 [Fig. 1].
Preparation of standard solution Piperine was purchased from Lancaster, England. Standard solution was prepared by the addition of 2 ml of solution a (1mg/ml) of Piperine and 2 ml of internal standard solution (0.5 mg/ml of p-dimethylamino benzaldehyde) in a 25 ml volumetric flask made the final volume to 25 ml with methanol.
HPLC studies7 Estimation of Piperine was carried from different batches (three marketed and laboratory batch) of PC with following conditions:
Column : C 18 (25cm X 4.6 mm i.d.) 10 μ,
Mobile phase: methanol: water (69:31),
Detection: at 343 nm (reference wavelength: 343 nm),
Injection volume: 20 μl and
Flow rate: 1.5ml/min
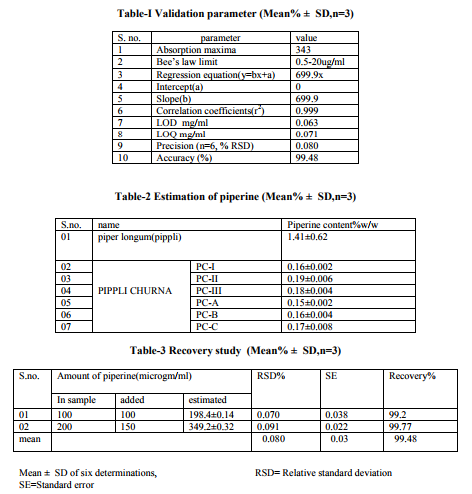
Calibration The Piperine content of PC was determined using a calibration curve established with seven dilutions, at concentrations ranging from 0.5-20 μg/ml. Each concentration was measured in triplicate. The corresponding peak areas were plotted against the concentration of the Piperine injected. Peak identification was achieved by comparison of both the retention time and UV absorption spectrum with those obtained for standards.
Validation parameters
Selectivity and peak purity Selectivity was checked by using prepared solutions of PC and available standards optimizing separation and detection. The purity of the peaks was checked by multivariate analysis. The three spectra corresponding to up slope, apex and down slope of each peak were computer normalized and super imposed. Peaks were considered pure when there was a coincidence between the three spectra (match factor was =98%).(Table-I)
Linearity, limits of detection and quantification The linearity of the detector response for the prepared standards was assessed by means of linear regression regarding the amounts of each standard, measured in μg, and the area of the corresponding peak on the chromatogram. Linearity was also confirmed for PC prepared sample solutions. After chromatographic separation, the peak areas obtained were plotted against concentrations by linear regression. Limits of detection and quantification were determined by calculation of the signal-tonoise ratio. Signal-to-noise ratios 3:1 and 10:1 were used for estimating the detection limit and quantification limit, respectively, of the method.
Precision
The repeatability of the injection integration was determined for both standard piperine and the content of piperine in Pippli churna. A standard solution containing reference compounds and prepared sample solutions was injected. Pippli churna samples were also prepared 2 times to evaluate the repeatability of the process. The mean amount and R.S.D. values were calculated. The precision was calculated at two different concentrations high and low tested in the concentration range. For standardization the sample was injected at eight different concentrations and linearity was noted [Table-1].
Accuracy
The accuracy of the method was determined by analyzing the percentage of recovery of the piperine in the Pippli churna. The samples were spiked with two different amounts (100, 150 μg) of standard compounds before sample preparation. The spiked samples were extracted by triplicate and analyzed under the previously established optimal conditions. The obtained average contents of the target compounds were used as the “real values” to calculate the spike recoveries [Table-1].
Robustness For the determination of the method?s robustness a number of chromatographic parameters, such as column package and size, mobile phase composition and gradient ratio, flow rate and detection wavelength, were varied to determine their influence on the quantitative analysis. Interday and intraday variability was studied for the sample, by injecting the same concentration of the sample on three different days and the standard error mean was calculated.
RESULTS AND DISCUSSION In the present study, spectral and chromatographic studies were performed. Results of the The RP-HPLC analyses of PC were performed, samples were injected at seven different concentrations and the linearity was observed with in the concentration range of 0.5-20 μg/ml [Fig. 2].Both Piperine was well separated at retention time 8.020 respectively. The concentration of Piperine present in raw material was found to be 1.41±0.62 w/w in Piper longum fruits (pippli). The content of Piperine in laboratory formulations (PC-I, II, III) were found to be 0.16±0.002 ,0.19±0.006 ,and 0.18±0.004 respectively and in different marketed formulations of PC were, for PC-A (0.15 ±0.002 %), PC-B (0.16±0.004%), PC-C (0.17±0.008 %) w/w respectively [Table-2, Fig-1]. The HPLC method was validated by defining the linearity, peak purity, limit of quantification and detection, precision, accuracy, specificity and robustness. For the qualitative purposes, the method was evaluated by taking into account the precision in the retention time, peak purity, and selectivity of piperine elutes. A high repeatability in the retention time was obtained with (R.S.D.) value lower than 1.5% for both standard and samples even at higher concentration. (Table-3).The peak purity was studied in the major peaks. Linearity, limit of detection (LOD), limit of quantification (LOQ), accuracy and precision were evaluated for quantitative purposes [Table-1].Thus LOD and LOQ found to be 0.063, 0.071mg/ml respectively which suggest full capacity for quantification of piperine content in different laboratory and marketed batches of PC. R2 value for the regression equation of the Piperine was higher than 0.9988 thus confirm the linearity of the method. The recovery study was performed at two levels by adding known amount (100, 150 μg/ml) of piperine with reanalyzed sample of PC found to be close to 99.48(mean)% and a higher repeatability indicate a satisfactory accuracy in the proposed methods [Table- 3].Finally the robustness of the method was also assessed. Minor modification of the initial mobile phase gradient (from 25 to 30% solvent instead of 31%) had no effect on the peak resolution of the compound. Therefore, this HPLC method for fingerprinting of PC can be regarded as selective, accurate, precise, and robust. The method is very adaptable because of the precision and repeatability for the traditional Ayurvedic formulation like PC and suitable for routine analysis of Piperine in PC. There was not much variation in the interday and intraday injections performed with the R.S.D. value was found to be 0.080%with the mean standard error 0.03% respectively. Piperine estimation can be utilized as a possible analytical marker for fingerprinting of Pippli churna.
CONCLUSION
The developed high performance liquid chromatographic method for estimation of Piperine from Pippli churna could be used as a valuable analytical tool in the routine analysis, to check the batch to batch variation. Estimation of Piperine can be used as one of the appropriate analytical markers for the finger printing.
ACKNOWLEDGEMENT
The authors are grateful to Principal, BITSPharmacy college , Bhopal for their unforgetable support.
References:
1. Mukherjee PK. Quality Control of Herbal Drug. Ist edition, New Delhi: Eastern Publishers (Business Horizontal Ltd.) 2002;03-30,184-219.
2. Jain V, Saraf Swarnlata, Saraf S. Standardization of Triphala Churna: Spectrophotometric approach. Asian J of Chem 2007;19(2):1406-10.
3. Kokate CK, Purohit AP, Khandelwal KR. Pharmacognosy, 29th edition, New Delhi: Nirali Prakashan 2002;550-9.
4. The Ayurvedic Formulary of India, PartI, II nd edition, New Delhi: Govt. of India, Ministry of Health and Family 58 International Journal of Current Research and Review www.ijcrr.com Vol. 03 issue 03 Mar 2011 Planning, Department of Health 2003,103-19
. 5. Pharmacoepical standards for Ayurvedic Formulations. Central Council for Research in Ayurvedic and Siddha, New Delhi: Ministry of Health and Family Welfare 1987;112-23.
6. Quality Standards of Indian Medicinal Plants. Volume I and II, New Delhi: Indian Council of Medicinal Research 2003;95,168
7. Indian Herbal Pharmacopoeia, Volume II, Mumbai: Indian drug Manufacturing Association and Regional Research Laboratory Jammu 1999;90-3,126-62.
8. World Health Organization, Quality Control Methods For Medicinal Plants Materials, Geneva : 1998,1-15.
9. Khandelwal KR. Practical Pharmacognosy Techniques and Experiments. 9th edition, New Delhi, Nirali Prakashan 2002;152.
10. Wagner H. Plant drug analysis, a thin layer chromatography atlas, II nd edition, Springer 2002 298. 10. Wagner H, plant drug analysis, a thin layer chromatography atlas, IInd edition, springer 2002, 298.
11. Kokate C.K. Practical Pharmacognosy, IVth edition , New Delhi : Vallabh Prakashan 1996; 143.
12. Jain V, Saraf Swarnlata, Saraf S. Spectrophotometric Determination of Piperine in Trikatu Churna: An Ayurvedic Formulation Asian J of Chem 2007;19(7):5331-5.
|
 IJCRR
IJCRR 


 This work is licensed under a Creative Commons Attribution-NonCommercial 4.0 International License


