IJCRR - 2(10), October, 2010
Pages: 09-15
Print Article
Download XML Download PDF
CLUSTERING OF DATA AFTER MINIMIZING DATA SIZE USING ROUGH SET THEORY
Author: Sunanda Das, Asit Kumar Das
Category: Technology
Abstract:Objective: Our approach is to reduce the large data size to a small data size which represents same features of the total large data set, so that computational complexity
becomes shorter.
Method: In this paper we present a new approach to minimize the data size and then to cluster that reduced data. The volume of data being generated nowadays to cluster is
increasingly large. How to extract useful information from such data collections is an
important issue. A promising technique is the Rough set theory, a new mathematical
approach to data analysis based on objects of interest into similarity classes which are
indiscernible with respect to some features.
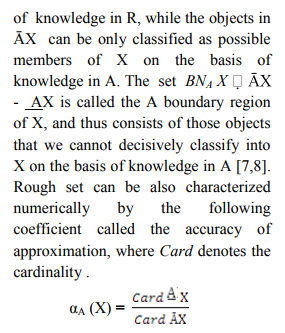
Result and conclusion: This theory offers two fundamental concepts: reduct and core.
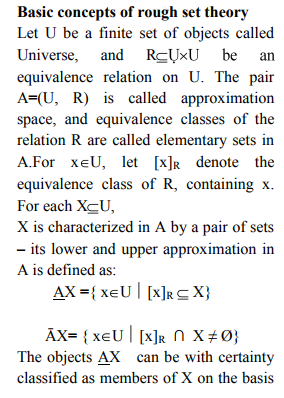
In this paper, some basic ideas of rough set theory are first presented. Some experiment
results are also given.
Keywords: Rough set theory, Data mining, correlation
Full Text:
INTRODUCTION
Data mining is an emerging area of computational intelligence that offers new theories, techniques, and tools for processing large volumes of data. It has gained considerable attention among practitioners and researchers as evidenced by the number of publications, conferences, and application reports. The growing volume of data that is available in a digital form has accelerated this interest. Data mining relates to other areas, including machine learning, cluster analysis, regression analysis, and neural networks [1-5]. Rough set theory [6] is a relatively new mathematical technique developed by Pawlak in the 1980s to describe quantitatively uncertainty, imprecision and vagueness. Classical set theory deals with crisp sets and rough set theory may be considered an extension of the classical set theory. The rough set approach has many advantages. An important step in the knowledge discovery process is the reduction of thedimensionality of data. In real database systems, though there are many attributes and records, in some circumstances, in fact only some of the attributes are indispensable. If the dispensable attributes can be eliminated, the complexity of analyzing the data can be greatly reduced. Our algorithm is based on rough set theory which consists of two parts. The first part is for attribute reduction and the second is for rule extraction.
Dataset: In this experiment we use a wine dataset having 13 different attributes each of having 178 different data values. Using the 10 fold method we divide this dataset into 10 different test datasets and train datasets.
MATERIALS AND METHODS
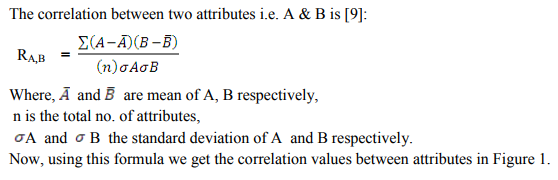
Correlation:
Using correlation function in MATLAB, we get 10 different tables for 10 different train datasets in which each attribute value shows the correlation with other attributes.
RESULT AND DISCUSSION
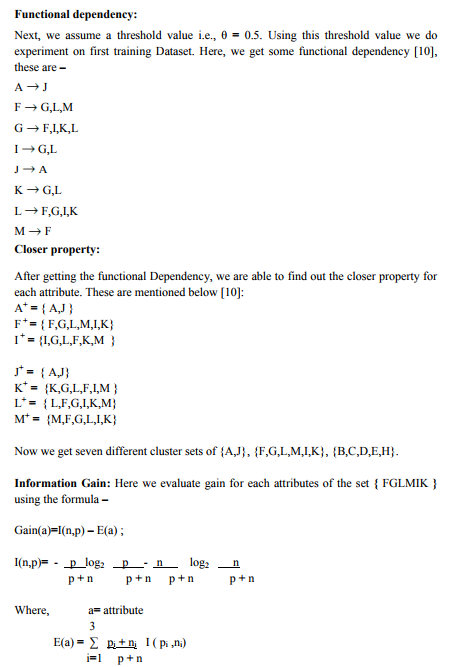
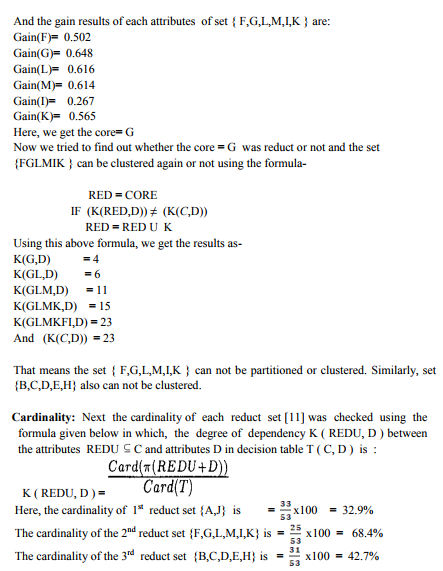
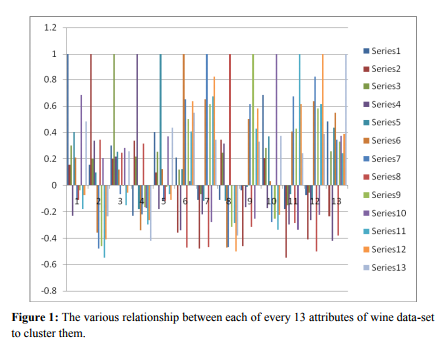
After doing the stepwise experimental work, we get 10 correlation matrix. From the correlation-matrix of first training dataset, we got graph as given in Figure 1. The correlation coefficients are a normalized measure of the strength of the linear relationship between two variables and range between -1 and 1, where -1 means that one column of data has a negative linear relationship to another column of data. 0 means there is no linear relationship between the data columns. 1 means that there is a positive linear relationship between the data columns. Figure 1 is a grouped bar graph. The bars in the first group correspond to the first row of the matrix, the 2nd group to the 2nd row and so on. In this figure, 1st group bar, there are 13 bars each of which represents the correlation between each pair of attribute ( row & column). which is having negative and positive values in correlation are represented in both side of the origin, in such a way that each cluster of column bar shows 13 attributes in positive and negative value. So, this above Figure1 represents the graphical representation of correlation-matrix of first training dataset of wine dataset. After getting the correlation values between the 13 attributes of wine dataset, we get the 8 different Functional Dependencies using the threshold value θ = 0.5. And then using closer property we get 7 different values to predict the classification of these attributes i.e. {A,J}, {F,G,L,M,I,K}, {B,C,D,E,H}. Then using the Information gain formula, we find that the set{ F,G,L,M,I,K } and {B,C,D,E,H} can not be clustered again. Then using cardinality formula, the 3 different cardinality values in percentage of the sets {A,J}, {F,G,L,M,I,K}, {B,C,D,E,H} are generelated that are 32.9%, 68.4% , 42.7% respectively. Among these values 68.4% of set {F,G,L,M,I,K} is the highest value. This means that the reduct set {F,G,L,M,I,K} only can represent the characteristics of the total 13 attributes of this wine dataset.
CONCLUSION
In this paper, basic concepts of data mining and the rough set theory were discussed. The patterns formed by the rules extracted with rough set theory differ from other patterns. Here the method was illustrated with a numerical example. This method shows that instead of handling large volume of data, we can easily work with small-size of data which gives same meaningful information and characteristics of the whole data. This method enhances the utility of the extracted knowledge, reduces timecomplexity. This method can be further enhanced by getting the cardinality value 100% approximately.
References:
1. Andrew Kusiak. Rough Set Theory: A Data Mining Tool for Semiconductor Manufacturing. IEEE Transactions on Electronics Packaging Manufacturing 2001; 24(1):44-50. 14 International Journal of Current Research and Review www.ijcrr.com Vol. 02 issue 10 Oct 2010
2. Langley P, Simon HA. Applications of machine learning and rule induction. Commun. ACM 1995; 38(11) :55–64.
3. Carbonell JG. Machine Learning: Paradigms and Methods. J. G. Carbonell, Ed. Cambridge. MA: MIT Press 1990.
4. Reiter R. A theory of diagnosis form first principles. Artif. Intell 1987; 35: 57–95.
5. Barto A, Sutton RS. Reinforcement Learning. Cambridge. MA: MIT Press 1998.
6. Pawlak Z. Rough sets. Int. J. Inform. Comput.Sci 1982; 11(5): 341-356.
7. Pawlak Z. Rough Sets - Theoretical Aspects of Reasoning about Data. Kluwer Academic Publishers, Boston, London, Dordrecht 1991:229.
8. Pawlak Z. Rough set theory and its applications to data analysis. Cybernetics and Systems 1998; 29: 661-688 .
9. Jiawei Han, Micheline Kamber. Data Mining: Concepts and Techniques. Data Mining Books, Publisher: Elsevier Science Ltd. Second edition, China Machine Press :296 -303.
10. Abraham Silberschatz, Henry Korth, Sudarshan S. Database System Concepts, Database Books. McGraw-Hill.
11. Ihn-Han Bae, Hwa-Ju Lee, KyungSook Lee. Design and evaluation of a rough set- based anomaly detection scheme Considering weighted feature values. International Journal of KnowledgeBased and Intelligent Engg. System 2007; 11:201-206.
|
 IJCRR
IJCRR 


 This work is licensed under a Creative Commons Attribution-NonCommercial 4.0 International License


