IJCRR - 3(7), July, 2011
Pages: 96-99
Print Article
Download XML Download PDF
HOURLY OZONE CONCENTRATION PREDICTION USING NEURAL NETWORK MODEL
Author: G.Geetha
Category: General Sciences
Abstract:The aim of the present work is to provide a methodological procedure to forecast hourly Ozone concentrations using Artificial Neural Networks (ANNs). The study area is the urban center of Chennai, and the results are presented here. The model can predict the mean surface ozone based on the parameters like concentration of Nitrogen-di-oxide, temperature, relative humidity, sun spot number, wind direction and wind speed. The model can perform well both in training and independent periods. The achieved results were satisfactory.
Keywords: Artificial Neural Networks surface ozone Air pollution
Full Text:
INTRODUCTION
Ground-level ozone air pollution is of great concern because of its adverse effects on human health and ecosystems (Poupkou et al.2008, Cristofanelli and Bonasoni 2009). Ground-level ozone is not emitted directly into the atmosphere. It results from photochemical reactions between oxides of nitrogen (NOx) and volatile organic compounds (VOCs) in the presence of sunlight (Pudasaine etal2006, Vingarzan and Taylor 2003, Clapp and Lenkin 2001, Sillman 1999). Present paper aims to develop a simple model using neural network technique based on the data which are easily available. The performance of the model is satisfactory both in training and independent period.
Area of Study and data
Ground level ozone concentration and nitrogen dioxide measurements were carried out in the urban site Chennai, Tamil Nadu, India. India is a tropical country urbanized district. Its irregular shape covers about 174 Km2 (M.Pulikesi et al., 2005). It is geographically positioned between 12º9´ and 13º9´ of the Northern latitude and 80º12´ and 80º19´of the eastern longitude.
MATERIALS AND METHODS
A portable Aeroqual series S200 ozone monitor was used. An Aeroqual series S200 ozone monitor is constructed to measure low and high ozone levels. Its ultra low concentration ozone head measures the ozone concentration from 0.000 to 0.500 ppm, and a high concentration ozone head measures the ozone Concentration from 0.50 to 20.00 ppm. Accuracy of a low concentration ozone head is ± 0.001 ppm (from 0 to 0.100 ppm); ± 10% (0.100 to 0.500 ppm), while that of a high concentration ozone head is ± 10% (from 0.20 to 2.00 ppm); ± 15% (from 2.00 to 20.00 ppm), the measurement unit being either ppm or μg/m3. The operating Temperature range is from – 5 o C to 50o C, relative humidity limits are 5% and 95%. Similar kind of NO2 sensor has been used for nitrogen dioxide measurement. A gas sensitive semiconductor (GSS) type is used to measure the ozone and nitrogen dioxide values. Gas sensitive sensor head is interchangeable and replaceable. LCD type display. The temperature range is from -400C to 1240C humidity range 0 to 100%. Wind speed is calculated using a wind vane. Wind velocity is measured using AM- 4201digital Anemometer. Measurement in range 0.4 – 3 m\s has resolution 0.1 m\s of accuracy ± (2% + 0.2 m\s). The ambient temperature and humidity are measured by Thermo Hydrometer. Temperature accuracy ± 0.1oCand humidity accuracy ± 5%. Sampling was carried out for five days from 13- 11-2010 to 17-11-2010 for every 1 hour interval.
Brief review of neural network technique
Neural Networks are signal processing systems that attempt to emulate the behavior of biological nervous systems by providing a mathematical model of combination of numerous basic blocks called neurons connected in a network. It is remotely analogous to living nervous system and hence its name. As input to the model, a historical set of significant meteorological data is used, whereas the output, ozone concentration is predicted by the model. The network is trained with the past data. By the proper choice of training sets, after the learning process, the trained network is capable of predicting the ozone concentrations as an output according to the inputs and internal structure of the network established during the learning period. The transfer function used here is the sigmoidal function. The ANN‘s are product of the artificial intelligence,which miming the neurons networks, allow expert systems and learning skills..(Benvenuto et al,2000) The process of learning the training set of patterns means the determination of the optimum weights which minimize the mean square error between the outputs in the output layer and the desired values. Most commonly used ?back-propagation learning algorithm? [Rumbelhart et al., (1986)] is used for the training. Initially random weights between ±0.5 are assigned to each weight as initial guesses. The weights are learned through an iterative process. During learning the weights are updated. When the network learns the training set of patterns well enough it can be used for determining the output values for the pattern with unknown outputs (Test period or prediction period).
RESULTS AND DISCUSSION
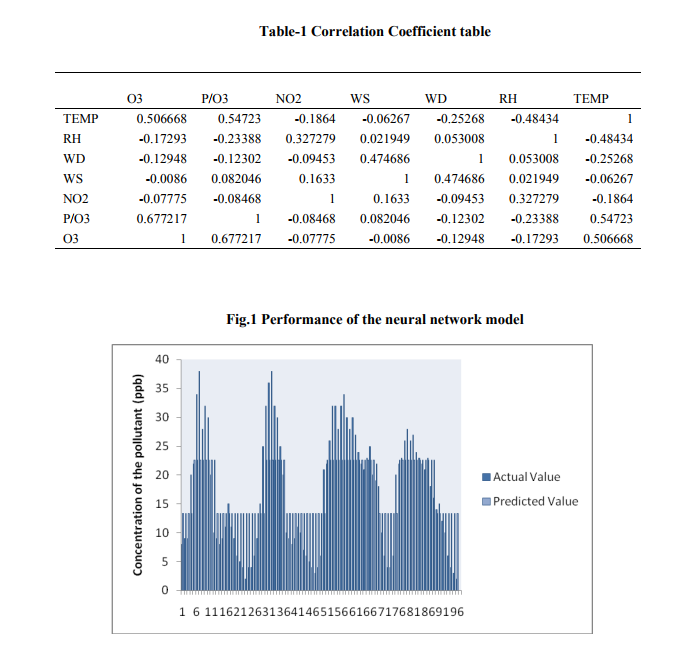
The data is separated for training of the network and the network was trained. The weight values were fixed. Remaining data was used for testing of the network. The results suggest that the Sunspot number is one of the best predictors for ozone prediction. Table 1 gives the correlation coefficient values of the set of values. The correlation coefficient values give the relationship among the various predictors. The result obtained is shown in the Fig. 1.Surface ozone - predicted versus actual values. As indicated by the results it provided the highest performance. This was due to enabling of the ozone by Sunspot number and the input parameters, resulting in improved training and thus improved prediction. Root Mean Square Error (RMSE) training data set 0.176988 % Root means Square Error (RSME) for testing data 21.168520 % The above results validate the proposed model.
CONCLUSION
Our results suggest that neural network technique is promising tools for modeling and prediction of ozone. Results can be summarized as follows;
(i) The ANN constructed models suggests high feasibility of the application of ANN technique for the prediction of hourly ozone within reasonable error bounds.
(ii) The predictive analysis suggest a considerable link among solar/ Sunspot cycle, related variability and ozone formation.
(iii) It is concluded that the above model can be used for Predicting surface ozone concentration with nitrogen dioxide, temperature, % relative humidity, Sunspot number, wind direction and wind speed as predictors.
References:
1. Chudzynski S., Czyzewski A., Ernst K., Pietruczuk A., Skubiszak W., Stacewicz T., Stelmaszczk K., Szymanski A., Sowka I., Zwozdziak A., Zwozdziak J., Observation of ozone concentration during the solar eclipse. Atmospheric Research, 2001, Vol. 57, p. 43-49. ELSEVIER . ISSN 0169- 8095.
2. Clapp I., J., Jenkin M., E., Analysis of the relationship between ambient levels of O3 . NO2 and NOx as a function of NOx in the UK Atmospheric Environment. 2001. Vol. 35 p.0401-0405 ELSEVIER ISSN 1352- 2310.
3. Cristofanelli P., and Bonasoni P., Background ozone in the southern Europe and Mediterranean area: Influence of the transport and processes. Environmental Pollution, 2009, Vol. 157, p. 1399-1406. ELSEVIER. ISSN 0269-7491.
4. Poupko A., Symeonidis P., Lisaridis I., Melas D., Ziomas I., Yay O.D., Blis D. Effects of anthropogenic emission sources on maximum ozone concentration over Greece. Atmospheric Research, 2008, Vol. 89, p. 374-381. ELSEVIER.ISSN 1352- 2310.
5. Pudasainee D., Sapkota B., Manohar L.S., Kaga A., Kondo A., Inoue Y. Ground levels ozone concentration and its association with NOx and meteorological parameters in Katmandu valley, Nepal. Atmospheric Environment, 2006, Vol. 40, p. 8081-8087 ELSEVIER.ISSN 1352-2310.
6. Pulikesi M, P.Baskaralingam, D.Ilango, V.N.Raidu, V.Ramamoorthy, S.Sivanesan, Air quality monitoring in Chennai, India, in the summer of 2005. J.Hazard.Mater. 136(2006)589-596.
7. Rumbelhart, D.; Hinton, G.E.; Wiliams, R.J. (1986): Learning internal representation by error propagation, In parallel distributed processing Exploration in the Microstructure of Cognition, Vol I, Cambridge.
8. Sillman S., The relation between ozone, NOx and hydrocarbons in urban and polluted rural environments. Atmospheric Environment, 1999, Vol. 33, P. 1821-1845. ELSEVIER.ISSN 1352-2310.
9. Vingarzan R., Taylor B. Trend analysis of ground levels ozone in the greater Vancouver/Fraser Valley area of British Columbia. Atmospheric Environment, 2003, Vol. 37, p. 2159-2171. ELSEVIER.ISSN 1352-2310
10. Westmoreland E. J., carslaw N., Carslaw D., Gillah A., Bates E Analysis of air pollution within a street canyon using statistical and dispersion modeling techniques. Atmospheric Enviroment, 2007, Vol. 41, p. 9195-9205. ELSEVIER.ISSN 1352-2310.
11. www.aeroqual.com/gas sensitive sensor/14-10-2010
|
 IJCRR
IJCRR 


 This work is licensed under a Creative Commons Attribution-NonCommercial 4.0 International License


