IJCRR - 3(7), July, 2011
Pages: 70-77
Print Article
Download XML Download PDF
A COMPARATIVE STUDY ON EXTENDED TIMED GET UP AND GO (ETGUG) TEST BETWEEN RIGHT AND LEFT HEMIPLEGICS
Author: Sankar Sahayaraj Muthukaruppan, RavindraSubbanna, Harilal Bapurajapanicker
Category: Healthcare
Abstract:Objective: The purpose of the study is to enlighten the role of limb dominance in gait training and for tailoring the gait training programme in physical therapy treatment between the categorical (temporal parameters) and the representational (visuo-spatiial parameters) hemispheres. Methods: between 45-55 years old left hemisphere dominant sixty males with hemiplegic (30 right side and 30 left side), satisfying the inclusion criteria were chosen for the study. Extended Timed Get Up and Go (ETGUG) test was used to assess the duration of sit to stand, gait initiation, walking, turn around, sitting down, and speed of the walk. Independent?t' test was used to compare the components of both the groups. Results: The findings showed that there were significant durational changes in the various components of ETGUG test between right side and left side hemiplegic subjects.
Conclusion: The gait rehabilitation should be emphasized on standing up, turning and sitting down for left sided hemiplegics and gait initiation, walking and speed for right sided hemiplegics. Temporal and the spatial parameters should be considered during gait training and gait training programme should be given for right and left side hemiplegic subjects differently.
Keywords: Hemiplegic patient, ETGUG test, limb dominance, gait training.
Full Text:
INTRODUCTION
Hemispheric specialization is related to handedness. Handedness appears to be genetically determined. 96% of right-handers had left cerebral dominance, and the remainder had right cerebral dominance. Left dominance was observed in 70% of left-handers, bilaterality in 15% and right-dominance in 15%1 . There are anatomic differences between the two hemispheres that may correlate with the functional differences. During gait the left lower limb contributed mainly to body weight transfer during walking; whereas the right lower limb was responsible for propulsion.2 The leading limb mainly contributes to forward progression, where as the trailing limb provides control and contributes to propulsion to a lesser extent.3 The concept of cerebral dominance and a dominant and non dominant hemisphere has been replaced by a concept of complementary specialization of the hemispheres, One for sequential analytic processes (the categorical) and the other one for visuo-spatiial relations (the representational hemisphere).4 In India the incidence of cerebrovascular disease was found to be 13/1,00,000 population/year in a study conducted in 1969 - 71 at Vellore5 , 31/1,00,000 population/year in a study conducted at Rohtak6 and 124/1,00,000 population / year in a study conducted at Baruipur, West Bengal7 . A WHO study in 1990 quoted incidence of mortality due to stroke in India to be 73/1,00,000 per year. 8 Hand dominance affects an individual‘s functional ability after a stroke; yet current constrained induced movement therapy studies have not sufficiently addressed dominance and its role in functional recovery9 . People with non dominant could possibly returns to a previous level of functioning at a quicker phase compared with an individual with a dominant side stroke. Gait asymmetry in temporal and kinematics variables challenging the assumption of that right and left limbs are functioning symmetrically10. Gait asymmetry in people without impairments can be explained in terms of actions taken by the lower limb to propel the body segments and to control their forward progression.11 Subjects with right hemisphere lesions had greater troubles than those with left hemisphere lesions in regaining the ability to stay seated unassisted.12 Walking speed, step length, and double support ratio, have been varied more in cognitive impairments than in healthy older adults. The objectives of the study were to investigate the duration of various components of ETGUG Test between right side hemiplegic subjects, and left side hemiplegic subjects to modify the treatment protocol for the right and left side stroke subjects.
Need of the Study
Changing life styles, and habitual intake of junk food and the added stress increase the incidence of stroke in developing countries like India. Over the past few decades, demographic shift caused by increasing life expectancy resulted in a burgeoning aging population in India. The previous urban community-based studies had documented an age adjusted incidence rate of stroke from 13 in 1970 to 105 per 100 000 persons per year in 2001.5,13 Stroke rehabilitation is a long drawn process and the knowledge about the contributing factors might help in tailoring the treatment and make it cost effective by reducing treatment duration. The ability to walk is the prime factor that determines whether a patient will go home or to a nursing home and whether he or she will return to the previous level of productivity after a stroke. 14,15,16,17 This study aimed to provide an opportunity for Neuro - physical therapist as they would be able to scientifically understand and assess the role of dominant hemispheres during the gait training programme, the role of parametric screening tool utilizing in physical therapy assessment, and the role of visuo-spatial, cognitive, psychosomotor and limb dominance in gait rehabilitation programme in stroke.
MATERIALS AND METHODS
It was an observational study. 30 right side affected and 30 left side affected hemiplegic subjects (Middle Cerebral Artery infarcts and Brunstorm stage V), taking treatment in the physiotherapy department were taken for this study. Subjects included in the study were 45-55 years 8 and having the ability to walk 20 meters independently without walking aids. Subjects were excluded if they had deteriorating medical conditions, structural and functional orthopedic problems of lower limb, and neurological problems like cerebellar lesions, basal ganglion lesions and previous history of head injury. Also subjects under sedative therapy, visually impaired subjects and non co-operative subjects were excluded.
The Extended Timed Get Up and Go (ETGUG) test is a potential, objective, assessment tool that can be used in almost any clinical setting with minimal equipment, professional expertise or training. It better isolates functional deficits thereby aiding the therapist in devising prevention strategies and guiding both treatment and further testing
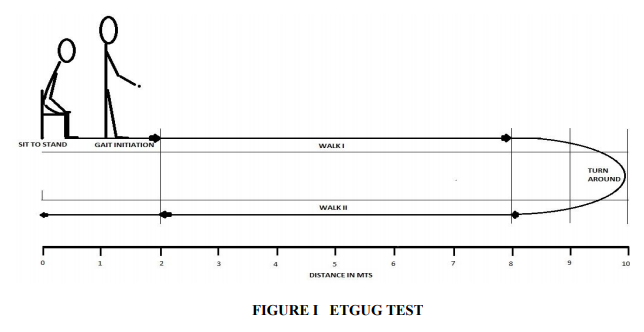
Multi-memory stopwatch is the basics of ETGUG and measures the total time to complete a task, as well as the time intervals for components within that task. The laps and the phases of test with which they correspond are as follows: Lap task: Sit to stand, Gait initiation, Walk 1, Turn around, Walk 2, Slow down, stop, turn around and sit down. Since the distance for walk 1 and walk 2 are to know walking speeds, can be calculated from the times taken for these components of the ETGUG test. This is important objective measure of functional ability in the stroke subjects. In order to avoid errors; subjects were oriented about the study prior to the conduct of the test. Standard protocol for ETGUG test was followed. 18
Statistical Methods
Data were statistically analyzed by using Independent t test for comparing each components of ETGUF between right and left sided hemiplegics by SPSS version 16 for windows.
RESULTS
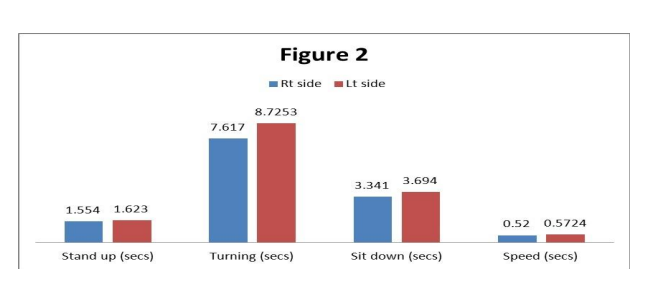
Stand up, Turning, Sit down and speed, were increased in left hemiplegic subjects is showed Figure 2. It showed they took maximum time to complete the tasks than right hemiplegic subjects. So these components are difficult for left hemiplegic subjects.
Stand up
Group I right hemiplegics has the mean of 1.5540 with SD of 0.12227 and Group II left hemiplegics has the mean of 1.6230 with a SD of 0.11114. The mean difference is 0.690 and the t calculated value of 2.287 df= 58 at 5%. P value is 0.026. Thus there is a significant difference between the two groups and result indicates that right group is able to stand up easily than left group
Turning
Group I right hemiplegics has the mean of 7.6170 with SD of 0.43560 and left hemiplegics group has the mean of 8.7253 with a SD of 0.95102. The mean difference is 1.1083 and the t calculated value of 5.803, df= 58 at 5%. P value is 0.000. Thus there is a significant difference between the two groups and result indicates that right group is able to turn easily than left group.
Sitting down
Group I right hemiplegics has the mean of 3.3410 with SD of 0.15103 and left hemiplegics group has the mean of 3.6940 with a SD of 0.13361. The mean difference is 0.3530 and the t calculated value of 9.588, df= 58 at 5%. P value is 0.000. Thus there is a significant difference between the two groups and result indicates that right group is able to sit in the chair easily than left group.
Speed
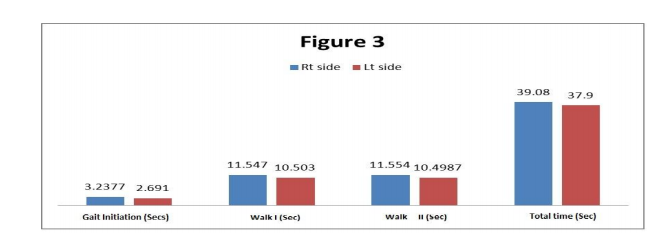
Group I right hemiplegics has the mean of 0.5200 with SD of 0.2387 and left hemiplegics group has the mean of 0.5724 with a SD of 0.3101. The mean difference is .0525 and the t calculated value of 7.343, df= 58 at 5%. P value is 0.000. Thus there is a significant difference between the two groups and result indicates that right group is able to walk faster than left group. Gait initiation, Walk I and Walk II took longer duration to complete the task in right hemiplegic subjects than left side hemiplegic subjects are shown in Figure 3. So these components are difficult for right hemiplegics than left hemiplegics.
Gait initiation
Group I right hemiplegics has the mean of 3.2377with SD of 0.66638 and left hemiplegics group has the mean of 2.6910 with a SD of 0.18894. The mean difference is 0.5467 and the t calculated value of 4.323, df= 58 at 5%. P value is 0.000. Thus there is a significant difference between the two groups and result indicates that right group is easily able to perform gait initiation than left group
Walk I
Group I right hemiplegics has the mean of 11.547 with SD of 0.5708 and left hemiplegics group has the mean of 10.503 with a SD of 0.5425. The mean difference is 1.045and the t calculated value of 7.266, df= 58 at 5%. P value is 0.000. . Thus there is a significant difference between the two groups and result indicates that right group is walk faster than the left group.
Walk II
Group I right hemiplegics has the mean of 11.5540 with SD of 0.48604 and left hemiplegics group has the mean of 10.4987 with a SD of 0.58557. The mean difference is 1.0553 and the t calculated value of 7.596 df= 58 at 5%. P value is 0.000. Thus there is a significant difference between the two groups and result indicates that right group is more faster walk than the left group. Figure 3 showed the time duration to complete the task is longer in right hemiplegic subjects than left hemiplegic subjects. Also the left hemiplegic subjects were able to finish the task faster than in right hemiplegic subjects.
Total time
Group I right hemiplegics has the mean of 39.0800 with SD of 2.08339 and left hemiplegics group has the mean of 37.9000 with a SD of 1.52131. The mean difference 1.1800 and the t calculated value of 2.505, df= 58 at 5%. P value is 0.015. Thus there is a significant difference between the two groups and result indicates that right group requires maximum time to finish the task than left group.
DISCUSSIONS
The absence of well recognized measures to evaluate functional recovery after a stroke and the large variety of rehabilitation techniques and protocols add credence to the questioning of the value of rehabilitation in terms of costs and psychosocial benefits.19, 20, 21 The maximum weight-bearing difference between the 2 lower extremities during the Sit To Stand task was highest for the subjects with stroke who had the lowest scores on the Functional Independence Measure.22
The present study analyzed various components of functional mobility in right and left side hemiplegic subjects. In our study, Standing up (Sit to stand), turning and sitting down require maximum balance, which is significantly reduced in trailing limb (left limb) affected subjects. Leading limb (right limb) affected subjects took longer duration for gait initiation and finishing the task (walking) than the trailing limb affected subjects. This implies right side affected stroke subjects (right handed) had more difficulties with gait initiation and walking and left side affected subjects had more difficulties in sit to stand, turning and sitting downGait performance in subjects with stroke is characterized by slower gait velocity and residual spatial and temporal left-right asymmetry, compared with that in healthy adults. The average walking speed of stroke subjects is lower than that of healthy controls but the values vary depending on the severity of the stroke, the time post-stroke and the age of the subjects23 . In this study these variables were controlled. Previous studies suggested that the gait velocity of patients with stroke of varying severity ranges from approximately 0.18 to 1.03m/s, 24,25,26,27 whereas that of healthy adults of similar ages averages about 1.4m/s28 in our present study also suggested the same. The speed was less than the normal and for the Right side hemiplegics it was 0.5200 ± 0.2387 m/s and left side hemiplegics group it was 0.5724 ± 0.3101. The right side affected group was able to walk faster than left side affected group. The ability to complete the task is faster in left sided hemiplegic subjects. But both the groups took more than 30 seconds to complete the task. So they were under the risk category, since the falling criteria is more than 30 sec for ETGUG test.
CONCLUSIONS
ETGUG test components were not in similar. In stroke patient‘s conventional rehabilitation program will not provide additional benefit in terms of lower extremity motor recovery and mobility. So the training of functional mobility and gait training should be concentrated differently for right side affected hemiplegics and left side affected hemiplegics in physiotherapy. Training should not be concentrated only on temporal parameters. The temporal and spatial parameters as well as hemisphere dominance should be considered for gait training protocols.
ACKNOWLEDGEMENT
The author expressing his sincere thanks to Professor James C. Wall, PhD Department of Physical Therapy, University of South Alabama for his advices in ETGUT Test.
References:
1. Annett, M. (2002). Handedness and brain asymmetry the right shift theory. East Sussex: Psychology Press.
2. Hirasawa Y. Left leg supporting human stright (bipedal) standing. saiensu. 1981; 6:32-44.
3. Sadegli H, Allard1 P, Duhaime M. Contribution of lower limb muscle perser in gait of people with not impairments Phys Ther 2000, 8: 12: 188-1196.
4. William F. Ganong, Review of medical physiology. 18th ed. San fransisco: PrenticeHall international, Inc; 1997. p.257.
5. Abraham J, Rao PSS, Inbaraj SG, Shetty G, Jose CJ, An epidemiological study of hemiplegia due to stroke in South India. Stroke 1970; 1: 477-81
. 6. Bansal BC, Parkash C, Jain AC, Brahmanandan KRV. Cerebrovascular disease in young individuals below the age of 40 years. Neurol India 1973; 21: 11-8.
7. Bhattacharya S, Saha SP, Basu A, Das SK. A 5-year prospective study of incidence, morbidity and mortality profile of stroke in a rural community of Eastern India. J Indian Med Assoc 2005; 103: 655-9
8. Prasad K: Epidemology of cerebrovasular disorders in India. In: Recent concepts in stroke by Bansal BC (ed) Indian college of physicians, New Delhi, 199; 4-19.
9. Hellige J. Hemispheric Asymmetry: What‘s Right and What‘s Left? Cambridge, Mass: Harvard University Press; 1993.
10. SadeghiH, Allard P, Duhaime M. Functional gait asymmetry in able bodied subjects. Human Movement science. 1997; 16:243- 258.
11. Gunderson LA, Valle DR, Barr AE, et al, Bilateral analysis of the knee and ankle during gait: an examination of the relationship between lateral dominance and symmetry. Phys Ther 1989; 69:640-650 (medlins).
12. Wade DT, Hewer C, Wood VA, Stroke; Influence of patient‘s sex and side of weakness on outcome, Arch Phys Med Rehabil 1984; 65:513-6 13. Banerjee TK, Mukherjee CS, Sarkhel A. Stroke in the urban population of Calcutta: an epidemiological study. Neuroepidemiology 2001;20: 201–207
14. Dimitrijevic, M. R.; Faganel, J.; Sherwood, A.M.; and Mckay, W. B.: Activation of paralysed leg flexors and extensors during gait in patients after stroke. Scandinavian J. Rehab. Med. 1981; 13:109-115
15. Shiavi, R.; Bugle, H. J.; and Limbird, T.: Electromyographic gait assessment, part 1: adult EMG profiles and walking speed. J. Rehab. Res. and Devel 1987; 24:13-23
16. Shiavi, R.; Bugle, H. J.; and Limbird, T.: Electromyographic gait assessment, part2: preliminary assessment of hemiparetic synergy patterns. J. Rehab. Res. and Devel. 1987; 24:24-30
17. Wagenaar, R. C.; Meijer, O. G.; van Wieringen, P. C. W.; Kuik, D. J.; Hazenberg, G. J.; Lindeboom, J.; Wichers, F.; and Rijswijk, H.: The functional recovery of stroke: a comparison between neurodevelopmental treatment and the Brunnstrom method. Scandinavian J. Rehab. Med. 1990;22:1-8
18. Wall C. James, Bell Churan, Campbell Stewart; Davis Jennifer the Timed get-up and-go Test Revisited: measurement of the component tasks. J Rehabil Res January/February 2000; 37(1): 109-114.
19. Brunnstrom, S.: Movement Therapy in Hemiplegia: a Neurophysiological Approach. Hagerstown, Maryland, Harper and Row, 1970
20. Kaplan, P. E.: Hemiplegic: rehabilitation of the lower extremity. In Stroke Rehabilitation, pp. 119-146. Edited by P. E. Kaplan and L. J. Cerullo. Boston, Butterworth, 1986
21. Stevens, R. S.; Ambler, N. R.; and Warren, M. D.: A randomized controlled trial of a stroke rehabilitation ward. Age and Ageing 1984; 13:65-75
22. Lee MY, Wong MK, Tang FT, et al. Comparison of balance responses and motor patterns during sit-to-stand task with functional mobility in stroke patients. Am J Phys Med Rehabil 1997; 76: 401– 410.
23. Olney SJ, Richards C. Hemiparetic gait following stroke. Part I: Characteristics. Gait Posture 1996; 4: 136-148.
24. Brandstater ME, de Bruin H, Gowland C, Clark BM. Hemiplegic gait: analysis of temporal variables. Arch Phys Med Rehabil 1983; 64: 583-7.
25. Knutsson E, Richards C. Different types of disturbed motor control in gait of hemiplegic patients. Brain 1979; 102: 405-30.
26. Olney SJ, Griffin MP, McBride ID. Temporal, kinematic, and kinetic variables related to gait speed in subjects with hemiplegia: a regression approach. Phys Ther 1994; 74: 872-85.
27. Wade DT, Heller WA, Maggs J, Hewer RL. Walking after stroke. Scand J Rehabil Med 1987;19:25-30
28. Murray MP, Kory RC, Clarkson SB. Walking patterns in healthy old men. J Gerontol 1969; 24: 164-78
|
 IJCRR
IJCRR 


 This work is licensed under a Creative Commons Attribution-NonCommercial 4.0 International License


