IJCRR - 3(8), August, 2011
Pages: 71-78
Print Article
Download XML Download PDF
COMPARING THE EFFECT OF SOCIAL SKILLS TRAINING (APOLOGIZING-ANNOYANCE AND OPPRESSION AVOIDING) ON SELF-ASSERTION AND MENTAL HEALTH IN RETARDED STUDENTS
Author: Shohreh Ghorbanshiroudi, Javad Khalatbari, Khadijeh Rahbar Taromsari, Khadijeh Shourmeij, Mohammad Mojtaba Keikhayfarzaneh
Category: Healthcare
Abstract:The aim of the present study has been already comparing the effect of social skills training (apologizing;
annoyance and oppression avoiding) on self-assertion and psycho health in retarded students. The method
of this experimental research is to design a pretest and posttest doing with an experimental group and a
control one. The statistical population consists of the students studying in atypical schools in east part of
GILAN province that they were 140 students studying in two different cities that of course just one of the
cities selected, then the students was given 70 questionnaires titling as SHRING self-assertion and
GOLDBERGE mental health. Then 60 students were screened who had got the lowest marks and finally
45 people were grouped in 3 classes each holding 15. Two of them received the trainings in apologizing
and annoyance and oppression avoiding in 6 sessions each lasted for 45 minutes in workshop procedures
then all the three groups were tested. The collected data were analyzed to test the research hypothesis
using covariance analysis- statistical test. The results showed that: some social training in apologizing
was effective on self-assertion and mental health and it was different from disliking annoyance and
oppression.
Keywords: social skills training (apologizing; away from annoyance and oppression); selfassertion; mental health
Full Text:
INTRODUCTION
Nutritional status is an important determinant of growth. School age is a period of rapid growth with a growth spurt in pubertal years. 80 percent of adolescent growth is completed in early adolescence (10-15 years).During the last decade there have been numerous reports on the emerging problem of over-nutrition among affluent urban children and adolescents. Poor dietary habits combined with decreased physical activity have led to an increase in overweight and obesity among adults and children. Because of these changes in dietary and lifestyle pattern, chronic non communicable diseases are becoming increasingly significant causes of disability and premature death in both developing and newly developed countries( NNMB, 2001). Obesity has been noticed to be a powerful correlate of cardiovascular risk in comparison to hyperinsulinemia. And insulin resistance was strongly associated with obesity (Misra, 2009).Previous studies from US have shown that subclinical inflammation, elevated fasting insulin concentration and high systolic blood pressure are more common in overweight children (Dietz, 2001 and Pradhan et al., 2001).Hence indicating that early identification of these risk factors in children and adolescents can prevent the increasing risk of cardiovascular diseases and diabetes (type II) (Misra, 2009). Population based data on risk factors are still sparse in developing countries. In addition, the relationship of main modifiable cardiovascular risk factors with socioeconomic status (SES) is often unclear in these countries. Socioeconomic standard of people is conveniently expressed in terms of various social classes in which people are distributed which are referred to as social stratification. Social stratification is a horizontal division of society into several socio-economic layers: each layer or social class has a comparable standard of living, status and lifestyle .Several ways of measuring SES have been proposed, but most include quantification of family income, parental education and occupational status. Income determines the purchasing power of individuals and their socioeconomic status. Education determines the knowledge, attitude and value system of individuals and their socioeconomic growth potential. Occupation determines the income generating capacity of individuals and their status (Misra and Singh, 2003). In Kerala, the available data on the possible effect of socioeconomic status on the clustering of cardiovascular risk factors among children are limited. Cochin City has experienced rapid urbanization and industrialization in the past few decades. Therefore to address such an issue (effect of socioeconomic status on cardiovascular risk factors) in the forefront is important. Hence the purpose of the present study is to examine the distribution of cardiovascular risk factors namely anthropometric, biochemical and nutrient indices among school children (9-12 years) and its association with socioeconomic status based on Kuppuswamy scale (2008).
MATERIALS AND METHODS
The study population comprised 63 children in the age group 9-12 years from two urban schools in Cochin City. The subjects were selected by convenience sampling. Information was collected regarding the socioeconomic background, anthropometric parameters, biochemical measurements and nutrient intake pattern. Socioeconomic details collected include parental occupation ,education of head of the family and family monthly income. Based on socioeconomic data collected, Kuppuswamy‘s socioeconomic status scale, urban (revised as on June 2008) was used to classify the study population to different social classes. A weightage is assigned to each variable according to a seven point predefined scale. The total score in Kuppuswamy‘s classification is calculated as he sum of the total of the three scores. Depending on the total score so computed, the five socioeconomic classes are formulated. Anthropometric measurements used were height, weight, Body Mass Index(BMI), Mid Upper Arm Circumference (MUAC),waist and hip circumferences, Waist Hip Ratio (WHR) and Percent Body Fat(calculated using Deurenberg equation,1991). Biochemical measurements collected include Blood pressure, Insulin, Fasting blood sugar, Apolipoproteins A and B, Lipid profile and C-Reactive Protein. Blood pressure was measured using standardized sphygmomanometer and recorded by a trained nurse. Insulin assay was done by chemiluminescence method to reduce the chance of erroneous variables. Fasting blood sugar and lipid profile was measured using photometric method. The diagnostic procedure adopted to measure Apolipoproteins and CRP was immuno-turbidometric method as it is superior and more reliable. Biochemical measurements were done at Amrita Institute of Medical Sciences, Kochi. To assess the dietary intake and adequacy of the diet consumed, the 24-hour recall method of diet survey was adopted for three days including two working days and one holiday using the 24 hour recall questionnaire. In this method, the parents/caretakers reported the exact food intake of the subjects in precise quantities over the last 24 hours. Information was elicited regarding quantity, leftovers and method of preparation. Household cups and measures were used to define amounts in order to obtain accurate information as possible, regarding the type and amount of food and beverages consumed during the three days. These measures were later standardized in order to obtain precise nutrient intake among the subjects. Dietary data obtained from the three records were checked carefully and entered into the nutrition software system developed by Amritha Institute of Medical Sciences (AIMS), Kochi. Nutrient intakes were lculated using the standard portion sizes and a composite food database available from National Institute of Nutrition, Hyderabad. This database contains ICMR food composition tables for all foods. The fatty acid levels in foods were obtained from USDA National Nutrient Database for Standard Reference, Release 22 (US Department of Agriculture, Agricultural Research Institute Service, 2009) and Biochemical composition of Indian Fish (Central institute of Fisheries Technology, 1997). The same percentage of fats as recommended by USDA was applied to the ICMR fat reference values. Mean and standard deviation were used to describe continuous variables namely anthropometric, biochemical and nutrient intake parameters. Categorical variables are presented as frequency and percentage. Pearson‘s correlation coefficient was used to evaluate the association between two variables namely anthropometric and lipid parameters with 0.05 and 0.01 level of significance were considered. Statistical package SPSS version 11.0 for Windows was used for all statistical analysis.
RESULTS
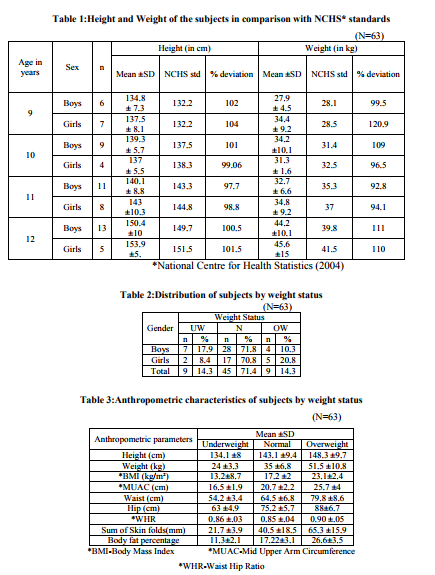
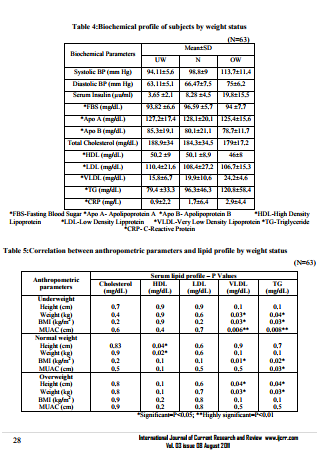
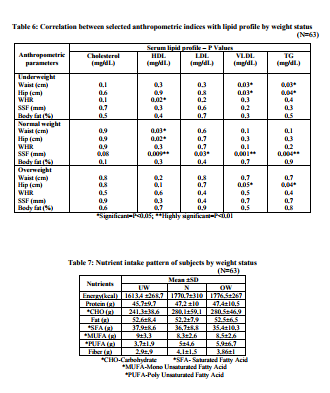
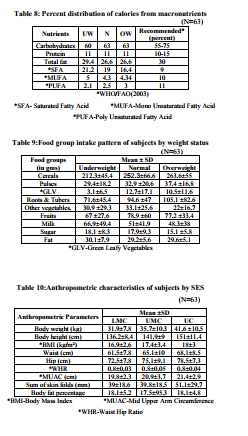
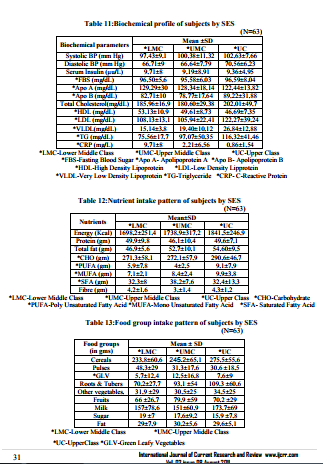
On comparison with NCHS standards (2004), overall the subjects were at par with the standards. The highest deficits for height and weight were observed in eleven year old subjects and an overall increase was seen in twelve year old subjects. [Table 1] On assessing the weight status of subjects, a vast majority (72 percent) of the subjects were normal, 14 percent each were found to be overweight and underweight. Gender based segregation of subjects revealed a higher prevalence of overweight among girls at 21 percent compared to boys at 10.3 percent. [Table 2] All anthropometric parameters namely height, weight, MUAC, waist, hip, WHR, sum of skin folds and body fat percent were found to steadily increase with increase in BMI percentiles in the subjects. [Table 3] On analyzing the biochemical profile of the subjects by weight status, the systolic and diastolic blood pressure were seen to be gradually escalating from underweight to overweight subjects, the increase being more evident for systolic blood pressure( increase of 20 mm Hg). Serum insulin, triglyceride and CReactive Protein levels also increased progressively from underweight to normal and overweight subjects. The overweight subjects recorded a CRP level of 2.98 mg/L which is associated with an increased risk of cardiovascular disease. [Table 4] Pearson‘s correlation analysis between anthropometric parameters and lipid profile showed that MUAC had a significantly high correlation with VLDL and triglyceride in underweight subjects. Weight, BMI, waist and hip circumferences also showed positive significant correlation with VLDL and triglyceride (p<0.05). Among normal weight subjects, height, weight, waist and hip circumferences correlated significantly (p<0.05) with HDL cholesterol and sum of skin fold thickness (p<0.01). BMI also correlated with VLDL and triglyceride (p<0.05) and sum of skin fold thickness (p<0.01). In overweight subjects, height, weight and hip circumference were observed to be significantly correlating with VLDL and triglyceride. [Tables 5 and 6] On studying the nutrient intake pattern of the subjects by their weight status, energy intake was seen to be gradually increasing from underweight to overweight subjects. A higher intake of SFA and MUFA was observed in underweight subjects, although PUFA intake was observed to be higher in overweight subjects. [Table 7] On analyzing the nutrient adequacy of the subjects by comparing with WHO/FAO (2003) standards, it was evident that macronutrient composition of the diet was well within the recommendations proposed. Contribution of SFA intake to the total calories was found to be high and PUFA and MUFA intake was seen to be low from the recommended intake. [Table 8] Overweight subjects consumed a diet rich in energy giving foods such as cereals, pulses and roots and tubers. The milk and sugar consumption was found to be higher among underweight subjects. Consumption of protective foods such as green leafy vegetables, other vegetables and fruits were higher in normal weight subjects. [Table 9] On studying the anthropometric data of the subjects by their socioeconomic status, height, weight MUAC, waist and hip circumference and sum of skin folds increased progressively with improvement in socioeconomic status, although body fat percent and waist hip ratio were found to be similar in all the three groups. [Table 10] On analyzing biochemical profile of subjects by socioeconomic status, the blood pressure escalated from lower middle class to upper class subjects but C-Reactive Protein showed a decreasing trend. HDL levels were found to be highest in lower middle class category while Cholesterol, LDL, VLDL and triglyceride levels were found to be higher in upper class category. [Table 11] Subjects belonging to upper socioeconomic class reported higher nutrient intake than their lower socioeconomic status counterparts. The lower middle class and upper class subjects did not show a significant difference in their SFA and fiber intake. [Table 12] From the table it is evident that upper class subjects shows higher cereal, roots and tuber, other vegetables and milk intake compared to lower middle class and upper class subjects. Pulses and sugar intake is found to be high in lower middle class subjects. The rest of the food groups namely green leafy vegetables, fruits and fat intake are high in upper middle class subjects. [Table 13]
DISCUSSION
In the present study, the prevalence rate of underweight and overweight was observed to be 14 percent. It has been reported in previous studies conducted in Ernakulam district that there are noticeable weight transitions in the pediatric cohort with a significant decline (eight percent) in underweight children and an escalation (one percent) of overweight children between 2003 and 2006 (Raj M et al., 2009). All the anthropometric parameters were seen to be increasing with increasing BMI percentiles in the subjects. A study conducted on the prevalence of obesity among affluent school children in Delhi reported that maximum prevalence of obesity was found during the pubertal period, between 10-12 years. This might be associated with the increase in adipose tissue and overall weight gain during pubertal growth spurt. (Kapil et al., 2002). Interestingly, blood pressure, serum insulin, triglyceride and C-Reactive Protein were observed to increase with increase in weight. Specifically, the C-Reactive Protein level (inflammatory marker) was observed to be 3mg/L in overweight subjects, which is largely proven to be a micro inflammatory state associated with increased risk of cardiovascular disease. In a study conducted to examine relationships between multiple markers of inflammation and children's weight status, Skinner et al., (2010) hypothesized that the prevalence of inflammatory markers would increase as weight status increased. Caloric intake was observed to be highest in the overweight subjects with a difference of 163 kcal from underweight subjects. The fiber intake pattern of the subjects by their weight status revealed a trend with the normal weight subjects consuming higher fibre and underweight subjects the least, explaining increased green leafy vegetable and fruit intake in this category. On classifying the subjects by their socioeconomic status based on Kuppuswamy scale, upper class subjects showed higher anthropometric measures than lower middle class subjects in the present study. The present results are in agreement with those reported earlier in a study conducted in Delhi on the growth parameters and prevalence of overweight and obesity in school children where it was found that children from upper SES were significantly taller and heavier and consequently, had a significantly higher BMI as compared to their age matched counterparts from lower SES (Gupta et al., 2007). While blood pressure was observed to have direct positive relationship with socioeconomic status, C-Reactive Protein showed a decreasing trend. In a study conducted in Bolivia among 2- 15 year olds, low household economic resources were associated with greater CRP levels (Mc Dade et al., 2005). The serum lipid profile of subjects by socioeconomic status showed increased HDL levels in lower middle class category while the rest of the parameters were observed to be highest in upper class subjects.The energy, carbohydrate and fat intake increased progressively from low to high socioeconomic status. In a study conducted in turkey among school going children, higher SES subjects reported higher energy, carbohydrate and fat intake than their lower SES peers (Manios et al., 2004).
CONCLUSION
In conclusion, in the present study, the magnitude of underweight and overweight was observed to be high among children and the cardiovascular risk factor profile are higher among overweight subjects compared to their normal weight counterparts. The upper socioeconomic subjects are at an increased cardiovascular risk than lower socioeconomic peers revealing that socioeconomic status also plays a significant role in the clustering of cardiovascular risk factors among children. High standard of living, changing lifestyles and poor dietary habits combined with decreased physical activity among school going children have resulted in overnutrition to emerge as a modern day epidemic and subsequently increasing the risk of cardiovascular diseases later in their life. This calls for an immediate action in reducing the prevalence of overnutrition among school going children through appropriate nutrition intervention programs. More indepth study on the factors associated with cardiovascular risk in children need to be also undertaken. ACKNOWLEDGEMENTS We thank Amrita Institute of Medical Sciences for their complete support and guidance throughout the study. We also thank heads of the institutions, parents and students for their support in conducting the study.
References:
REFERENCES
1. Dietz WH (2001), `Overweight and precursors of type 2 diabetes mellitus in children and adolescents‘, Journal of Pediatrics, Vol 138, Pp 453-4
2. Deurenberg P., Weststrate JA., Seidell JC.,(1991), ? Body mass index as a measure of body fatness- age and sex specific prediction formulas‘, Br J Nutr, Vol 65, Pp 105-14
3. Gupta AK., Rastogi S., Panwa R., (2007), ?Growth parameters and prevalence of overweight and obesity in school going children‘, Pediatrics, Vol 97, Pp 257-261
4. Kapil U., Singh P., Pathak P., Dwivedi SN., Bhasin S.,(2002),?Prevalence of obesity amongst affluent adolescent school children in Delhi‘, Indian Pediatr, Vol 39, Pp 449- 452
5. Kuppuswamy B(2008), ?Manual of Socioeconomic Status (urban)‘, Manasayan, Delhi
6. Manios Y., Dimitriou M.I., Moschonis G., Kocaoglu B., Sur H., Keskin Y. and Hayran O. (2004), ?Cardiovascular disease risk factors among children of different socioeconomic status in Istanbul, Turkey: Directions for Public health and Nutrition policy‘, Lipids in Health and Disease, Vol 3, Pp 11-17
7. McDade TW., Leonard WR., Burhop J., Reyes-Garcia C., Vadez V., Huanca T., Godoy RA., (2009), ?Predictors of CReactive Protein in Tsimane‘ 2 to 15 YearOlds in Lowland Bolivia‘, American Journal of Physical Anthropology, Vol 128, Pp 906- 913
8. Misra A (2009), ?Nutrition and Physical Performance in School Age Children‘, Nutrition Foundation of India
9. Misra A and Singh HP (2003), ?Kuppuswamy‘s socioeconomic status scale – A Revision‘, Indian Journal of Pediatrics, Vol 70(3), Pp 273-274
10. NNMB (2001), `Early School Years and Adolescence‘, Pp 228-240
11. Raj M., Sundaram KR., Paul M., Deepa AS., Kumar RK., (2007), ?Obesity in Indian Children: Time trends and relationships with hypertension‘ , Natl Med journal of India, Vol 20, Pp 288-293
12. Skinner CA., Steiner JM., Henderson WF., Perrin ME., (2010), ?Multiple markers of inflammation and weight status: Cross sectional Analyses throughout childhood‘,Pediatrics
|
 IJCRR
IJCRR 


 This work is licensed under a Creative Commons Attribution-NonCommercial 4.0 International License


