IJCRR - 3(9), September, 2011
Pages: 62-65
Print Article
Download XML Download PDF
MALNUTRITION AMONG INFANTS BASED ON INTEGRATED CHILD DEVELOPMENT SERVICES AND
NEW WHO GROWTH CHART
Author: Muralidhar M.K, Hemagiri K, VinodKumar C.S., Rajashri S Patil
Category: Healthcare
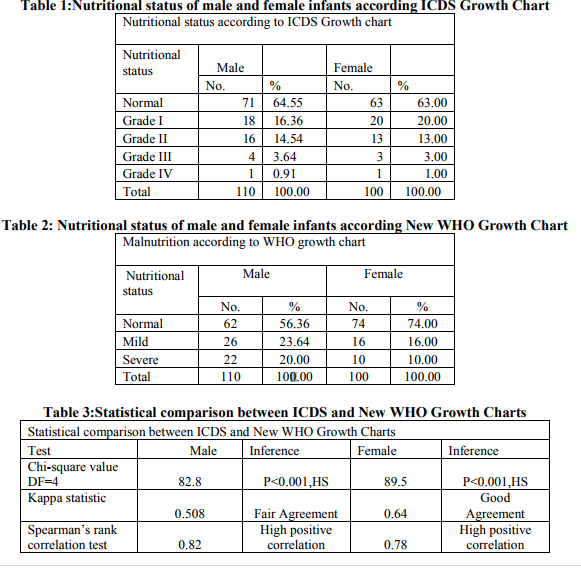
Abstract:Malnutrition continues to be a Public health problem in India despite the self-sufficiency in production of food grains in addition to adequate buffer stocks. Nearly half of the under five children are underweight. Though the famines and florid forms of malnutrition have almost disappeared yet in some states/ regions the onslaught of severe malnutrition is unacceptably high. The objective of the study is to study the prevalence of malnutrition in infants attending Urban Health Training Centre and to determine the difference in prevalence based on the Integrated Child development Scheme (ICDS) and New World Health Organisation (WHO) growth charts. All the infants attending the OPD of Urban Health Training Centre, Bashanagara, Davangere were enrolled for the study. Measurement of weight was done by infant weighing scale and recorded to the nearest 50 grams. This was compared with the standard growth charts and nutritional status was ascertained. A total of 210 infants were included for the study after obtaining the consent of their parents. Among 210 infants attending the OPD from 1-1-2008 to 31-12-2008 were enrolled for the study, 110 (52.38%) were males and 100(47.62%) were females. The prevalence of mild(Grade I and II) and severe(Grade III and IV) undernutrition among male infants according to ICDS
growth chart is 30.9% and 4.6% while in female infants it is 33.0% and 4.0% respectively. The prevalence of mild and severe undernutrition among male infants according to New WHO growth chart is 23.6% and 20.0% while in female infants it is 16.0 % and 10.0% respectively. There were no overweight/obese infants in our study. There is a significant difference in the prevalence of undernutrition according to the two growth charts. The number of severely malnourished infants is bound to increase with the use of the New WHO Growth Chart.
Keywords: Malnutrition, Infants, ICDS and New WHO growth charts
Full Text:
INTRODUCTION
Severe malnutrition may act as a direct cause of death or an indirect cause by increasing dramatically the case fatality in children suffering from common childhood illnesses, such as, diarrhoea and pneumonia. Current estimates suggest that severely malnourished children have a 10 to 20 times higher risk of dying than well nourished children1 . Eighty percent of the world's undernourished children live in 20 countries, with India being home to nearly 60 million children who are underweight.1,2 The National Family Health Survey (NFHS) in India reported the prevalence of underweight among children younger than 3 years in 2005-2006 to be nearly 46%, a figure representing only a marginal decline from the rates recorded in 1992-1993 (51%) and 1998- 1999 (47%) Three quarters of the children who die world wide of causes related to malnutrition are described by nutritionists as mildly to moderately malnourished and thus betray outward signs of problem to a casual observer. Although there is a decline in the magnitude of this condition over years, it is not to the expected levels. Over nutrition in the form of overweight and obesity is being observed in some urban and semi-urban areas. As per the Millenium development goal 1, which aims to eradicate extreme poverty and hunger the target is to halve the proportion of people who suffer from hunger. The indicator to assess this goal is the prevalence of underweight among infants and children.1 In our country growth charts are used to assess the nutritional status of children. But, due to the adaption of new WHO Growth Charts for monitoring the growth, there is going to be a change in the prevalence of malnutrition.2 The present study was undertaken in order to study the prevalence of malnutrition among infants and the difference between the previously used ICDS growth chart and the New WHO Growth chart.
Objectives:
1 To assess the prevalence of malnutrition in infants.
2 To study the difference in prevalence based on the ICDS and New WHO growth charts
MATERIALS AND METHODS
All the infants attending the OPD were enrolled for the study after obtaining the consent of their parents. A register was maintained and an infant was considered for the study only once. Age was recorded to the nearest completed months after verifying from birth certificates, anganwadi registers and by correlating to the nearby special events. Weight was measured meticulously with all standard procedures by using an infant weighing scale and recorded to the nearest 50 grams.3 The noted weight for age was compared with the ICDS and New WHO growth charts and nutritional status was ascertained and noted accordingly.4, 5 In both the growth Charts X- axis represents the age and y-axis represents the weight. In ICDS Growth Chart the top most curve corresponds to 80% of the median of the WHO reference standard. The lower lines represent 70%, 60% and 50% of that standard.6 The new WHO growth chart standards describe normal child growth from birth to 5 years under optimal environmental conditions and can be applied to all children everywhere, regardless of ethnicity, socioeconomic status and type of feeding. According to this chart, malnutrition is classified as mild and severe undernutrition, when weights for age values are less than -2 SD and -3 SD of the reference median respectively. 5 Study duration: Jan 2008 to Dec 2008(1 year). Statistical tests: The descriptive statistics is presented by mean, standard deviation and percentages. Analysis was done by Chi-square test, Kappa statistics and Spearman‘s Rho.
RESULTS
Among 210 infants, 110 (52.38%) were males and 100(47.62%) were females. Only 4.76% were Hindus and the rest (95.24%) were Muslims. The mean age for male and female infants was 4.9 ± 3.7 months and 5.1 ± 3.5 months respectively. The mean weight was 5.46 ± 1.74 kgs and 5.58 ± 1.74 kgs for male and female infants respectively. The weight was higher among female infants but was not statistically significant (P=0.61 NS). The prevalence of mild and severe undernutrition among male infants is more while the percentage of female undernourished infants is lesser as per new WHO growth chart in comparison to ICDS Growth chart. However, severe degree of malnutrition is higher in female infants as per the new WHO growth chart compared to the ICDS Growth Chart. Chi-square test value shows highly significant difference(X2 = 82.8 and 89.5 p< 0.001) between the prevalence of malnutrition among female infants being higher according to the new WHO growth chart than the ICDS Growth chart. The kappa statistic shows fair agreement among the two growth charts indicating moderate overlap while some difference does persist. As depicted in Table no.1 and 2 severe degree undernutrition is missed by the widely used ICDS growth charts. The Spearman‘s rho shows positive correlation as depicted in Table No. 3, which implies that both the growth charts measure the degree of malnutrition in a similar direction, but significant difference exists as depicted by the Chi-square test and the Kappa statistic.
DISCUSSION
The prevalence of undernutrition in our study is similar to the National Family Health Survey (NFHS) III results.7 In a comparative study done in three countries namely Peru, India and Vietnam using the new WHO Growth Chart and the NCHS Growth Chart differences in prevalence of wasting, stunting, and underweight were observed and the direction and magnitude of difference were not consistent.8 In the Malawian study there is a difference in the prevalence of malnutrition as per the NCHS and New WHO Growth Chart, which is similar to that observed in our study .9 In a multi centric comparison study conducted among healthy breast-fed infants in Bangladesh, Dominican Republic and a pooled sample from North America and Northern Europe, WHO standards are observed to be a better tool than NCHS standards for growth monitoring .10 In a study done to compare IAP and new WHO growth standards, lower prevalence of overall underweight children was observed and provided superior growth tracking than IAP standards, especially in the first 6 months of life and among severely malnourished children.11
CONCLUSION
The prevalence of malnutrition is higher in this area in comparison to studies done in other parts of the world. 9-10 The type of growth chart used is bound to have significant impact on the prevalence of malnutrition among infants. The ICDS growth chart has a common growth chart for male and female children despite the well known fact that the growth pattern among males and females differ.3 The new WHO growth chart has two different charts which is more appropriate in tracking the growth of male and female children. 5 The recommendations of the present study is the type of growth chart used is bound to have significant impact on the prevalence of malnutrition among infants. As there could be an increase in the number of severely undernourished children, provision should be made in the programme to tackle the same.
References:
1. World health report, World health organization, shaping the future. 2003.
2. International Institute of Population Sciences. National Family Health Survey – 1. Mumbai: IIPS, ORC Macro; 1993.
3. Meharban Singh, pediatric clinical methods, New Delhi, Sagar publications, 2005.
4. Ghosh S. Integrated Child Development services programme - need for reappraisal. Indian Pediatr 1997; 34: 911- 918
5. Gragnolati M, Bredenkamp C, Gupta MD, Lee YK, Shekhar M. ICDS and persisting undernutrition. Econ Polit Wkly 2006; 41: 1193-201. K.Park Text Book of Preventive and Social Medicine,Jabalpur, India: Banarsidas Bhanot Publishers , 20th edition 2009 , pp-423-25.
6. Planning Commission Government of India. Population projections 2001-2025. New Delhi: Government of India; 2006
7. Fenn B, Penny ME. Using the new World Health Organisation growth standards: differences from 3 countries. J Pediatr Gastroenterol Nutrition. 2008 Mar; 46 (3) : 316-21.
9. Prost MA, Jahn A, Floyd S, Mvula H, Mwaiyeghele E, Mwinuka V et al, Implication of new WHO growth standards on identification of risk factors and estimated prevalence of malnutrition in rural Malawian infants. Public Library of Science One. 2008 Jul 16;3(7):e2684.
10. de Onis M, Onyango AW, Borghi E, Garza C, Yang H; Comparison of the World Health Organization (WHO) Child Growth Standards and the National Center for Health Statistics/WHO international growth reference: implications for child health programmes. Public Health Nutrition. 2006 Oct;9(7):942-7.
11. Prinja S, Thakur JS, Bhatia SS. Pilot testing of WHO child growth standards in Chandigarh: implications for India's child health programmes: Bulletin of World Health Organisation. 2009 Feb;87(2):116- 22.
|
 IJCRR
IJCRR 


 This work is licensed under a Creative Commons Attribution-NonCommercial 4.0 International License


