IJCRR - 4(18), September, 2012
Pages: 129-132
Date of Publication: 29-Sep-2012
Print Article
Download XML Download PDF
CORRELATION BETWEEN THE GLOBAL RADIATION AND SOLAR INDICES
Author: Sumathi.R, Samuel Selvaraj.R
Category: General Sciences
Abstract:The relationship between Global radiation on a horizontal surface at Chennai and solar indices(smoothed sunspot number,10.7cm solar flux, aa index and sunspot area) are individually analyzed in this paper. Analysis has been done for the period from 2008-2010. The method used for the analysis has been Least square regression method. The relationship revealed that the Global radiation correlates negatively with the solar indices.
Full Text:
INTRODUCTION
Global solar radiation is an important parameter necessary for most ecological models and serves as an input for different photovoltaic conversion system, which is of greater Economic importance for renewable energy alternation. The solar radiation reaching the Earth?s surface depends on the climatic conditions of the specific site location. The sun is a constant energy source and is known for its cyclic behavior. Solar radiation output changes periodically and it affects the Earth and its atmosphere different ways , such as the formation of aurora, adverse effects on the satellite communications. Various indicators for the sunclimate connection such as sunspot numbers(Chambers,1878)[1],Solar cycle length(Friis-Chrislensen and Lassen.1991)[2] , Geomagnetic aa indexes(Cliver and Borier Koff,1998)[3] and Solar irradiance changes (Floyd et.al 2001)[4] have been reviewed in past literature. Recently Samuel selvaraj et.al 2011[5] have done research on the variation of Chennai global radiation due to sunspot number. W.E.Alnaser et.al(1991) developed a correlation study between Global radiation and sunspot number.[6] Earth receives a total amount of radiation by its cross section (π·RE²), but as it rotates this energy is distributed across the entire surface area (4·π·RE²). Hence the average incoming solar radiation (called the solar irradiance), taking into account the angle at which the rays strike and that at any one moment half the planet does not receive any solar radiation, is onefourth the solar constant (approx 342 W/m²). At any given moment, the amount of Solar radiation received at a location on the Earth's surface depends[10] on the conditions of the atmosphere and the latitude of the location. This Solar Irradiance hits the surface of the earth in two forms, beam (Gb) and diffuse (Gd). The beam component comes directly as irradiance from the sun[11,12], while the diffuse component reaches the earth indirectly and is scattered or reflected from the atmosphere or cloud cover.The total irradiance on a surface is G = GB + Gd Sunspots are temporary on the photosphere of the sun that appear visibly as dark spots compared to surrounding regions. The F 10.7 index is a measure of the solar radio flux per unit frequency at wavelength of 10,7cm, near the peak of the observed solar radio emission. The aa index is a measure of the disturbance level of the Earth?s magnetic field based on magnetometer observations at two nearly antipodal stations. The daily sunspot area is the measure of the area of solar surface covered by spots (in the sunspot area unit namely ppm of solar hemisphere) in an observational day. The monthly average of the daily sunspot area usually bears information of long term variations of solar activity.[7,8] As the number of spots increases the total area of the spots naturally increases and their magnetic complexity usually grows as well. The objective of the work is to look for individual correlation between the monthly averaged daily global radiation on a horizontal surface at Chennai with solar indices like sunspot number .10.7cm solar flux , aa index and sunspot area . Method of least squares is used to find out the Mean Bias Error , Root Mean Square Error and Mean Average Percentage Error.
DATA ANALYSIS AND METHODOLOGY
The local climate was analysed using the following data. The monthly average daily global radiation on a horizontal surface for Chennai for 30 months(July2008 to December2010) were obtained from the Indian Metrological Department, Pune. The solar indices data were taken from the site ftp://Ftp.ngdc.noaa.gov/STP/SOLAR_DATA.

The concept of „correlation? is a statistical tool which studies the relationship between two variables. “Regression analysis is a mathematical measure of the average relationship between two or more variables in terms of the original units of the data.”Regression analysis, in general sense, means the estimation or prediction of the unknown value of one variable from the known value of the other variable. For this study, correlation coefficients are calculated to analyze the statistical relationship between global radiation and solar indices like sunspot number,10.7cm solar flux, aa index and

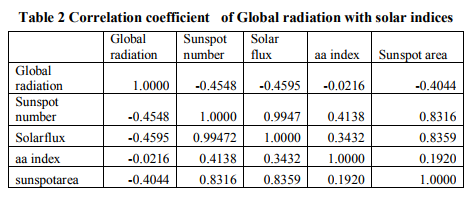
sunspot area. Correlation coefficient for global radiation with solar indices have been found individually for every index. Table 2 shows the comparison of the correlation coefficient of Global radiation with the sunspot number,10.7cm solar flux, aa index and sunspot area Sunspot number,10,7cm Solar flux,sunspot area are negative correlation with the Global radiation,but aa index show no significant correlation with the Global radiation. After performing all the Regression techniques to study the correlation between global radiation and the solar indices, it was found that the linear model works with least error. The linear regression equation for solar indices are Y=aX + b Where Y-Global radiation, X-Solar indices, and a,b-regression coefficients obtained by fitting measured data. The following statistical errors are used to test the performance of model.[9] Mean Bias Error is defined as MBE=(1/N)∑(Hcomputed –Hmeasured) Where N denotes total number of observations. This test provides an information on the long term performance. A low MBE is desired. Ideally a zero value of MBE should be obtained. A positive value gives the average amount of over-estimation in the calculated value or vice versa. One draw back of this test is that over estimation of an individual?s observation will cancel under estimation in a separate observation. Root Mean Square Error is defined as RMSE={[∑(Hcomputed - Hmeasured)2]/N}1/2 Root mean Square Error is always positive, a zero value is ideal. This test provides information on the short term performance of the models by allowing a term by term comparison of the actual deviation between the calculated value and the measured value. Mean percentage error is defined as MPE=[∑(Hmeasured – Hcomputed/Hmeasured) X 100]/N

RESULT AND CONCLUSION
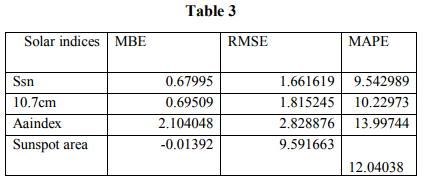
The monthly average daily global radiation by the linear model have been compared with solar indices . The present study shows that linear model between global radiation and sunspot number can result in low error level. MPE is 9.54298, RMSE is 1.661619 and MBE is 0.67995,followed by the 10.7solar flux MPE 10.22973 ,RMSE 1.815245, MBE 0.69509 ,then aa index MPE 13.99744, RMSE 2.828876, MBE 2.104048 and the sunspot area MPE 12.04038 RMSE 9.591663 MBE -0.01392. So sunspot number is more correlated with Global radiation as there is least error in comparison to other indices.
References:
1. Chambers,F.,(1878),?Sunspots and Weather?, Nature 18, p.567-568.
2. Friis-christensen,K.Lassen(1991)?Length of solar cycle: An indicator of solar activity closely associated with climate? Science Vol.254,p.698-700.
3. Cliver EM.Boriakoff V.,Feynman,J.,(1998),;Solar variability and climate change: Geomagnetic aa index and global surface temperature? Geophysical Research Letter Vol.25,P.1035-1038.
4. Floyd.L.D.,Prinz,P.C.Crane,and L.C.Herring(2001),?Total solar and spectral irradiance Variations from solar cycles 21 to 23? Advanced Space Research in press.
5. Samuel Selvaraj.R and Sivamadhavi.V(2011),?Solar insolation at Chennai during the 23rd Solar cycle? Universal Journal of Environmental Research and Technology,Vol3,381-384.
6. Alnaser,W.E.,and M.J.Alothman(1991)?Studies of the correlation between the Global radiation, Ultraviolet Radiation ,Cosmic Radiation,Sunspotnumber and Meteorological Parameters?Astrophysics and space science,Vol.186,P.191-203.
7. A.P.Sarychev and E.M Rosh china,?Total sunspot area as a Solar activity index? Solar System Research,Vol.40,No.6 521-526 (2006).
8. Yu.A. Nagovitsyn „To the description of longterm variations in the solar magnetic flux; The sunspot area index? Springer link,Astronomy letter Vol.31,No.8 557-562(2005).
9. M.Sekae,M.Sakthivel,s.Satheesh Kumar,C,Ramesh(2012),?Estimation of Global Solar Radiation for chennai?,European Journal of Scientific Research?,Vol.73,P.415-424.
10. Smart,W.M. (1980),Text book on Spherical Astronomy(6th edition),Cambridge University press,Cambridge,P-69.
11. Alam,M.S.,Saha,S.K.,Chowdhury,M.A.K.,Saif uzzaman and Rahman,M.,(2005), ?Simulation of solar radiation system? American.Journal ofApplied science 2(4),P.751-58
12. Badescu,V.,(1999),?Correlations to estimate monthly mean daily solar global irradiation Application to Romania?,Energy 24 ,P.883- 893.
|


 This work is licensed under a Creative Commons Attribution-NonCommercial 4.0 International License