IJCRR - 4(2), January, 2012
Pages: 91-101
Print Article
Download XML Download PDF
AN EFFECTIVE CLUSTERING ALGORITHM FOR THE ANALYSIS OF BREAST CANCER DATA SETS USING
PRINCIPAL COMPONENT ANALYSIS
Author: D.Napoleon, M.Praneesh, S.Sathya, M.Siva Subramanian
Category: Technology
Abstract:Clustering is the process of finding groups of objects such that the objects in a group will be similar to one another and different from the objects in other groups. Dimensionality reduction is the transformation of high-dimensional data into a meaningful representation of reduced dimensionality that corresponds to the intrinsic dimensionality of the data. K-Medoids algorithm for cluster analysis is developed for low dimensional data, often does not work well for high dimensional data like microarray gene expression data and the results may not be accurate in most of the time due to noise and outliers associated with original data. Principal component analysis (PCA) is the best mean-square error sense, and linear dimension reduction technique, is being based on the covariance matrix of the variables, it is a secondorder method. The resulting reduced data set obtained from the application of PCA will be applied to a KMedoids
clustering algorithm. A new method to find the initial Medoids makes the algorithm more effective and efficient. This paper shows Amalgamation K-Medoids efficiency is better than K-Medoids.
Keywords: Dimensional reduction, K-Medoids Clustering, Amalgamation K-Medoids clustering algorithm, Principal component analysis.
Full Text:
1. INTRODUCTION Data Mining refers to the mining or discovery of new information in terms of patterns or rules from vast amounts of data. Data mining is a process that takes data as input and outputs knowledge. One of the earliest and most cited definitions of the data mining process, which highlights some of its distinctive characteristics, is provided by Fayyad, Piatetsky-Shapiro and Smyth (1996), who define it as ?the nontrivial process of identifying valid, novel, potentially useful, and ultimately understandable patterns in data.?Some popular and widely used data mining clustering techniques such as hierarchical, k-means and K-Medoids clustering techniques are statistical techniques and can be applied on high dimensional datasets [2]. A good survey on clustering methods is found in Xu et al. (2005).High dimensional data are often transformed into lower dimensional data via the principal component analysis (PCA)(Jolliffe, 2002) (or singular value decomposition) where coherent patterns can be detected more clearly [4]. Such unsupervised dimension reduction is used in very broad areas such as meteorology, image processing, genomic analysis, and information retrieval [3]. Dimension reduction is the process of reducing the number of random variables under consideration, and can be divided into feature selection and feature extraction [1]. As dimensionality increases, query performance in the index structures degrades. Dimensionality reduction algorithms are the only known solution that supports scalable object retrieval and satisfies precision of query results [14]. Feature transforms the data in the high-dimensional space to a space of fewer dimensions [3].The data transformation may be linear, as in principal component analysis (PCA), but any nonlinear dimensionality reduction techniques also exist [9]. In general, handling high dimensional data using clustering techniques obviously a difficult task in terms of higher number of variables involved. In order to improve the efficiency the noisy and outlier data may be removed and minimize the execution time, we have to reduce the no. of variables in the original data set. To do so, we can choose dimensionality reduction methods such as principal component analysis (PCA), Singular value decomposition (SVD), and factor analysis (FA). Among this, PCA is preferred to our analysis and the results of PCA are applied to a popular model based clustering technique [6]. Principal component analysis (PCA) is a widely used statistical technique for unsupervised dimension reduction. K-means clustering is a commonly used data clustering for unsupervised learning tasks[15]. Here we prove that principal components are the continuous solutions to the discrete cluster membership indicators for Kmeans clustering [7].The main linear technique for dimensionality reduction, principal component analysis, performs a linear mapping of the data to a lower dimensional space in such a way, that the variance of the data in the lowdimensional representation is maximized. In practice, the correlation matrix of the data is constructed and the eigenvectors on this matrix are computed. The eigenvectors that correspond to the largest eigenvalues (the principal components) can now be used to reconstruct a large fraction of the variance of the original data. Moreover, the first few eigenvectors can often be interpreted in terms of the large-scale physical behavior of the system. The original space (with dimension of the number of points) has been reduced (with data loss, but hopefully retaining the most important variance) to the space spanned by a few eigenvectors. Many applications need to use unsupervised techniques where there is no previous knowledge about patterns inside samples and its grouping, so clustering can be useful. Clustering is grouping samples base on their similarity as samples in different groups should be dissimilar. Both similarity and dissimilarity need to be elucidated in clear way. High dimensionality is one of the major causes in data complexity. Technology makes it possible to automatically obtain a huge amount of measurements. However, they often do not precisely identify the relevance of the measured features to the specific phenomena of interest. Data observations with thousands of features or more are now common, such as profiles clustering in recommender systems, personality similarity, genomic data, financial data, web document data and sensor data. However, high-dimensional data poses different challenges for clustering algorithms that require specialized solutions. Recently, some researchers have given solutions on highdimensional problem. Our main objective is proposing a framework to combine relational definition of clustering with dimension reduction method to overcome aforesaid difficulties and improving efficiency and accuracy in KMedoids algorithm to apply in high dimensional datasets. K-Medoids clustering algorithm is applied to reduced datasets which is done by principal component analysis dimension reduction method.
2.1 Clustering Cluster analysis is one of the major data analysis methods widely used for many practical applications in emerging areas[17].Clustering is the process of finding groups of objects such that the objects in a group will be similar (or related) to one another and different from (or unrelated to) the objects in other groups. A good clustering method will produce high quality clusters with high intra-cluster similarity and low inter-cluster similarity [8]. The quality of a clustering result depends on both the similarity measure used by the method and its implementation and also by its ability to discover some or all of the hidden patterns [16].
2.2 K-MEDOIDS CLUSTERING
Clustering is the process of grouping a set of objects into classes or clusters so that objects within a cluster have similarity in comparison to one another, but are dissimilar to objects in other clusters (Han et al 2001). K-means clustering (MacQueen, 1967) and Partitioning Around Medoids (PAM) (Kaufman and Rousseeuw, 1990) are well known techniques for performing non- hierarchical clustering[12].Unfortunately, K-means clustering is sensitive to the outliers and a set of objects closest to a centroid may be empty, in which case centroids cannot be updated. For this reason, K-Medoids clustering are sometimes used, where representative objects called Medoids are considered instead of centroids.[18] Because it uses the most centrally located object in a cluster, it is less sensitive to outliers compared with the K-means clustering. Among many algorithms for K-Medoids clustering, Partitioning Around Medoids (PAM) proposed by Kaufman and Rousseeuw (1990) is known to be most powerful[11]. However, PAM also has a drawback that it works inefficiently for large data sets due to its complexity (Han et al, 2001). This is main motivation of this paper.
We are interested in developing a new KMedoids clustering method that should be fast and efficient[5]. It is more robust to noise and outliers as compared to k-means because it minimizes a sum of dissimilarities instead of a sum of squared Euclidean distances.A Medoids can be defined as the object of a cluster, whose average dissimilarity to all the objects in the cluster is minimal i.e. it is a most centrally located point in the given data set. The K-Medoids algorithm is a clustering algorithm related to the kmeans algorithm and the Medoidshift algorithm. Both the k-means and K-Medoids algorithms are partitional (breaking the dataset up into groups) and both attempt to minimize squared error, the distance between points labeled to be in a cluster and a point designated as the center of that cluster. In contrast to the k-means algorithm, KMedoids chooses datapoints as centers The most common realisation of k-Medoids clustering is the Partitioning Around Medoids (PAM) algorithm and is as follows:
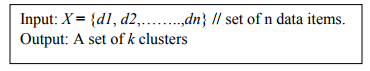
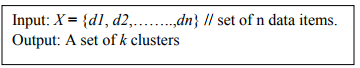
Steps: 1. Initialize: randomly select k of the n data points as the Medoids 2. Associate each data point to the closest Medoids. ("closest" here is defined using any valid distance metrics) 3. For each Medoids m 1. For each non-Medoids data point o 2. Swap m and o and compute the total cost of the configuration 4. Select the configuration with the lowest cost. 5. Repeat steps 2 to 5 until there is no change in the Medoids.
2.3 PRINCIPAL COMPONENTS ANALYSIS
Principal component analysis (PCA) involves a mathematical procedure that transforms a number of possibly correlated variables into a smaller number of uncorrelated variables called principal components. The first principal component accounts for as much of the variability in the data as possible, and each succeeding component accounts for as much of the remaining variability as possible. Depending on the field of application, it is also named the discrete KarhunenLoève transform (KLT), the Hostelling transform or proper orthogonal decomposition (POD).PCA was invented in 1901 by Karl Pearson.[1] Now it is mostly used as a tool in exploratory data analysis and for making predictive models. PCA involves the calculation of the eigen value decomposition of a data covariance matrix or singular value decomposition of a data matrix, usually after mean centering the data for each attribute. The results of a PCA are usually discussed in terms of component scores and loadings (Shaw, 2003). PCA is the simplest of the true eigenvectorbased multivariate analyses [13]. Often, its operation can be thought of as revealing the internal structure of the data in a way which best explains the variance in the data. If a multivariate dataset is visualized as a set of coordinates in a high-dimensional data space (1 axis per variable), PCA supplies the user with a lower-dimensional picture, a "shadow" of this object when viewed from its (in some sense) most informative viewpoint.PCA is closely related to factor analysis; indeed, some statistical packages deliberately conflate the two techniques. True factor analysis makes different assumptions about the underlying structure and solves eigenvectors of a slightly different matrix .
2.4 PRINCIPAL COMPONENTS (PCS) Technically, a principal component can be defined as a linear combination of optimally weighted observed variables which maximize the variance of the linear combination and which have zero covariance with the previous PCs. The first component extracted in a principal component analysis accounts for a maximal amount of total variance in the observed variables. The second component extracted will account for a maximal amount of variance in the data set that was not accounted for by the first component and it will be uncorrelated with the first component. The remaining components that are extracted in the analysis display the same two characteristics: each component accounts for a maximal amount of variance in the observed variables that was not accounted for by the preceding components, and is uncorrelated with all of the preceding components. When the principal component analysis will complete, the resulting components will display varying degrees of correlation with the observed variables, but are completely uncorrelated with one another. PCs are calculated using the Eigen value decomposition of a data covariance matrix/ correlation matrix or singular value decomposition of a data matrix, usually after mean centering the data for each attribute. Covariance matrix is preferred when the variances of variables are very high compared to correlation. It would be better to choose the type of correlation when the variables are of different types. Similarly the SVD method is used for numerical accuracy [10].After finding principal components reduced dataset is applied to KMedoids clustering with computed Medoids.
3. DATASET DESCRIPTION Experiments are conducted on a breast cancer data set which data is gathered from uci web site. This web site is for finding suitable partners who are very similar from point of personality‘sview for a person. Based on 8 pages of psychiatric questions personality of people for different aspects is extracted. Each group of questions is related to one dimension of personality. To trust of user some questions is considered and caused reliability of answers are increased. Data are organized in a table with 90 columns for attributes of people and 704 rows which are for samples. There are missing values in this table because some questions have not been answered, so we replaced them with 0. On the other hand we need to calculate length of each vector base on its dimensions for further process. All attributes value in this table is ordinal and we arranged them with value from 1 to 5, therefore normalizing has not been done. There is not any correlation among attributes and it concretes an orthogonal space for using Euclidean distance. All samples are included same number of attributes.
4. RESULTS 4.1 EXPERIMENTAL SETUP In all experiments we use MATLAB software as a powerful tool to compute clusters and windows XP with Pentium 2.1 GHZ. Reduced datasets done by principal component analysis reduction method is applied to kmeans clustering. As a similarity metric, Euclidean distance has been used in kmeans algorithm.The steps of the Amalgamation of K-Medoids clustering algorithm are as follows.
Phase-1: Apply PCA to reduce the dimension of the breast cancer data set
1. Organize the dataset in a matrix X.
2. Normalize the data set using Z-score.
3. Calculate the singular value decomposition of the data matrix. X
4. Calculate the variance using the diagonal elements of D.
5. Sort variances in decreasing order.
6. Choose the p principal components from V with largest variances.
7. Form the transformation matrix W consisting of those p PCs.
8. Find the reduced projected dataset Y in a new coordinate axis by applying W to X.
Phase-2 : Find the initial Medoids
1. For a data set with dimensionality, d, compute the variance of data in each dimension(column).
2. Find the column with maximum variance and call it as max and sort it in any order.
3. .Divide the data points of cvmax into K subsets, where K is the desired number of clusters.
4. Find the median of each subset.
5. Use the corresponding data points (vectors) for 6. each median to initialize the cluster centers.
Phase-3: Apply the K-Medoids clustering with Reduced Datasets.The most common realisation of k-Medoids clustering is the Partitioning Around Medoids (PAM) algorithm and is as follows:
1. Initialize: randomly select k of the n data points as the Medoids
2. Associate each data point to the closest Medoids. ("closest" here is defined using any valid distance metric, most commonly Euclidean distance Euclidean distance , Manhattan distance or Minkowski distance)
3. For each Medoids m
1.For each non-Medoids data point o
2. Swap m and o and compute the total cost of the configuration
4. Select the configuration with the lowest cost.
5. Repeat steps 2 to 5 until there is no change in the Medoids.
4.2 EXPERIMENTAL RESULTS Breast cancer original dataset is reduced using principal component analysis reduction method. Dataset consists of 569 instances and 30 attributes. Here the Sum of Squared Error (SSE), representing distances between data points and their cluster centers have used to measure the clustering quality.
Step 1: Normalizing the original data set Using the Normalization process, the initial data values are scaled so as to fall within a smallspecified range. An attribute value V of an attribute A is normalized to V’ using Z-Score as follows:
V‘=(V-mean(A))/std(A)
It performs two things i.e. data centering, which reduces the square mean error of approximating the input data and data scaling, which standardizes the variables to have unit variance before the analysis takes place. This normalization prevents certain features to dominate the analysis because of their large numerical values.
Step 2: Calculating the PCs using Singular Value Decomposition of the normalized data matrix
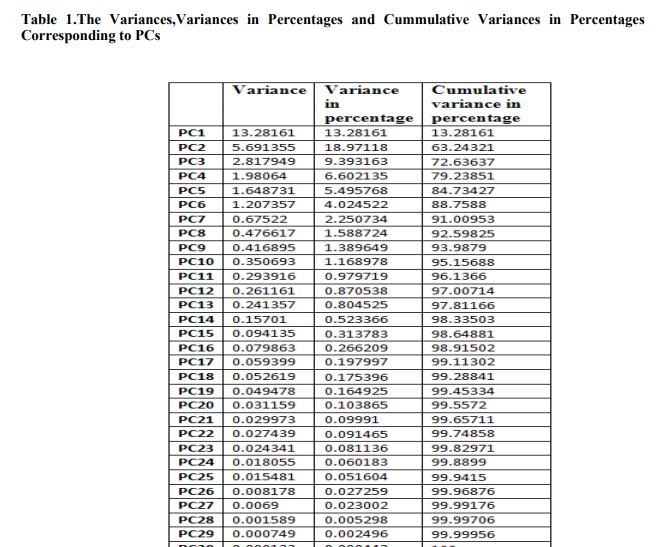
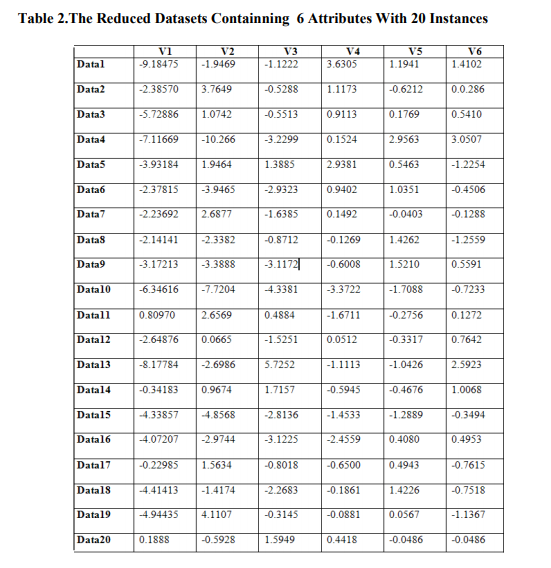
The number of PCs obtained is same with the number of original variables. To eliminate the weaker components from this PC set we have calculated the corresponding variance, percentage of variance and cumulative variances in percentage, which is shown in Table1. Then we have considered the PCs having variances less than the mean variance, ignoring the others. The reduced PCs are shown in Table2. Only Sample 20 instances of 529 observations is shown in Table2.The variance in percentage is evaluated and the cumulative variance in percentage first value is same as percentage in variance, second value is summation of cumulative variance in percentage and variance in percentage. Similarly other values of cumulative variance is calculated.
Step 3: Finding the reduced data set using the reduced PCs
The transformation matrix with reduced PCs is formed and this transformation matrix is applied to the normalized data set to produce the new reduced projected dataset, which can be used for further data analysis. We have also applied the PCA on three biological dataset and the reduced no. of attributes obtained for each dataset is shown in Table 2.
Step 4: Finding intial Medoids The proposed algorithm finds a set of medians extracted from the dimension with maximum variance to initialize clusters of the KMedoids[19]. The method can give better results when applied to K-Medoids.
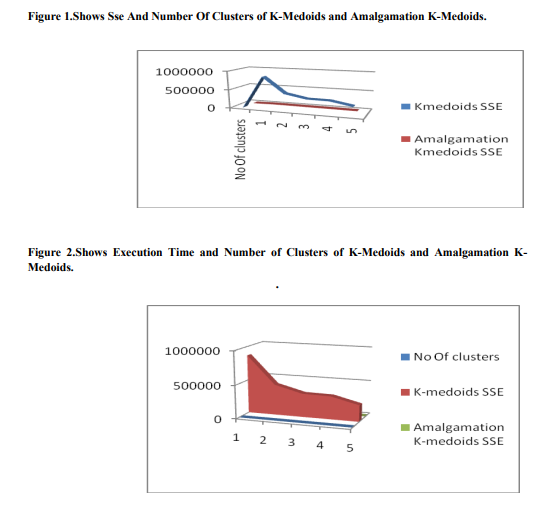
Step 5: Reduced datasets are applied to KMedoids algorithm with computed Medoids The clustering results shown in Figure I by applying the standard K-Medoids clustering[18] to the reduced breast cancer dataset. The SSE value obtained and the time taken in ms for reduced breast cancer datasets with original kmeans is given in Table 3.
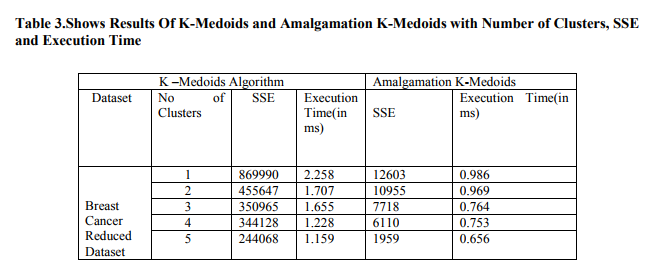

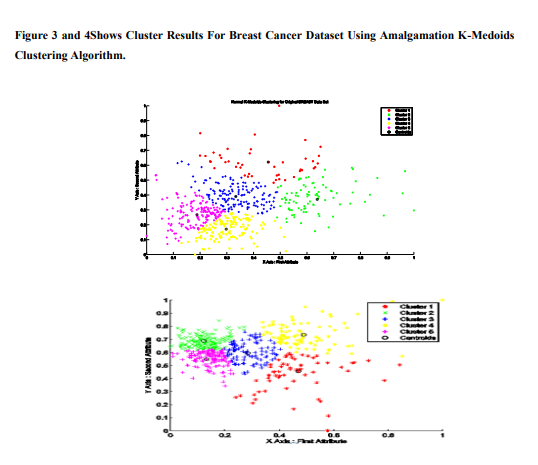
The above results show that the Amalgamation kmediods algorithm provides sum of squared error distance and Execution time of corresponding clusters. Sse and Execution time of Amalgamation K-Medoids is less than KMedoids. K-Medoids and Amalgamation KMedoids clustering algorithm is compared and results that Amalgamation K-Medoids gives better results in its than K-Medoids Figure 1.shows graph of SSE and Number of clusters. In this figure, when number of clusters increases, sum of squared error distance values decreases.Figure 2. shows number of clusters increases, Execution time increases. The Cluster Results of BREAST CANCER DataSet of KMedoids clustering with random Medoids initialization are shown in Fig-3
5. CONCLUSION In this paper a dimensionality reduction through PCA, is applied to K-Medoids algorithm. Using Dimension reduction of principal component analysis, original breast cancer dataset is compact to reduced data set which was partitioned into k clusters in such a way that the sum of the total clustering errors for all clusters was reduced as much as possible while inter distances between clusters are maintained to be as large as possible. We Propose a new algorithm to initialize the clusters Medoids which is then applied to K-Medoids algorithm. The experimental results show that principal component analysis is used to reduce attributes and reduced dataset is applied to K-Medoids clustering with computed centroids. Efficiency of Amalgamation of K-Medoids is more than KMedoids with respect to SSE and Execution Time. Evolving some dimensional reduction methods like canonopies can be used for high dimensional datasets is suggested as future work.
References:
1. Chao Shi and Chen Lihui, 2005. Feature dimension reduction for microarray data analysis using locally linear embedding, 3rd Asia Pacific Bioinformatics Conference, pp. 211-217.
2. Davy Michael and Luz Saturnine, 2007. Dimensionality reduction for active learning with nearest neighbor classifier in text categorization problems, Sixth International Conference on Machine Learning and Applications, pp. 292-297
3. Maaten L.J.P., Postma E.O. and Herik H.J. van den, 2007. Dimensionality reduction: A comparative review?, Tech. rep.University of Maastricht.
4. Valarmathie P., Srinath M. and Dinakaran K., 2009. An increased performance of clustering high dimensional data through dimensionality reduction technique, Journal of Theoretical and Applied Information Technology, Vol. 13, pp. 271-273
5. Hae-Sang Park*, Jong-Seok Lee and ChiHyuck Jun, ?A K-means-like Algorithm for K-Medoids Clustering and Its Performance ?,Department of Industrial and Management Engineering, POSTECH San 31 Hyojadong, Pohang 790-784, S. Korea
6. IEEEI.T Jolliffe, ?Principal Component Analysis?, Springer, second edition.
7. Chris Ding and Xiaofeng He, ?K-Means Clustering via Principal Component Analysis?, In proceedings of the 21st International Conference on Machine Learning, Banff, Canada, 2004
8. Xu R. and Wunsch D., 2005. Survey of clustering algorithms, IEEE Trans. Neural Networks, Vol. 16, No. 3, pp. 645-678.
9. Yan Jun, Zhang Benyu, Liu Ning, Yan Shuicheng, Cheng Qiansheng, Fan Weiguo, Yang Qiang, Xi Wensi, and Chen Zheng,2006. Effective and efficient dimensionality reduction for large-scale and streaming data preprocessing, IEEE transactions on Knowledge and Data Engineering, Vol. 18, No. 3, pp. 320-333.
10. Yeung Ka Yee and Ruzzo Walter L., 2000. An empirical study on principal component analysis for clustering gene expressionData?,Tech. Report, University of Washington.
11. Wagsta_, K., & Cardie, C. (2000). Clustering with instance-level constraints. Proceedings of the Seventeenth International Conference on Machine Learning (pp. 1103{1110). Palo Alto, CA: Morgan Kaufmann.
12. Rand, W. M. (1971). Objective criteria for the evaluation of clustering methods. Journal of the AmericanStatistical Association, 66, 846-850.
13. T Velmurugan - 2010 ,? Computational Complexity between K-Means and KMedoids Clustering Algorithms for Normal and Uniform Distributions of Data Points?.
|
 IJCRR
IJCRR 


 This work is licensed under a Creative Commons Attribution-NonCommercial 4.0 International License


