IJCRR - 4(3), February, 2012
Pages: 70-73
Print Article
Download XML Download PDF
TREND ANALYSIS OF NORTHEAST MONSOON RAINFALL OF TAMIL NADU
Author: Tamil Selvi .S , Samuel Selvaraj .R
Category: Technology
Abstract:Rainfall forecasting has been one of the most scientifically and technologically challenging problems around the world in the last century. Statistical analysis of rainfall records for long periods is essential to provide information about rainfall variability and to better manage the rainfed agricultural activities such that the impact of climate change as well as changes in land use can be realistically assessed. This paper analyse the northeast monsoon rainfall of Tamil Nadu from 1902 -2009 using linear regression technique. The chi-square test was performed to test the hypothesis. This analysis revealed that the trend
of northeast monsoon rainfall of Tamil Nadu is decreasing and they are not statistically significant.
Keywords: chi-square test , forecasting, hypothesis, linear regression, statistical analysis.
Full Text:
INTRODUCTION
The northeast (NE) monsoon season (October, November and December) is the major period of rainfall activity over south peninsular India. This season is also known as the winter monsoon [1] and post-monsoon season[2]. The NE monsoon season contributes to about 50% of annual rainfall in the east coast of Indian peninsular [3] . Tamil Nadu is the only sub-division of the Indian union which receives more rainfall in the Northeast monsoon season than in the Southwest monsoon. India is basically an agricultural country and the success or failure of the harvest and water scarcity in any year is always considered with the greatest concern [4]. The term monsoon seems to have been derived either from the Arabic mausin or from the Malayan monsin. The availability of adequate freshwater of appropriate quality has become a limiting factor for the development worldwide [5] . Understanding rainfall variability is essential to optimally manage the scarce water resources that are under continuous stress due to the increasing water demands, increase in population and the economic development [6] . Accurate and timely weather forecasting is a major challenge for the scientific community. Rainfall prediction modeling involves a combination of computer models, observation and knowledge of trends and patterns.
METHODOLOGY
We have used the Northeast monsoon rainfall data of Tamil Nadu from the period 1902- 2009. The data are obtained from the Regional Meteorological centre, Chennai. A wide range of rainfall forecast methods are employed in weather forecasting at regional and national levels. Fundamentally, there are two approaches to predict rainfall. They are Empirical method and dynamical methods. Using these methods, reasonably accurate forecasts can be made up. Several recent research studies have developed rainfall prediction using different weather and climate forecasting methods. Regression is a statistical empirical technique and is widely used in business, the social and behavioral sciences, the biological sciences, climate prediction, and many other areas. The most widely use empirical approaches used for climate prediction are regression, artificial neural network, fuzzy logic and group method of data handling. This paper describes empirical method technique belongs to the regression approach which try to make a short-term forecast of rainfalls in our state. Generally, the study of the weather and climatic elements of a region is vital for sustainable development of agriculture and planning. A declining and/or rising trend etc may be quite instructive for different segments of the human and natural systems [7] . The time series is made up of four components known as seasonal, trend, cyclical and irregular [8]. Trend is defined as the general movement of a series over an extended period of time or it is the long term change in the dependent variable over a long period of time [9]. Trend is determined by the relationship between the two variables rainfall and time. Trend analysis was accomplished with the line graphs as well as the least square regression technique for hypotheses testing and modelling. The chi-square test of association is used to find whether there is significantly a variation in the data having similar background. A trend is the general pattern of fluctuation of data over time [10]. Many methods are available for calculating trend but the most common ones are the least square regression techniques [11] . For reasons of hypothesis testing, generalization and projection, the study adopted the least square regression method. The linear regression line was fitted using the most common method of least squares. This method calculates the best fitting line for the observed data by minimizing the sum of the squares of the vertical deviations from each data point to the line. If a point lies exactly on the straight line then the algebraic sum of the residuals is zero. Residuals are defined as the difference between an observation at a point in time and the value read from the trend line at that point in time. A point that lies far from the line has a large residual value and is known as an outlier or, an extreme value. Though time – series data are not bivariate data, a linear trend line can be obtained by using the simple regression analysis technique [12],[10]. In the study therefore, time in years is one independent variable (x) while North east monsoon rainfall amount for 108 years (1902- 2009) is considered the dependent variable (y). The equation of a linear regression line is given as [13] , Y = a + bx + e
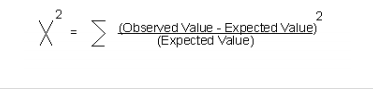
where; Y = Dependent variable ( rainfall in mm) X = Independent variable (time in years). a = A constant and y – intercept b = Regression coefficient e = Error random term In order to fit regression line the north east monsoon rainfall (dependent variable) against time (independent variable) in years were plotted. Linear regression lines were then fitted to determine the trends of rainfall. The contingency test, k – sample chi-square test of homogeneity is employed to associate the rainfall data. The problem can be solved as a contingency problem utilizing the rather normal chi-square test formula. The use of the conventional χ 2 formula involves the calculation of the expected frequencies is calculated.
The following research hypothesis are formulated a prior for testing at 99% level of confidence. Hi: Northeast monsoon rainfall of Tamil Nadu has varied insignificantly over time in the study area Decision Rule Reject null hypothesis (Ho) and accept the alternative research hypothesis (Hi) if critical χ2 value is lower than the calculated value at 99% confidence interval.
RESULTS AND DISCUSSION
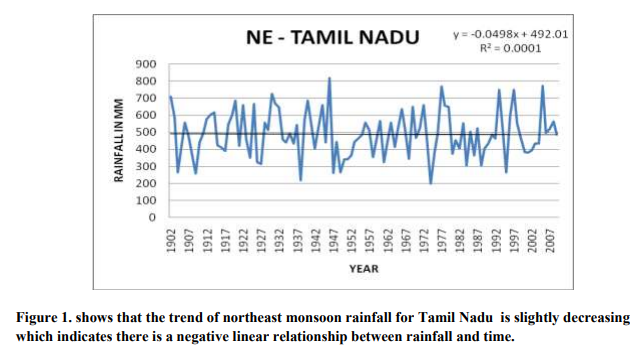
As shown in Fig. 1, the north east monsoon rainfall of Tamil Nadu is statistically defined by the function y = -0.0498x + 492.01 +e It is significant at 99% confidence level with a coefficient of determination figure of 0.0001 or 0.01 %. In our study, the calculated value is much higher than the critical value so null hypothesis is rejected and alternative research hypothesis is accepted. i.e. Northeast monsoon rainfall of Tamil Nadu has varied insignificantly over time in the study area. The trend though negative is statistically not significant at 99% confidence; percentage explanation is equally very low at 0.01%
CONCLUSION
Rainfall time series may be unfounded. The topic of monsoon-rainfall data series is highly complex; the role that linear regressions might play in this topic is one for future research—it appears, from the evidence here, not to be useful as a predictive model. Whether it might be useful for offering an approximate value of future monsoon rainfall remains to be seen. Rainfall is most essential for our life. So, we predict that rainfall in the certain period. Therefore, we avoid flood, cyclone, forest fire detection, global warming etc. In future we predict the rainfall forecasting and other applications done by using the artificial intelligence, neural network and fuzzy sets etc. We do the research on public sectors and save the world.
References:
1. Nageswara Rao G. Variations of the SO relationship with summer and winter monsoon rainfall over India: 1872–1993. J. Climate 1999; 12 : pp. 3486–3495.
2. Singh N and Sontakke N A . On the variability and prediction of the rainfall in the post-monsoon season over India. Int. J. Climatol. 1999; 19: pp. 300–309.
3. Kumar P, Rupa Kumar K, Rajeevan M and Sahai A K . On the recent strengthening of the relationship between ENSO and northeast monsoon rainfall over south Asia. Climate Dynamics 2007; 28: pp. 649–660.
4. Rajeevan M . Prediction of Indian summer monsoon: Status, problems and prospects. Current Science. 2001; 81: pp. 1451-1457 .
5. Gat J.R . Planning and Management of a Sustainable and Equitable Water Supply under Stress of Water Scarcity and Quality Deterioration and the Constraints of Societal and Political Divisions: The Case for a Regional Holistic Approach. Department of Environmental Science and Energy Research. The Weizmann Institute of Science, 2004. 76100 Rehovot, Israel.
6. Herath, S. and Ratnayake, U. Monitoring rainfall trends to predict adverse impactsacase study from Sri Lanka (1964-1993). Global Environmental Change, 2004; 14: pp. 71-79.
7. Afangideh, A. I., Francis, E. Okpiliya, Eja, E. I. A Preliminary Investigation into the Annual Rainfall Trend and Patterns for Selected Towns in Parts of South-Eastern Nigeria Journal of Sustainable Development September 2010; 3: pp. 275-282.
8. Patterson, P. E. 1987, Statistical Methods, Richard D. Irwin INC, Homewood, IL
9. Webber, J. and Hawkins. C. 1980, Statistical Analysis Applications to Business and Economics, Harper and Row, New York.
10. Okoko, E. 2001, Quantitative techniques in urban analysis. Ibadan, Krafy Books
11. Box, GEP and Jenkins, G. M. 1976, Time series Analysis Forecasting and control. San Francisco, Holder Day Publishers.
12. Udofia, E. P. 2008. Fundamentals of social science statistics, Enugu, Immaculate. Books.
13. Hays, W. E. 1981, Statistics. CBS College publishing, Tokyo.
|
 IJCRR
IJCRR 


 This work is licensed under a Creative Commons Attribution-NonCommercial 4.0 International License


