IJCRR - 4(3), February, 2012
Pages: 19-25
Print Article
Download XML Download PDF
CROPPING AND LAND USE PATTERN IN HIMACHAL PRADESH: CASE OF DISTRICT SOLAN
Author: Kumar Sanjay, Barik Kaustauv, Prashar Deepak
Category: General Sciences
Abstract:The present research paper deals with the issues like land use and cropping pattern of district Solan of Himachal Pradesh. Change in these two factors determined the pace of agricultural diversification. The process of diversification of agriculture reduces the risk of perishment of crops and provides economical benefits to farm. Hence, it may prove helpful in alleviating rural poverty. To know about the changes in area under various crops, percentage method was used as a statistical tool. The result obtained in this study indicates that area under pulses shows decreased behavior pattern whereas in case of vegetables significantly increase was resulted.
Keywords: Agriculture, Cropping pattern, Land use, Crops, Food grains
Full Text:
INTRODUCTION
The agriculture plays a vital role in shaping the Indian economy. In recent years though its contribution to the Gross Domestic Product is progressively declining approximately from 50% in 1950-51 to 14.6% in 2009-10 however a substantial proportion (64%) of population depends on this sector. Scarcity of cultivated land hampers the agricultural sector compare to secondary and tertiary sectors (industrial and service sector). Land use pattern has a great impact on the agricultural economy. The process of diversification within agriculture has now switched on to high value crops instead of low value crops which causes change in land utilization in agriculture. Change in cropping pattern is an essential part and common mode of diversification, which has great impacts on agricultural development and alleviation of rural poverty [1]. The rapid increase in human and livestock population has resulted in a change in cropping pattern and intensity of land use [2]. In this situation where the scope of bringing more land under cultivation is very limited, appropriate choice of cropping pattern can prove to be helpful in raising income from their limited land holdings. To generate and sustain the farm income for a long period it becomes necessary to use land optimally. This also affects the productivity of soil in a least hampered manner. Among the hill states prevailing in India, Himachal Pradesh is observed to be the most progressive state, which has made remarkable achievement in socio-economic development of its people [3]. Himachal Pradesh offers a model of hill farming in India [4]. The agro climatic conditions of the state ranging from sub tropical to humid temperature and cold deserts. Traditional field crop based farming is also done by majority of farmer for sustaining their rural economy. The growing interest of the farmers to run farming from business purpose has also encouraged them to reconstitute the cropping pattern and related activities. Consequently, there is wide difference in the system of cultivation, cropping pattern and cropping season between different regions and districts. A study conducted [5] resulted that food grains such as wheat, maize and paddy play a dominant role and occupy around 85 % of total area under food grains in Himachal Pradesh. Many researchers have carried out and utilize these cropping patterns along with diversification in different forms and in different geographical areas [6-10]. The present paper aims at the analysis of cropping pattern and land utilization in the Solan district of Himachal Pradesh .This district was specifically and purposively selected due to its increasing emergence as the most prominent and successful diversified agrarian pocket of the state. The farmers of the area have shown their increased interest towards the adoption of new crop enterprises. This district has total geographical area of around 1936 sq. km. and constitutes 3.49 % of the total area of the state. Following two objectives were selected as a criterion for the present research work.
- To study the change in the use of land resources in the district Solan.
- To examine the variations in cropping pattern of the district
METHODOLOGY
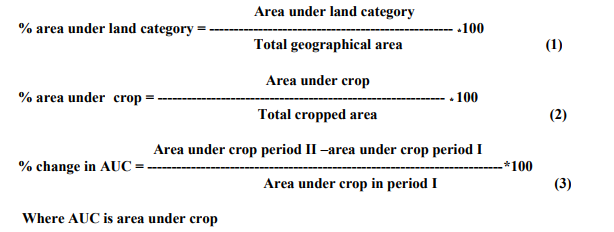
The present investigation is based on the secondary data. The data on different land use categories and cropping pattern of Solan were drawn from various published and reliable sources such as Annual Season and crop reports, Statistical Outlines of Himachal Pradesh etc. from 1993-94 to 2007-08. Annual Season and crop reports presented the data from 1993-94 onwards which is used as a platform for our present study. Simple tabular analysis and percentage method are used to fulfill the objectives of the study. The calculation of % area under land category, % area under crop and % change in area under crop was carried out utilising the formulas in equation 1, 2 and 3.
RESULTS AND DISCUSSION
Land Utilization Pattern in District Solan The percentage of different land categories to total geographical area was computed to evaluate the status of different categories of the land and net sown area in district Solan of Himachal Pradesh. This procedure was carried out for three different years i.e. 1993-94, 2000-01 and 2007-08 to examine the deviations over the different years. Area and percentage for each land category were given in Table 1.
The data indicated that the total geographical area of district Solan has increased from 180553 hectare during 1993-94 to 180923 hectare. This was due to increase in forest area of 370 hectare under forest land settlement of Tehsil Kandaghat of district Solan. Out of the total geographical area nearly 11 percent (20290 hectare) is covered by the forests. The net area available for cultivation was decreased from 22.35 % in 1993-94 to 20.62 % for the year 2007-08. Current fallow was increased from 2.40 % in 1993-94 to 2.62 % during 2007-08. There was decrease in cultivated area merely 668 hectare from the period 1993-94 to 2000-01. But there was significant decrease of 1970 hectare in the cultivated area from 2000-01 to 2007-08. This change is due to rapid urbanization and industrialization in the district. Solan district has recorded the highest population growth during the period 1991-2001.
Its total and urban population showed decadal growth of 30.64 percent and 92.84 percent, respectively. The main reasons for high growth in urban population were ideal location of Solan town in terms of accessibility to various facilities, moderate climate and nearest to state capital Shimla. Large number of industrial units has emerged at the industrial areas of Nalagarh, Barotiwala, Parwanoo and electronic complex at Chambaghat. Permanent pastures area was declined from 44.15 % in 1993-94 to 42.71% in the year 2007-08. Land available for non-agriculture uses was increased from 5.83 % in 1993-94 to 6.74 % in 2007-08. It is also clear from the table that over the time span forest, culturable waste, other fallow including barren land expressed increase in area whereas, reverse phenomenon was observed in case of land put under miscellaneous tree crops and groove . Area under Different Crops Cereals such as maize and wheat are the main cultivated crops. Even though, all the important crops are grown in the area, yet most of the demand of the cereals is meeting out from outside supplies. Among the income generating commercial crops like tomato, peas, capsicum and potato are important. Area and percentage area under different crops is given in Table 2. Study of area under various crops as a percentage of total cropped area indicated that percentage area under total cereals exhibits marginal increase from 83.04 in 1993-94 to 83.98 in 2007-08. Although the percentage change in area under total cereals looks insignificant but, actually there is significant decline of 2274 hectares between 1993-94 and 2007-08.
The percentage area under wheat and paddy expanded from 36.69 to 39.21 and 5.35 to 6.82, respectively during the period of 1993-94 and 2007-08. Area under maize creeps down from 38.32% to 35.49% while, barley and other cereals registered marginal decline. Among pulses, area under gram, black gram, peas and horse gram over the period (1997-98 to2007-08) had declined. Percentage area under total pulses decreased from 6.75 in 1993-94 to 3.90 in 2007-08.
The total cropped area under total food grains decreased from 60321 hectares in 1997-98 to 55986 hectares in 2007-08. Area under vegetables grew from 3.06 % in 1997-98 to 5.78 % in 2007-08. Tomato is most important crop under which area increased more than double from 1306 hectares in1997-98 to 2625 hectares in 2007-08. There is also minor increase in the percentage area under fruits and condiments and spices for the same period. The deviation of area under pulses during the period is compensated by the expansion of area under these crops as shown in Table 2. But, percentage area under oilseeds decreased from 2.63 to 1.73 during the study period. There is slight decline in percentage area under fodder crops and other crops during the present study period. This is mainly due to the expansion in the area under vegetables in the district Solan. The data of the year 2000-01 shows similarities and slight deviation as compare to 2007-08 and the continuation of this is carried till 2007-08 hence it is not used for comparison. The total cropped area registered decline of 3455 hectares between 1993-94 and 2007- 08. Percentage area under net sown area decreased from 60.08 to 58.57. Although there is an increase in percentage area sown twice in a year from 39.91 to 41.42 during the study period.
Trends in Area under Different crops The trend of increase or decrease in area under different crops is given in Table 3. It is revealed that during present investigation period, area under food grains has contracted. In 2000-01 there was decline in area under food grains by 7.15% in comparison to1993-94 and during the period 2000-01 to 2007-08 there was almost no change in area. Therefore, over the study period, the percentage fall in the area under food grains was almost constant by 7.16%. This contraction resulted due to expansion of area under vegetables and decline in area under maize, barley and pulses. Area under wheat showed mixed trends over the study period. Percentage area under wheat decline 5.71 in 2000-01 compared to 1993-94 and increase of 7.51 in 2007-08 in comparison to 2000-01. In case of barley, trends showed decline and percentage declination in area is 12.97 between the periods 1993-94 to 2007-08. There is also decreasing trends of maize cultivation, the total declination is 12.13% over the study period. The major reasons for this decline in these crops are: (1) The problem of wild animals (monkey, pigs and birds etc.) that mainly destroy the maize crop in this area. (2) Food habits of peoples also changed as a result of adaptation, they prefer wheat and rice in place of maize and barley. Table 3 shows that there is increase of 21.02% for crop paddy. High price of rice inspired the farmers to bring more area under cultivation of this crop. Area under pulses shows significant decline of 45.39% in 2007-08 in comparison to 1993-94. This was due to expansion of area under vegetables in the district Solan. Among the non food crops vegetables registered an increase of 79.06 % during the period 1993-94 to 2007-08. The decline in area under cultivation of pulses was compensated by the expansion of the area under vegetables. Oilseeds, fodder crops and others shows decline in area of about 37.66%, 20.79% and 39.31% respectively over the study period. Fruits, condiments and spices exhibit in area under these crops i.e. 14.03% and 70.94%. The attractive price of cash crops such as vegetables, fruits, condiments and spices inspired the farmer to increase production of these crops on more and more area but, also motivate them to shift the area from some of the food crops to cash crop cultivation. This may proves helpful to fulfill their requirements and to get better prices from the sale of their product. Table 3 reveals that net sown area, area sown more than once and total cropped area has decreased about 7.52%, 1.55% and 5.14% respectively over the period 1993-94 to 2007-08. The major reason for this decline in area under cultivation maybe the problems of wild animals (monkey, pigs and birds etc) that mainly destroys the maize and other crops. So the people restricts there cultivation and the far of land (not protected from wild animals) remains uncultivated during the last decade or so.
CONCLUSION
To evaluate the sequential variations of land under different uses in district Solan of Himachal Pradesh from 1993-94 to 2007-08 revealed that, there were some notable variations under area in case of permanent pastures and net sown area. Moreover, other land categories had not shown significant change under their area. The study on the cropping pattern in district Solan over the study period suggest that among food crops area under wheat and paddy has increased whereas, in case of barley and maize it had declined considerably. Area under non food crops has shown increased trend for cash crops. The result indicates that total cropped, net sown area, and area sown more than once decreased in period (1993-94 to 2007-08). The trend of cropping pattern in Solan district from 1993-94 to2007-08 disclosed the fact that shifting of area from food grains towards vegetables, fruits, condiments and spices is considerably high. It is clear from the above results and suggestions that farmers of the area are shifting towards commercial cropping.
ACKNOWLEDGEMENT Authors acknowledge the immense help received from the scholars whose articles are cited and included in references of this manuscript. The authors are also grateful to authors/ editors/ publishers of all those articles, journals and books from where the literature for this article has been reviewed and discussed.
References:
1. Ram S. Cropping Pattern Diversification in Orissa. Agricultural Situation in India 1999; 4: 15-18.
2. Gupta S, Sharma RK. Land Utilization Pattern in Himachal Pradesh: A District-wise Analysis. Agricultural Situation in India 2009; 4: 31-35.
3. Khoshla PK, Raina KK. Himalayan Farming Systems –RandD Support for sustainable Agro Economy. Centre for Integrated Mountain Development 1996: 12-13.
4. Kanwar PC. Diversification of Agriculture in Himachal Pradesh: A Spatio- Temporal Analysis. Agricultural Situation in India. 1986; 9: 451-454.
5. Oberoi RC, Raina KK. Growth and Diversification of Foodgrains in Himachal Pradesh. Economic Affairs 1991; 36(3): 155-160.
6. Chand R. Diversification through high values crops in western Himalayan region: Evidence from Himachal Pradesh. Indian Journal of Agriculture Economics 1996; 51(4): 652-663.
7. Narayanamoorthy A. Crop Diversification and Yield Response to Fertilizer. Productivity 1997; 38(1): 118-125.
8. Kumar U. Diversification of Crops in West Bengal: A Spatio- Temporal Analysis. Artha Vijnana 2000; 42(2); 170-182.
9. Vyas VS. Diversification in Agriculture: Concept, Rationale and Approaches. Indian Journal of Agriculture Economics 1996; 51(4): 636-643.
10 Kumar U. Changing Cropping System in Theory and Practice: An Economic Insight into the Agrarian West Bengal. Indian Journal of Agriculture Economics 2003; 58(1): 64-83
|
 IJCRR
IJCRR 


 This work is licensed under a Creative Commons Attribution-NonCommercial 4.0 International License


