IJCRR - 4(8), April, 2012
Pages: 23-32
Date of Publication: 25-Apr-2012
Print Article
Download XML Download PDF
PATIENTS' PERCEPTION ON HOSPITAL SERVICES WITH SPECIAL REFERENCE TO BEHAVIOR OF DOCTORS IN VILLUPURAM DISTRICT
Author: D. Karthikeyan, M. Thurunarayanasamy
Category: Healthcare
Abstract:This study aims to examine the patient perception of hospital services in villupuram district. A total of 600 respondents were selected in the study area in and out patients were included in the study to know their perceptions towards the public and private health facilities. The major reason of choosing the public health facility was inexpensiveness, infrastructure, and proximity of health facility. From the analysis of the respondents regardless of their social status have expressed the same ?poor' views, but there is a significant difference in the degree of poor opinion across respondents categories by age, sex, education and occupation. It is finally concluded that behavior of doctors is significantly better in private hospitals compared to Government hospitals in villupuram district.
Full Text:
INTRODUCTION
Studies of patient satisfaction towards health services, health personnel and resources constitute important elements in the extent to which health services meet consumers‘ expectations and needs. In recent years, patient‘s opinion is increasingly considered to be a useful component in the determination of care outcomes. Users‘ perceptions are now considered to be important source of information in screening for problems and developing an effective plan of action for quality improvement in health care organization1 . Quality of health care is the degree of performance in relation to a defined standard of interventions known to be safe and that have the capacity to improve health within available resources. It can also be defined as meeting the health needs at the lowest cost and within regulations2 . Traditionally quality of health care has been measured using professional standards and neglecting the importance of patient perception and opinions in assessments of medical services, It has gained greater prominence over the past 25 years In any field, including medicine, customers‘ perception on any service providing paramount importance and it is necessary for continual service improvement.3
Statement of the Problem
Last three decades provision of health care was dominated by Govt - run Hospitals. Owing to population explosion and consequent pressure on hospital infrastructure, Government hospitals could not cater to the needs of ever-growing patient population. With the result, patients belonging to middle class and upper middle class started switching to private health care providers in getting quality medical service. The newer diseases, life style diseases caused by environmental degrade warrant a heavy demand on health care services. Besides Government hospitals, and private hospitals have begun health care needs proliferating to cater to the mounting health care space. It is also apparent that there is a growing dissatisfaction among the patient clients about the services provided by health care service providers. Studies of patients‘ perception towards health personnel, health services and resources are important to determine whether they meet patients‘ expectations and needs and to judge patient satisfaction. This information can be used by hospital management in the improvements of programs and the problems identified by the patients. This will further provide a detailed picture of the patients‘ experience at the hospital from which the hospital management can direct and focus their resources for better service in the future.. In this context this study proposed patients‘ perception doctors on hospital services with in Villupuram District.
Objective of the study
1. To measure the patients‘ perception on behavior of health personal in select hospitals in the study area.
METHODOLOGY
Period of the study
The required primary data would be collected from the selected respondents during three months period, from May 2011 to July 2011. Secondary data will be collected for ten years period from 2002 to 2011
Sources of data
Primary data will be collected through questionnaires as well as through personal. Secondary data will be collected from published books, journals, and other documents
Sampling Design
The survey is proposed to conduct only on the target population of the selected hospitals. The details regarding the selected hospitals were obtained from the Deputy Direct of Health services, Villupuram. There are 575 public sector health establishments namely Government hospitals, Primary Health Centres (PHCs) and Health Sub-Centres (HSCs) in the district. There are and 143 private sector health establishments are namely private hospitals, nursing homes and clinics. Stratified random sampling was adopted for the selection of hospitals.
Sampling Technique for Selection of Hospitals and respondents
With regard to the selection of hospitals more than 50 bedded hospital from both private and government hospital in the study area will be selected, ten hospital from the government and ten from the private sector by using stratified random sampling technique. Thirty patients from each such sample hospital will be selected using convenience sampling technique. Thus, the sample size of the patients of Government hospitals amounts to 300 and 300 patients from private hospitals. Thus, the total sample size of the patients for this would be 600; it consists both in and out patients
RESULTS AND DISCUSSION
The reliability analysis calculates the following: item to total correlation, alpha if deleted and overall Cronbach‘s alpha coefficient. The Cronbach‘s alpha coefficient is widely used measure to find out the reliability and validity of a scale items. A scale items with Cronbach‘s alpha value of 0.70 and above is considered as reliable and valid in the acceptable level. George and Mallery (2003) provide the following rules of thumb: ? > 0.90 – Excellent, > 0.80 – Good, > 0.70 – Acceptable? (p. 231). As a rule of thumb, the cutoff value for item to total correlation is 0.30 and above, and alpha if deleted value should be less than overall Cronbach‘s alpha coefficient for any item to be retained in the scale. However, if alpha if deleted value is less than overall Cronbach‘s alpha, and item to total correlation is a bit less than 0.30 (>= 0.25), then the item can be considered for retaining in the measurement scale. Next to reliability analysis, data pertaining to behavior of doctors are exposed to principal components of factor analysis with varimax rotation to identify the primary behaviours of doctors. The perceived status of primary behaviours are then compared across different socio-economic categories of respondents. This is carried to know whether the respondents regardless of the difference in socio-economic characteristics have perceived the behavior of doctors and nurses in similar manner or not. If there is similarity in the perception regardless of the socio-economic characteristics then final perceived status based on the entire sample regarding the doctors‘ as well as nurses‘ behavior will be irrefutable and conclusive. The results of the analysis are tabulated and discussed in the remaining part of this chapter.
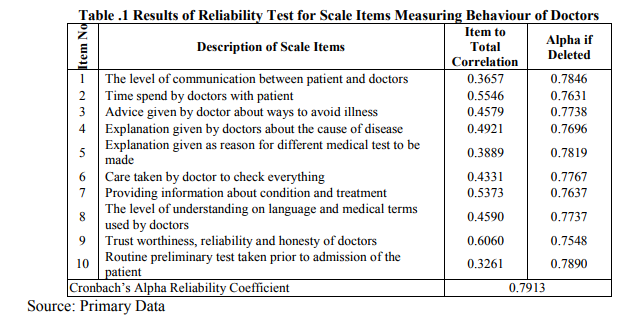
From Table 1, which presents the reliability analysis for items in the scale measuring behavior of doctors, it understood that ?item to total correlation‘ for all items is above 0.30 and alpha if deleted value is below the overall Cronbach alpha coefficient of 0.7913. Hence, all 10 items in the scale used in the present study for measuring behavior of doctors towards patients are reliable and valid. Table 5.2 and 5.3 provides the results of factor analysis of the items in the scale measuring doctors‘ behaviors. The eigenvalue produced by the factor analysis is nothing but variance explained in (extracted from) the actual original data by an underlying factor. The size of the eigenvlaue determines how many factors are extractable (valid) from the actual data. According to Kaiser Rule, a factor with eigenvalue of one or above is considered as a valid factor.
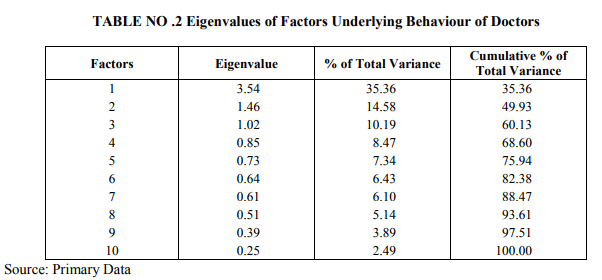
In Table 5.2, it can be seen that the eigenvalue of first, second and third factors is above one, explaining 35.56 per cent, 14.58 per cent and 10.19 per cent of the variance in the actual data. All these factors together could posses 60.13 per cent of the essence of actual data. This further reveals that there are three factors underlying the behaviours of doctors and these three factors can be extracted for further analysis. To know the characteristics of each one of the valid factors, loadings of items in the scale with these factors are used.
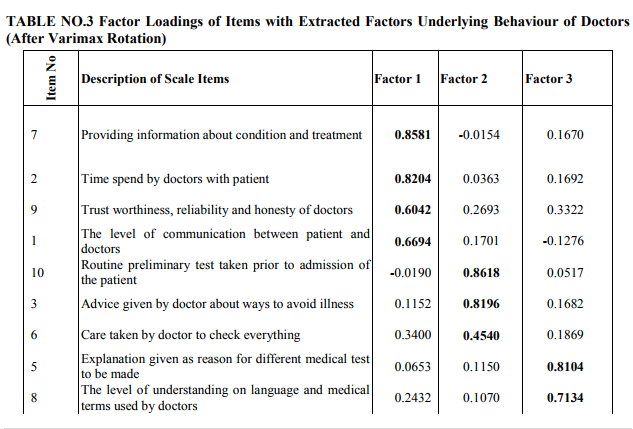
From Table 5.3, which provides the loadings of items in the scale with each one of the extracted factors, it is understood that the first factor is highly loaded with items 7 (Providing information about condition and treatment), 2 (Time spend by doctors with patient), 9 (Trust worthiness, reliability and honesty of doctors) and 1 (The level of communication between patient and doctors), second factor is loaded with items 10 (Routine preliminary test taken prior to admission of the patient), 3 (Advice given by doctor about ways to avoid illness) and 6 (Care taken by doctor to check everything), and third factor has high loadings of items 5 (Explanation given as reason for different medical test to be made), 8 (The level of understanding on language and medical terms used by doctors) and 4 (Explanation given by doctors about the cause of disease). Further, the loading of items 7 and 2 with first factor, items 10 and 3 with second and item 8 with third factor is very high. Hence, based on the items with highest loadings, the first, second and third factors is identified as the factors possessing the behaviours of the doctors in respect of ?Providing information about condition and treatment?, ?conducting Preliminary test prior to admission & advising patients to avoid illness?, and ?Giving reasons for conducting different medical test?. The perceived status of above these three primary behaviours of doctors is evaluated based on the entire sample as well as across sub-sample groups based on their socioeconomic characteristics. The mean of the entire sample is compared with ?3‘, the value for neutral range using one-sample t-test to statistically identify the opinion range. The independent sample t-test and one-way ANOVA is used to compare the means of two groups and more than two groups respectively. Table 5.4 presents the mean opinion level of entire sample about primary behaviours of doctors in both private and government hospitals.
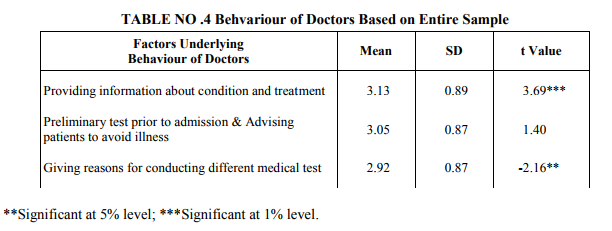
An observation of the table shows that the mean level of opinion of the entire sample with ?providing information about condition and treatment? (Mean = 3.13), is significantly higher than the neutral level (t-value = 3.69, p < 0.01) whereas the opinion of the total sample regarding ?giving reasons for conducting different medical test? (Mean = 2.92) is significantly less than neutral level (t = -2.16, p < 0.05). On the other hand, the all respondents in the sample have expressed neutral opinion about ?Preliminary test prior to admission & Advicing patients to avoid illness? (Mean = 3.05, t value is insignificant). Hence, it is found that behavior of doctors in providing information about condition and treatment is good, giving reasons for conducting different medical test is poor and conducting routine preliminary test prior to admission and advising patients to avoid illness is neither poor nor good.
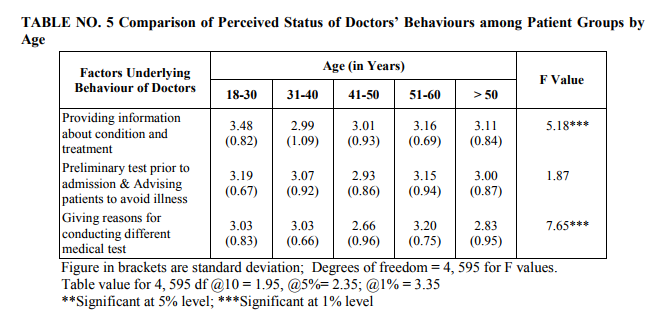
As shown in Table 5.5, the mean scores across age groups ranges from 2.99 to 3.45 for ?Providing information about condition and treatment?, 2.93 to 3.19 for ?Conducting routine preliminary test prior to admission & Advising patients to avoid illness? and from 2.66 to 3.20
?Giving reasons for conducting different medical test?. From significant F value of 5.18 (p < 0.01) and 7.65 (p < 0.01), it is understood that the opinion of the respondents about behavior of doctors regarding ?Providing information about condition and treatment? and ?Giving reasons for conducting different medical test? differ by age while their opinion about ?Conducting routine preliminary test prior to admission & Advising patients to avoid illness? is independent of the age.
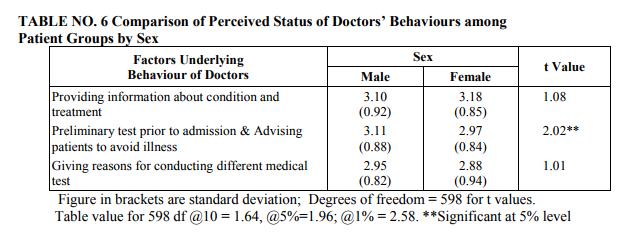
From the comparison of opinion about behaviour of doctors between male and female patients, results of which are presented in Table 5.6, it is evident that both male and female regardless of the difference in sex have perceived similarly about ?Providing information about condition and treatment? and ?Giving reasons for conducting different medical test?. At the same time, regarding doctors‘ behavior in respect of ?Conducting routine preliminary test prior to admission & Advising patients to avoid illness?, the level of opinion of female group is significantly less than that of male counterparts (t-value = 2.02, p < 0.01).
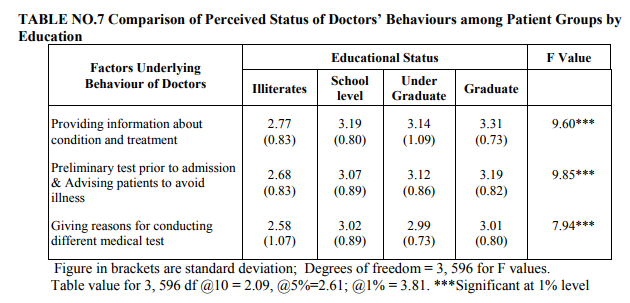
When the opinion of the respondents compared across categories by education using one-way ANOVA test, results of which are depicted in Table 5.7, it is understood that there is a significant difference in the mean level of opinion across groups by educational status. This is because, F values, 9.60, 9.85 and 7.94 for the difference in group means are all significant at 1 per cent level. However, mean scores are much below 3 only for illiterates. Hence, it is found that perceived status of doctors‘ behavior among patients is poor according to illiterates and differ significantly from other educational groups in this regard. Table 5.8 presents the results of test comparing the mean perception between patient group in urban and rural areas.
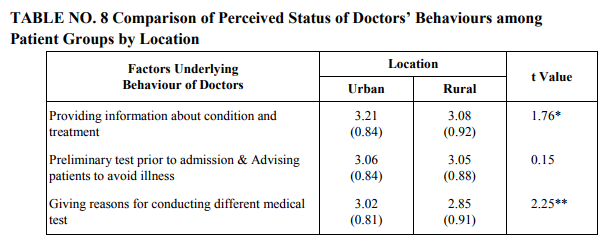
Figure in brackets are standard deviation; Degrees of freedom = 598 for t values. Table value for 598 df @10 = 1.64, @5%=1.96; @1% = 2.58. *Significant at 10% evel; significant at 5% level From the results presented in the table, the mean level of opinion is significantly higher for urban group regarding ?Providing information about condition and treatment? (Mean = 3.21 Vs 3.08 and t-value = 1.76, p < 0.10) and ?Giving reasons for conducting different medical test? (Mean = 3.02 Vs 2.85 and t-value = 2.25, p < 0.05)) compared to that of rural counterparts. That is, urban patients perceive ?Providing information about condition and treatment? as good and ?Giving reasons for conducting different medical test? as neither good nor bad and this level of opinion is significantly than that of rural patient group. At the same time, regarding ?Conducting routine preliminary test prior to admission & Advising patients to avoid illness?, both urban and rural group have perceived as neither poor nor good. Table 5.9 provides mean opinion across respondent categories with different occupational status about behaviours of doctors in hospital towards patients.
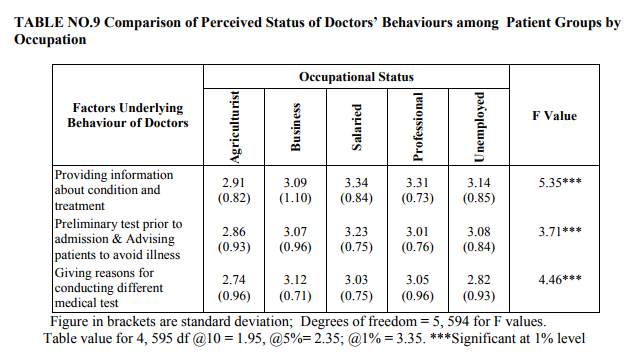
According to the table, the mean perception of the agriculture group against all three factors and that of unemployed against ?Giving reasons for conducting different medical test? is below the neutral level (below 3.0). The mean scores for other occupational groups ranges between 3.01 (for professional group regarding ?preliminary test prior to admission & Advising patients to avoid illness?) and 3.34 (for salaried in respect of ?Providing information about condition and treatment?. Further, F values 5.35, 3.71 and 4.46 for the different in group means against all three factors are significant at 1 per cent level. So, it is found that there is a significant difference in the perceived status of doctors‘ behavior in hospitals among patients with different occupational status. Regarding behavior of doctors in private and government hospitals, the opinion of the patients is compared and results of the comparative analysis are reported in Table 5.10.
As reported in the table, the behavior of doctors in government hospital is found to be poor as mean perception of the patients, which ranges between 2.50 and 2.86, is much less then neutral level (value of 3) against all three factors. At the same time, mean perception of the patient group belong to private hospitals ranging from 3.31 to 3.40 is well above 3 (neutral level) and in ?good‘ range. Moreover, the t-values, 7.84, 7.79 and 13.57 for the difference in mean opinion level between private and government hospital patient groups with regard to ?Providing information about condition and treatment?, ?Conducting routine preliminary test prior to admission & Advising patients to avoid illness? and ?Giving reasons for conducting different medical test? are significant at 1 per cent level. Therefore, it is concluded that doctors‘ behavior in Government hospital is poor whereas it is good in private hospitals.
CONCLUSION
In this study, an attempt was made to know whether the respondents regardless of the difference in socio-economic characteristics have perceived the behavior of doctors. The perceived status of primary behaviours is then compared across different socio-economic categories of respondents, based on the items with highest loadings, the first, second and third factors is identified which are ?Providing information about condition and treatment?, ?conducting Preliminary test prior to admission & advising patients to avoid illness?, and ?Giving reasons for conducting different medical test?. The perceived status of above these three primary behaviours of doctors is evaluated based on the entire sample as well as across sub-sample groups based on their socioeconomic characteristics. From analysis of the respondents regardless of their social status have expressed the same ?poor‘ views, but there is a significant difference in the degree of poor opinion across respondents categories by age, sex, education and occupation. It is finally concluded that behavior of doctors is significantly better in private hospitals compared to that of those in Government hospitals in the villupuram district.
References:
1. Krupat, E., Rosenkranz, S. L., Yeager, C. M., Barnard, K.,Putnam, S. M., & Inui, T. S. (2000). The practice orientations of physicians and patients: The effect of doctor– patient congruence on satisfaction. Patient Education and Counseling, 39(1), 49–59.
2. Bureau ofIndian Standard. Quality Management and Quality System Elements: Guidelines for Services : IS : 14004 (part - 2), 1992.
3. Torres E. J. and Guo K. L., 2004, ?Quality improvement techniques to improve patient satisfaction? International Journal of Health Care Quality Assurance Vol. 17, No. 6, pp. 334-338.
|
 IJCRR
IJCRR 


 This work is licensed under a Creative Commons Attribution-NonCommercial 4.0 International License


