IJCRR - 4(11), June, 2012
Pages: 97-107
Date of Publication: 18-Jun-2012
Print Article
Download XML Download PDF
PREVALENCE OF OVERWEIGHT AND OBESITY AMONG WOMEN IN MADURAI CITY
Author: C.Thilakam, K.RethiDevi
Category: General Sciences
Abstract:Excess body weight poses one of the most serious public health challenges of the 21st century globally.
Comparison of NFHS-2 (1998-1999) and NFHS-3 (2005-2006) data indicated that prevalence of obesity
among Indian women has elevated from 10.6 to 12.6 per cent with an increment of 24.5 per cent betwee
the years 1998-1999 and 2005-2006 and accordingly, TamilNadu ranks 4th in the order of prevalence of
obesity. Since obesity is more common among women than in men, a study on prevalence of obesity
among women in Madurai city was taken up. A total of 3012 women in age group 25-65years were selected by simple random sampling method and the study indicated that the prevalence of obesity among women in Madurai city is nearly, 11.4 per cent. Similarly, in the present study, aspects pertaining to the socio economic profile of the respondents revealed that a high prevalence of overweight and obesity was seen among Hindu respondents, married and those who were above 30 years, women with 1 or 2 children, women who had college education were likely to be obese. Besides, housewives and other dependent ladies in the family with sedentary nature of work, middle and high income, nuclear families and urban residing women were more obese than their counterparts. Therefore the selected socioeconomic parameter can be regarded as significant predictors of obesity.
Keywords: NFHS National Family Health Survey, Std- standard
Full Text:
INTRODUCTION
Unhealthy lifestyle, food habits and other substance abuse underlie much of the noncommunicable disease epidemics. Excess body weight poses one of the most serious public health challenges of the 21st century. During the past few decades, prevalence of obesity has grown to epidemic proportions and is regarded as the major contributor to the global burden of diseases (Koon, 2002). A growing number of adults, children and adolescents around the world, are facing the danger of becoming obese. Obesity is more common in women, but men are more likely to be overweight. Comparison of NFHS-2 (1998-1999) and NFHS-3 (2005-2006) data indicated that prevalence of obesity among Indian women has elevated from 10.6 to 12.6 per cent with an increment of 24.5 per cent between the years 1998-1999 and 2005-2006 and accordingly, TamilNadu ranks 4th in the order of prevalence of obesity. Since obesity is more common among women than in men, a study on ?Prevalence of Overweight and Obesity among women in Madurai city? was taken up.
Objectives
1. To assess the prevalence of overweight and obesity among women in Madurai city
2. To compile the socio-demographic profile of BMI grade in the selected respondents
MATERIALS AND METHODS
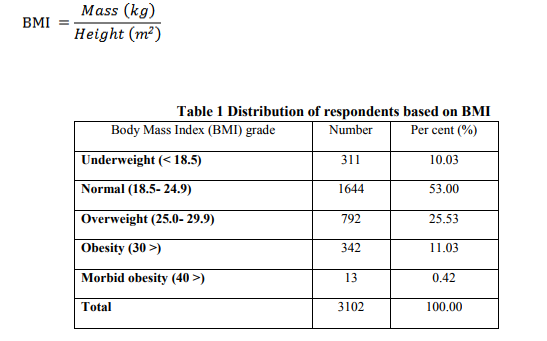
By simple random sampling method, 3102 women respondents in age group 25-65 years were selected from hospitals, banks, offices, Government and private schools and colleges, business enterprises, NGOs and households in and around Madurai city. Their anthropometry measurements like height and weight were recorded. All the samples were screened for obesity by calculating their Body Mass Index (BMI) using the universally accepted BMI formula
The total number of respondents (N=3102) were categorized as underweight, normal, overweight and obese based on WHO (1997) BMI classification. Using proportionate stratified random sampling method, 300 women in each of the four BMI categories, i.e., 1200 women were selected randomly.
RESULTS AND DISCUSSION
Several factors have been linked to obesity that significantly influence the prevalence of overweight and obesity across different socioeconomic groups.
1. Prevalence of overweight and obesity among women
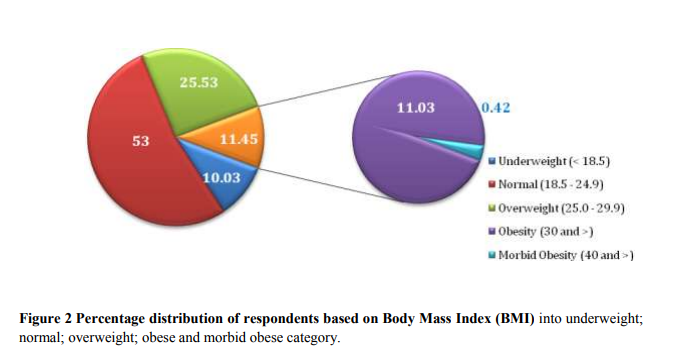
Table 1 and Figure 2 portray the distribution of respondents based on BMI
Out of 3102 women respondents (age group of 25-65 yr) screened, significant portion (1644 respondents; 53%) were in the normal BMI. The number of underweight respondents was 311, corresponding to 10 per cent of the total sample. As much as 792 respondents were in the overweight category corresponding to 26 per cent of the total sample. Likewise, 342 (11%) were obese and 13 (0.42%) were morbid obesity, indicating that the prevalence of obesity among women in Madurai city is nearly, 11.4 per cent.
2. General profile of the respondents
The general profile of the respondents in the present study includes aspects such as religion, age, marital status, number of children, educational status, occupation, nature of the job, total income of the family, type of family and place of residence. The variables that significantly contribute for overweight and obesity were included in the general profile.
2.1 Religion and body mass index
Classification of the respondents (N=1200) into different categories of body mass index (BMI) grade based on religion was shown in Table 2
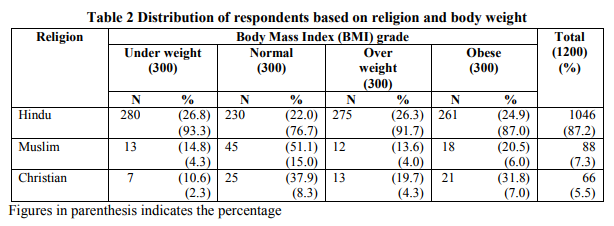 A significant proportion of women respondents were Hindu (87.2%) followed by Muslim (7.3%) and Christian (5.5%) respectively. From the data it could be observed that prevalence of obesity among women significantly differed by religion. Data of the present study fall in line with the study conducted by Agrawal (2002) where Hindu women were reported to be more overweight and obese than Christian.
2.2 Age and body weight
Mishra (2004) stated that overweight and obese increase rapidly with age. Women in the age group of 40-49 year are more than 12 times as likely to be overweight or obese as women in the age group of 15-19 year. Whitney and Rolfes (2002) indicated that adult in the age group of 25 -55 years gain an average of ½ pound per year. As age is one of the major determining factors of obesity, it was decided to establish relationship between age and body weight among the respondents. Table 3 shows the distribution of respondents based on age in relation to BMI.
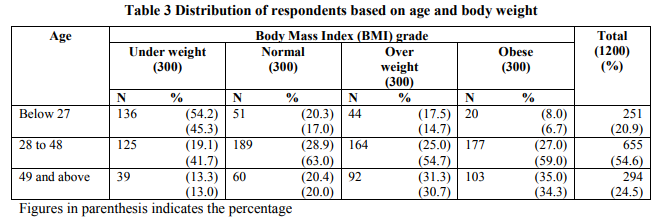
Based on the raw data, quartiles were calculated. Using quartile values three categories of age group were computed. In the overweight category more women were in the age group of 28 to 48 years followed by those who were above 49 years. The reason behind this fact is that growing number of urban Indian women aged 35+ are the victim of sedentary lifestyles, rich food, lack of exercise and a gradual slowing down of metabolic rate. Similarly, obesity is more common among women (59.0%) in the age group of 28-48 years followed by those above 49 years (34.3%). Average statistics show that people who are between forty to forty-five are twenty to thirty pounds heavier than they were when they were twenty years of age. The present data shows that over weight and obesity is high among women in the 30 plus than among women in the early fifties. While overweight and obesity is least among women in the age below 27 years.
2.3 Marital status and body weight
In women, onset of obesity is more common during pregnancy and menopause. Table 4 portrays the distribution of respondents based on marital status and body weight.
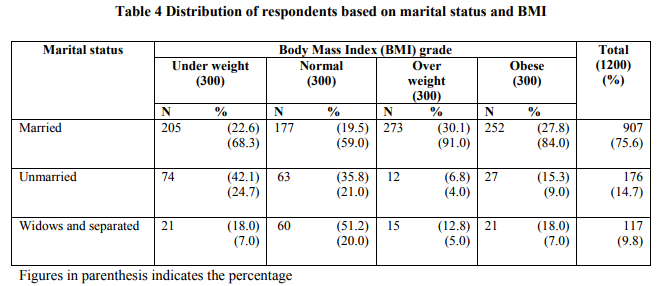
In the present study, majority of the respondents 75.6 per cent were married, 14.7 per cent were unmarried and only 9.8 per cent were widows and separated women. However, in the overweight category as much as 91.0 per cent of the respondents were married followed by 4.0 per cent unmarried and 5.0 per cent widow and separated women. Results of the present study clearly indicate that women according to Indian culture usually put on weight after marriage. Data indicates that obesity rate is high among married women (84.0%) than unmarried women (9.0%). Based on the results of the present study and the literature it is concluded that married women are more likely to be overweight and obese than unmarried women.
2.4 Number of children and body weight
Table 5 shows the distribution of respondents based on the number of children and body weight.
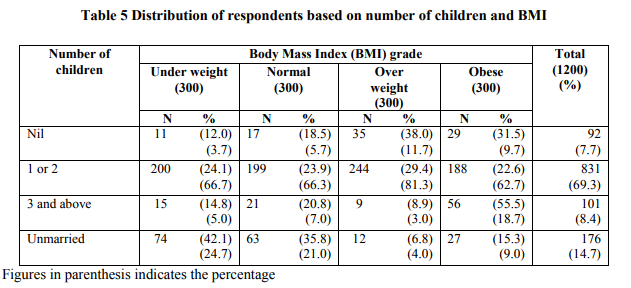
It is interesting to note that out of 300 respondents in the underweight grade about 66.7 per cent of women have one or two children, 5.0 per cent have three or four children, only 3.7 per cent had no issues. As much as 24.7 per cent in the underweight grade were unmarried. However, in the case of overweight and obese grade slight variation was observed, among the respondents, major share overweight (81.3%) and obese (62.7%) were represented by respondents with 1 or 2 children. Data indicates that there is no relationship between the number of children and the BMI grade. Similar data was obtained by Krishnaswamy (2003) that in women, obesity develops just around pregnancy and after menopause.
2.5 Education level and body weight
Agrawal (2002) reported that educated women are more obese and overweight when compared to others.Several studies show association between education and bodyweight, therefore, it was decided to establish the same in the present study. Table 6 portrays distribution of respondents based on their educational level and body weight.
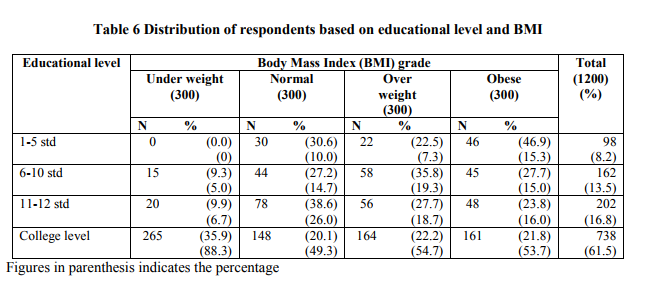
Table 6 shows a high level of 54.7 per cent of overweight women had college education and it is surprising to see almost a similar 53.7 per cent of obese women had college level education. Overall data reveals that 46.3 per cent obese women had only school education. Likewise 45.3 per cent of overweight women had only school education which reveals social factors such as low educational level also contribute to a predisposition to obesity.
2.6 Occupation and body weight
It has been well established that occupation significantly influences weight gain. Lifestyle and status of an individual is determined by the occupation. Table 7 indicates the distribution of respondents based on occupation and body weight.
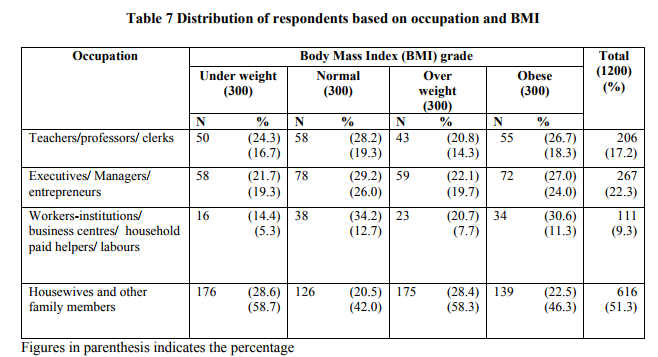
Working status of women shows that more than half (51.3%) of the respondents do not engage in remunerative jobs. Among those working women 17.2 per cent were by profession teachers, professors and clerks, 22.3 per cent were executives. Managers and entrepreneurs and the remaining 9.3 per cent as workers in institutions, sales workers in business centres, household paid helpers and labours. From Table 7, it is clear that among those who were overweight and obese a higher percentage of them (58.3% and 46.3% respectively) were housewives. Next to housewife, women whose occupation is related to teaching profession and clerical were mostly (14.3%) overweight and (18.3%) obese due to its sedentary nature.
2.7 Nature of work and body weight
Globalization is also playing an important role for modernization and sedentary life. In this study respondent‘s occupation were classified as sedentary, moderate and heavy. Teaching, clerical and work of house wives were categorised as sedentary work, the work of the administrators and entrepreneurs as moderate work and the last category viz., paid helpers, scavengers and cleaners‘ work as heavy. Table 8 reveals the distribution of respondents based on their nature of work and body weight.
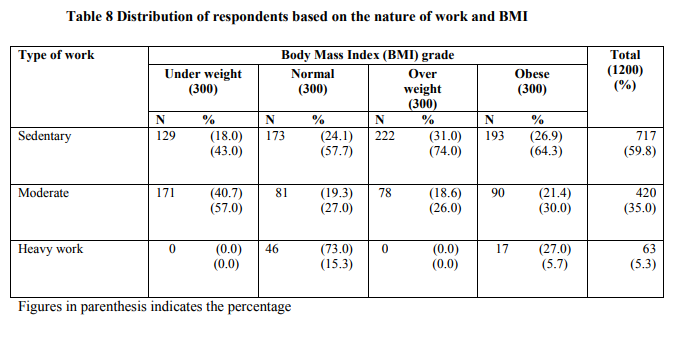
It is clear from Table 8 that among the total respondents majority (59.8%) are engaged in sedentary work, 35.0 per cent perceived their work as moderate and among the low paid workers only 5.3 per cent expressed that their work as heavy when compared to other counter parts. Among the overweight respondents (74.0%) and obese (64.3%) a higher percentage of women with sedentary type of work followed by those who do moderate work. It is obvious that under weight and overweight women did not engage in heavy work as they are not fit for it. Only 5.7 per cent of obese were in heavy work because of their low educational status, they were forced to work as labourers in spite of their body weight. It is understood that from the study that high percentage of overweight and obese respondents were doing sedentary work and thus it is concluded that sedentary work is prone to overweight and obesity.
2.8 Monthly income and body weight
Obesity is more prevalent among people in the lower socio-economic strata in the developed countries where as in developing countries obesity is a problem more common in the higher socio-economic strata (Shah et al., 2004). Likewise, Minna et al (2009) pointed out that household income is the strong indicator and predictor of obesity among women. Hence, it was decided to relate income to obesity in the present study. Table 9 portrays the distribution of respondents based on their family‘s monthly total income and body weight.
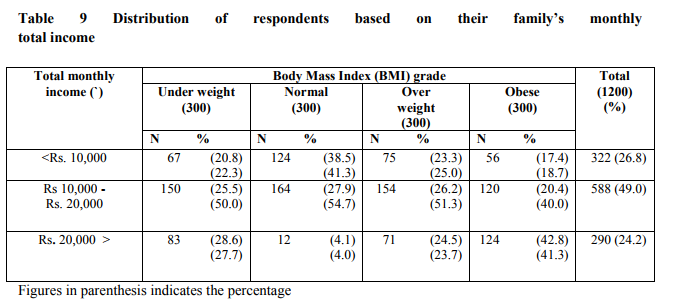
When the influence of total monthly income on body weight was analysed, a positive correlation between income and obesity was obtained. Further, it was observed that as the income increases level of obese also increases, however, this relationship doesn‘t hold good for other BMI grade. Further, distribution of the respondents in this group pertaining to overweight and obesity were 51.3 and 40.0 per cent respectively. Results infers that women from high socio-economic group whose total monthly family income was more than Rs.20, 000 were found to be overweight (23.7%) and obese (41.3%). Data indicates that substantial proportions of women belonging to high standard of living were overweight or obese.
2.9 Type of family and body weight
In the present era the concept of traditional family is disappearing, globalization has changed the lifestyle of women on the whole. Preliminary data suggested that emergence of nuclear family could be the influential factor in the body weight. Hence, this aspect was taken into consideration. Table 10 indicates the distribution of respondents based on their type of family and BMI.
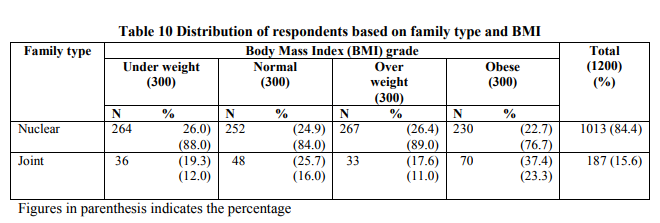
From Table 10 it could be inferred that nearly 84.4 per cent respondents were nuclear family and the remaining 15.6 per cent were from joint family. Analyses of the data revealed that majority of the respondents were working women. Madurai being a city the concept of nuclear family is on par with the global trend. Since, majority of the respondents were from nuclear family system, among the obese respondents more than three fourth women are from nuclear family.
2.10 Domicile and body weight
Agrawal (2002), observed that percentage of obese and overweight women are comparatively high in urban than in sub-urban area. Table 11 shows the distribution of respondents based on their domicile into various grades of BMI.
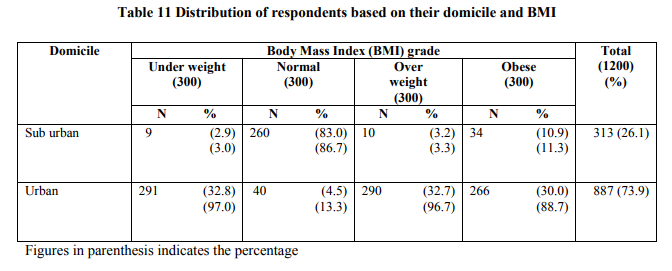
Majority of respondents in the underweight grade (97%) and overweight women (96.7%) were from urban area of Madurai. Overall distribution of the respondents in the overweight and obese grade into sub-urban and urban domicile indicated that the distribution was 3.3 and 96.7 (over weight) and 11.3 and 88.7 (obese) respectively. Data of the present study also proved that the prevalence of obesity among women in urban residents of Madurai is high. The association of obesity with urban-dwelling is consistent with previous reports and was found to be the most important determinant of obesity.
CONCLUSION
In the present study, aspects pertaining to the socio economic profile of the respondents revealed that a high prevalence of overweight and obesity was seen among Hindu respondents, married and those who were above 30yrs, women with 1 or 2 children, women had college education were likely to be obese. Besides, housewives and other dependent ladies in the family with sedentary nature of work, middle and high income, nuclear families and urban residing women were more obese than their counterparts. Therefore the selected socioeconomic parameter can be regarded as significant predictors of obesity.
References:
1. Agrawal PK. Emerging obesity in Northern Indian States: A serious threat for health, Paper presented at the IUSSP Regional Conference, Bangkok, 2002, 10-13
2. Minna K, Salonen, Eero Kajantie, Clive Osmond, et al., ?Role of Socioeconomic Indicators on Development of Obesity from a Life Course Perspective,? Journal of Environmental and Public Health 2009, 7: 2009.
3. Mishra V, Effect of obesity on asthma among adult Indian women. Intern J Obesi 2004, 28:1048-1058
4. National Family Health Survey, Mumbai: International Institute for Population Sciences, 2006; Data is shown in the order of percentage prevalence of obesity among females in different states of India.
5. Koon PB. Prevalence of overweight and obesity using various BMI for age sanders among younger adolescents in kulalampur. Asia Pacific J Clin Nutr 2002, 20: 574-579
6. Krishnaswamy K. Dietary guidelines for Indians a manual, National Institute of Nutrition, Indian Council of Medical Research, Hyderabad, India 2003
7. Shah SM, Nanan D, Rahbar MH, Rahim M, Nowshad G. Assessing obesity and overweight in a high mountain Pakistani population. Trop Med Int Health 2004, 9: 526-532.
8. Whitney EN, Rolfes SR. Understanding nutrition. 9th Ed. Belmont, CA: Wadsworth 2002
9. World Health Organization (1997), Obesity: Preventing and Managing the Global Epidemic: report of a WHO Consultation on Obesity, Geneva.
|
 IJCRR
IJCRR 


 This work is licensed under a Creative Commons Attribution-NonCommercial 4.0 International License


