IJCRR - 4(13), July, 2012
Pages: 114-118
Date of Publication: 18-Jul-2012
Print Article
Download XML Download PDF
AUTOMATIC MEDICAL IMAGE SEGMENTATION USING SPATIAL FUZZY CLUSTERING METHOD
Author: R.Aishwarya
Category: General Sciences
Abstract:The performance of the set segmentation is subject to appropriate initialization and optimal configuration of controlling parameters, which requires substantial manual intervention. A new fuzzy level set algorithm is proposed in this paper to facilitate medical image segmentation. Moreover fuzzy level set algorithm is enhanced with locally regularized evolution. Such improvements facilitate level set manipulation and lead to more robust segmentation. Performance evaluation of the proposed algorithm was carried on medical images from different modalities .the results confirm its effectiveness for medical image segmentation.
Keywords: Fuzzy logic, Clustering, Image segmentation, Level set method.
Full Text:
INTRODUCTION
Segmentation is defined as partitioning portions of an image. It adds structure to a raw image. In the case of medicine, this can involve identifying which portions of an image is the tumor, or separating white matter from grey matter in a brain scan. Segmentation is a vital aspect of medical imaging. It aids in the visualization of medical data and diagnostics of various dieses. The result of image segmentation is a set of segments that collectively cover the entire image, or a set of contours extracted from the image (see edge detection). Each of the pixels in a region are similar with respect to some characteristic or computed property, such as color, intensity, or texture. Adjacent regions are significantly different with respect to the same characteristic(s). When applied to a stack of images, typical in Medical imaging, the resulting contours after image segmentation can be used to create 3D reconstructions with the help of interpolation algorithms like marching cubes. we will restrict most of our discussion to approaches that generalize the statistical inference beyond first and second moments to entire probability density functions (pdf). From this, segmentation can be reinterpreted as measuring the ?distance? between two distributions via a similarity metric. we relax the assumption of a-priori knowledge, and focus on the accurate segmentation of biological structures or pathologies found in medical imagery. A qualitative comparison between the Bhattacharyya distance and our newly proposed metric is then done to highlight the notion that similarity measures can not be applied equally for image segmentation. In particular situations, one distribution metric may prevail while another measure may be highly dependent on the initialization or statistical information. To the best of our knowledge, a qualitative comparison of segmentation results has not been made.
Digital Image Segmentation
Image segmentation plays an important role in image analysis and computer vision. The goal of image segmentation is partitioning of an image into a set of disjoint regions with uniform and homogeneous attributes such as intensity, color, tone etc. The image segmentation approaches can be divided into four categories; thresholding, clustering, edge detection, and region extraction. In color images, the boundaries between objects are blurred and distorted due to the imaging acquisition process. Furthermore, object definitions are not always crisp and knowledge about the objects in a scene may be vague. Segmentation is a vital aspect of medical imaging. It aids in the visualization of medical data and diagnostics of various dieses. This report presents an implementation of a level set approach for active contour image segmentation. This method is originally developed by Osher and Sethian and then applied to image segmentation by Malladi. No requirements about objects‘ shape and allowance for very flexible topology change are key advantages for this method. Partitional clustering essentially deals with the task of partitioning a set of entities into a number of homogeneous clusters, with respect to a suitable similarity measure. Due to the fuzzy nature of many practical problems, a number of fuzzy clustering methods have been developed following the general fuzzy set theory strategies outlined by Zadeh, The main difference between the traditional hard clustering and fuzzy clustering can be stated as follows. While in hard clustering an entity belongs only to one cluster, in fuzzy clustering entities are allowed to belong to many clusters with discerent degrees of membership.
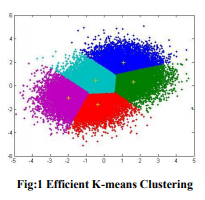
Partitional clustering essentially deals with the task of partitioning a set of entities into a number of homogeneous clusters, with respect to the fuzzy cluster structure relates to the data from which it is derived, from this different clusters and shapes can be identified. The data is generated from a cluster structure identified. Image segmentation plays an important role in image analysis and computer vision. The goal of image segmentation is partitioning of an image into a set of disjoint regions with uniform and homogeneous attributes such as intensity, color, tone etc. The image segmentation approaches can be divided into four categories; thresholding, clustering, edge detection, and region extraction. In color images, the boundaries between objects are blurred and distorted due to the imaging acquisition process. Furthermore, object definitions are not always crisp and knowledge about the objects in a scene may be vague. Fuzzy set theory and Fuzzy logic are ideally suited to deal with such uncertainties. Fuzzy clustering models have proved a particularly promising solution to the color clustering problem. Such unsupervised models can be used with any number of features and clusters. The Fuzzy C means (FCM) algorithm, proposed by Bezdek (1981), is the first and most widely used algorithm in image segmentation because it has robust characteristics for ambiguity and can retain much more information than hard segmentation methods. Clustering The notion of a cluster varies between algorithms and is one of the many decisions to take when choosing the appropriate algorithm for a particular problem. A clustering is essentially a set of such clusters, usually containing all objects in the data set. Additionally, it may specify the relationship of the clusters to each other, At first the terminology of a cluster seems obvious: a group of data objects. However, the clusters found by different algorithms vary significantly in their properties, and understanding these cluster models is key to understanding the differences between the various algorithms. Typical cluster models include: Connectivity models: for example hierarchical clustering builds models based on distance connectivity. Centroid models: for example the k-means algorithm represents each cluster by a single mean vector. Distribution models: clusters are modeled using statistic distributions, such as multivariate normal distributions used by the Expectation-maximization algorithm. Density models: for example DBSCAN and OPTICS defines clusters as connected dense regions in the data space. Subspace models: in Biclustering (also known as Co-clustering or two-mode-clustering), clusters are modeled with both cluster members and relevant attributes. Group models: some algorithms (unfortunately) do not provide a refined model for their results and just provide the grouping information. A hierarchy of clusters embedded in each other. Clusterings can be roughly distinguished in:
hard clustering: each object belongs to a cluster or not soft clustering (also: fuzzy clustering): each object belongs to each cluster to a certain degree (e.g. a likelihood of belonging to the cluster).
Fuzzy Clustering
Clustering is the process of dividing the data into homogenous regions based on the similarity of objects; information that is logically similar physically is stored together, in order to increase the efficiency in the database system and to minimize the number of disk access. The process of clustering is to assign the q feature vectors into K clusters, for each kth cluster Ck is its center. Fuzzy Clustering has been used in many fields like pattern recognition and Fuzzy identification. A variety of Fuzzy clustering methods have been proposed and most of them are based upon distance criteria. The most widely used algorithm is the Fuzzy C-Mean algorithm (FCM), it uses reciprocal distance to compute fuzzy weights. This algorithm has as input a predefined number of clusters, which is the k from its name. Means stands for an average location of all the members of particular cluster and the output is a partitioning of k cluster on a set of objects. The objective of the FCM cluster is to minimize the total weighted mean square error: The FCM allows each feature vector to belong to multiple clusters with various fuzzy membership values . Then the final classification will be according to the maximum weight of the feature vector over all clusters. The detailed algorithm: Input: Vectors of objects, each object represent s dimensions, where v = {v1,v2,……,vn} in our case it will be an image pixels, each pixel has three dimensions RGB, K = number of clusters. Output = a set of K clusters which minimize the sum of distance error. Algorithm steps: (1) Initialize random weight for each pixel, it uses fuzzy weighting with positive weights {Wqk } between [0, 1]. (2) Standardize the initial weights for each qth feature vector over all K clusters via (3) Standardize the weights over k = 1,…,K for each q to obtain Wqk
SIMULATION RESULTS
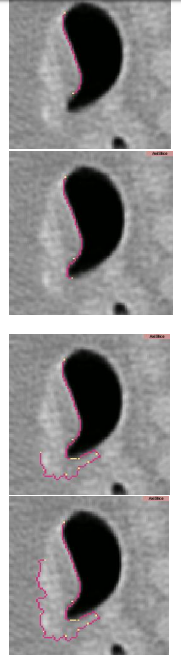
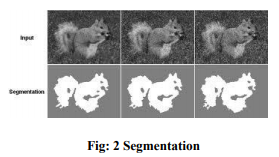
We test our region-based segmentation model on several images, which further demonstrates the viability and possible advantage of our distribution metric for image segmentation. A common example that is often tested with energy models that discriminate on probability distributions is the zebra image. The goal here is to capture the entire zebra by separating the distributions so as to obtain a bimodal ?Object? with a unimodal background. We note that several segmentation methods have been able to capture this image. However, for the sake of completeness, we show results in Figure 4. Stages of the segmentation are shown along with the corresponding plots of the probability distributions. Segmenting biological structures from medical images is often a challenging task. This is due to the inherent inhomogeneous distribution of a photometric variable as well as the low contrast and noise (as seen in the Kaposi Sarcoma). In the remaining examples, we segment both the corpus callosum and an MRI image of a heart.
CONCLUSION
We introduce a new metric for image segmentation that quantifies the ?distance? between two distributions as the standard deviation of the difference between logarithms of those densities. While several metrics and measures have been proposed for image segmentation, results often vary drastically. Specifically, although separating distributions using the Bhattacharyya distance as a measure has resulted in the successful segmentation on some challenging imagery, in other cases such as the Kaposi Sarcoma, the Bhattacharyya - based algorithm fails to capture the infected portion of the skin while the energy model proposed in this paper results in a successful segmentation. The differing segmentation results can be traced to how the respective metrics penalize perturbations on a manifold of distributions. Thus, a subject of future work is to investigate and clarify how differences in metrics affect segmentation.
References:
1. X. Han, C. Xu and J. Prince, ?A topology preserving level set method for geometric deformable models?, IEEE Trans. Patt. Anal. Mach. Intell., vol. 25, pp. 755-768, 2003.
2. J. Gomes and O. Faugeras, ?Reconciling distance functions and Level Sets?, J. Visiual Communic. and Imag. Representation, vol. 11, pp. 209-223, 2000.
3. R. Malladi, J. A. Sethian, and B. C. Vemuri, ?Shape modeling with front propagation: a level set approach?, IEEE Trans. Patt. Anal. Mach. Intell., vol. 17, pp. 158-175, 1995.
4. T. Georgiou, ?Distances and riemannian metrics for spectral density functions,? IEEE Trans. on Signal Processing (8), pp. 3395– 4003, 2007.
5. B. Vemuri and Y. Chen, ?Joint image registration and segmentation", Geometric Level Set Methods in Imaging, Vision, and Graphics, Springer, pp. 251-269, 2003.
6. Chen Zhang and Shixiong Xia, ? K-means Clustering Algorithm with Improved Initial center,? in Second International Workshop on Knowledge Discovery and Data Mining (WKDD), pp. 790-792, 2009.
7. P. Bradley, U. Fayyad, Refining initial points for k-means clustering, Proceedings 15th International Conf, on Machine Learning, San Francisco, CA, 1998, pp. 91-99.
8. J. Pena, J. Lozano and P. Larranaga, An Empirical comparison of four initialization methods for the k-means algorithm, Pattern Recognition Letters Vol. 20, 1999.
9. S.L.Chiu, Fuzzy model identification based on cluster estimation, Journal of Intelligent and Fuzzy Systems.
10. Kiyotaka Mizutani and Sadaaki Miyamoto, Possibilistic Approach to Kernel- Based Fuzzy c-Means Clustering .
|
 IJCRR
IJCRR 


 This work is licensed under a Creative Commons Attribution-NonCommercial 4.0 International License


