IJCRR - 4(13), July, 2012
Pages: 59-67
Date of Publication: 18-Jul-2012
Print Article
Download XML Download PDF
PHYTO-SOCIOLOGICAL STUDY OF FOREST ECOSYSTEM IN YUSMARG FOREST: A HILL RESORT OF KASHMIR VALLEY, INDIA
Author: Samia Ashraf, Rouf Ahmad Bhat, Ashok. K. Pandit
Category: General Sciences
Abstract:The increasing anthropogenic pressure especially increasing influx of tourists at health resorts in mountainous regions decreases the distribution of trees in the given area, which ultimately affects the variety, variability, uniqueness and distribution pattern in Forest Ecosystem. The area belongs to temperate region of Pir Panjal mountain range. In order to cope up with this situation a phyto-sociological
study was carried out during the month of May to December 2010. The main objective of the study was to determine the distribution pattern of tress and impact of tourist on forest ecosystem. The study was based on three sites with marked differences in their physical and biotic features. The composition and the number of tree species were recorded by quadrat method. Quadrates of size (10m×10m) were randomly laid. During the study period, the only tree family observed was Pinaceae. The total IVI was observed highest (135.7) for Abies pindrow at site3 and lowest (74.7) total IVI was observed for Pinus wallichiana at site1. The total relative density was observed highest (51.1) for Abies pindrow at site3 and lowest (21.2) was observed for Pinus wallichiana at site1. Shannon Weiner diversity Index having small
variation during the study period. Dominance index (Simpson Index) was less than 1 which showed that
the sites were not dominated by single species. The distribution pattern of trees was random. The primary conclusion is, there is a moderate anthropogenic impact on normal distribution of tree community which may cause decrease in tree line within next few decades in the forest ecosystem.
Keywords: Yusmarg, Abies pindrow, Pinaceae, Tourists, Anthropogenic
Full Text:
INTRODUCTION
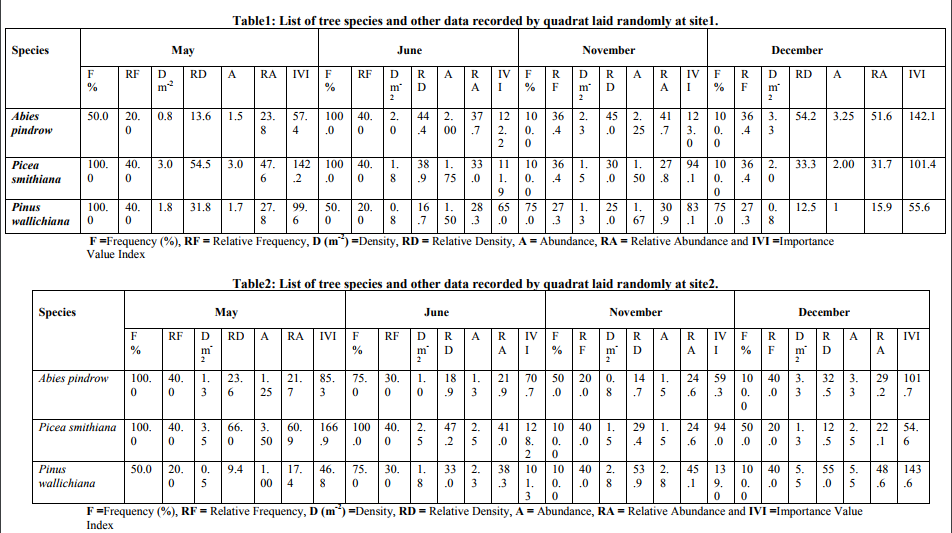
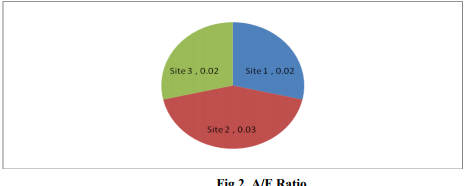
The structural property of a community is the quantitative relationship between the species growing around. The earth‘s vegetation includes all plant forms wherever and what they may be, and most have yielded to a phyto-sociological approach of one type or another. Phyto-sociology aims to characterize and classify communities in terms of their composition and structure, and therefore has a place under plant ecology. The quantitative study of vegetation is called phytosociology and its principle aim is to describe the vegetation, explain or predict its pattern and classify it in a meaningful way (Ilorkar and Khatri, 2003). A sound understanding of the richness of species is necessary for appropriate conservation and restoration of the biological diversity. Forests are important landscape units in any region because they consist of both flood-resistant species and immigrants from the adjacent uplands, thereby comprising most of the regional floristic biodiversity and protect natural beauty by holding soil firmly which in turn supports other living activities directly to flora and indirectly to the fauna life. Forest floor vegetation plays an important role in nutrient cycling, habitat conservation and regeneration of trees shrubs. Trees subjected to periodic flooding often compensate anaerobic soil conditions by developing morpho-anatomical adaptations and by reducing metabolism during the waterlogged period, resulting in decreased photosynthetic rates, leaf shedding, and reduced wood growth and cambial dormancy(Fernandez et al., 1999; Parolin et al., 2004;Worbes 1997).Inundation is thus a powerful factor selecting the occurrence and distribution of tree species (Jackson and Colmer 2005), which in turn influences structure and biomass of seasonally flooded tree species communities. Nunes da Cunha and Junk (2001) investigated the distribution of woody plant communities in the northern part of the Pantanal near the city of Poconé in terms of habitat preference and found approximately 40 floodresistant tree species, most of them showing a wide distribution range on the topographic gradient, from areas with prolonged flooding to dry habitats that become flooded only during extreme flood events. It is a well known fact that the altitude represents a complex gradient along which many environmental variables change concomitantly. Rahbek (1997) explain the patterns in species richness decrease with altitude. Besides the ecosystem functions the distribution and occurrence of species had been affected by human interventions (Singh et al., 1987). The vegetation diversity of forest ecosystems is influenced by topography, soil, climate and geographical location of the region. There is a great diversity in the floristic pattern due to altitudinal variation, and rainfall (Arora 1995). Jammu and Kashmir possesses vast forests stretching from the lower valleys high up into mountain passes right to the edge of massive glaciers and vary according to both altitude and climatic conditions. They range from the tropical deciduous forests to temperate forests. Jammu and Kashmir's forests include a wide variety of species including evergreens, Pine, Laurel, Sal, Oak, Magnolia, Cedar, Birch, Spruce and Juniper. MATERIAL AND METHODS Study Area Yusmarg health resort situated at 33°49 '42"N latitude and 74° 39' 59"E longitudes, 2712 m above sea level (a.s.l) and is approximately 47 km to the southwest of Srinagar and lies in the Budgam district of Jammu and Kashmir . It is a cluster of meadows bounded by magnificent trees in the lap of Pir Panjal mountain range. Grassy pastures are stretching to acres of land, the dense forests full of pine trees and snow capped mountains presents a splendid look. A river, known by the name of Doodh Ganga (Doodh=milk and Ganga= from river Ganga) frothing and crashing on its way over the rocks makes a little white foam, which gives it this name. The hills comprise of a number of several peaks, namely Tatta Kutti, Sang Safed etc. It is reputed for having some unique spring flowers. It also has some of the highest peaks in Pir-Panjal range like Tatakoli 4725m, Romesh Thong 5000m and Sunset peak 4746m. The town of Yusmarg enjoys a temperate climate. Precipitation in Yusmarg is normally in the form of mild snowfall during the winters. Summers are mild and warm, and winters are very cold. The average temperature in summers ranges between 20-25°C, while temperatures start coming down from September, winters are very cold and temperatures dips in sub-zeros. Study Sites Site1: Near the edge of Meadows This site is situated at 33°50´00.6?N latitudes, 74°40´08.6?E longitudes at an elevation of 2436 m on way to Nilnag Coniferous forest. This site was located opposite to JK TDC HUTS and near to the grazing area, dominated with Coniferous tree species and having rough and sloppy topography. Site2: In Between Upper and lower Reaches of Forest Beat This site is situated at 33° 50´ 08. 3? N latitudes, 74° 40´ 57.2? E longitudes and at an elevation of 2445m above mean sea-level and having sharp steepness compared to site1. Site 3: Bushy Forest area This site is situated at 33° 50´ 16.2? N latitudes, 74° 39´ 43.9?E longitudes and at an elevation of 2400m above mean sea-level, with less diverse of herbs but dominated with shrubs. Study sites and study area shown in figure1. Sampling and Collection Information was gathered using a variety of methods to gain a better understanding of the present condition of Yusmarg forests, perspectives and priorities. Site survey and sampling for three representative sites was carried out during May to December (2010). The composition and number of tree species at each site was recorded by quadrat method. Quadrates were laid out randomly throughout the selected forest stands by taking quadrates of size 10m × 10 m. The size and the number of quadrates were determined following (Misra, 1968; Kershaw, 1973). In each quadrates, trees were recorded with >31.5 cm Circumference at breast height (cbh) i.e. 1.37m above the ground) individually measured and quantitatively analyzed for abundance, density and frequency according to the formulae given by Curtis and Mc Intosh (1950) and Mishra (1968). The relative values were summed up to represent Importance Value Index (IVI) Curtis (1959). The diversity index (H‘) was computed by using ShannonWiener information Index (Shannon and Wiener, 1963). The concentration of dominance (CD) was computed by Simpson‘s Index (Simpson, 1949). RESULTS Plant species that were found during study period include trees as Abies pindrow, picea smithiana and Pinus wallichiana. The research analysis of data as presented in table 1 revealed that at site1, the density and IVI was highest in the month of May for Picea smithiana as 3 and 142.2, followed by Pinus wallichiana 1.8 and 99.6 respectively. In the month of June Abies pindrow have 2.0 and 122.2 density and IVI followed by Picea smithiana as 1.8 and 111.9 (Table 1). In November and December Abies pindrow was having highest density and IVI as 2.3 and 123.0, 3.3 and 142.1, followed by Picea smithiana 1.5 and 94.1, 2.0 and 101.4 respectively. Overall density and IVI values were obtained highest for Abies pindrow as 2.1 and 111.5, and for Picea smithiana 2.1 and 111.3, table4. At site2,the density and IVI was highest in the month of May for Picea smithiana 3.5 and 166.9 followed by Abies pindrow 1.3 and 85.3 .In the month of June density and IVI was highest for Picea smithiana 2.5 and 128.2 ,followed by Pinus wallichiana 1.8 and 101.3 respectively . In November and December Pinus wallichiana was having highest density and IVI as 2.8 and 139, 5.5 and 143.6 respectively.But in the month of November second highest values were obtained for Picea smithiana with density and IVI 1.5 and 94 and in December Abies pindrow with density and IVI was 3.3 and 101.7,depicted in table2. The overall values of density and IVI was highest for Pinus wallichiana 2.6 and 113.9, followed by Picea smithiana 2.2 and 100.4 respectively (Table 4). At site3, the density and IVI was highest in the month of May for Abies pindrow 1.3 and 112.5 followed by Picea smithiana 1 and 97.5. In the month of June Abies pindrow again having highest density and IVI 1.8 and 123.2 followed by Pinus wallichiana 1.3 and 97.9 Table 3. Similar trend was followed in the November and December with highest density and IVI of Abies pindrow followed by Pinus wallichiana 2.8 ,120.8 ; 3.3, 177.2 and 2.0 , 97.7 ; 0.8 and 67.4 respectively (Table 3). Overall density and IVI values were higest for Abies pindrow 2.3 and 135.7 followed by Pinus wallichiana 1.2 and 88.4 (Table 4). Diversity Indices Index of dominance also called Simpson index observed 0.32 at site1 and at site2, and 0.34 at site3, depicted in table5. The mean value of Shannon-Weiner index observed 1.06 at site1, 1.05 at site2 and 1.04 at site3 respectively during the study period. Evenness Index observed 0.97, 0.96 and 0.95 at site1, site2 and at site3 respectively, presented in table5. Abundance/ Frequency (A/F) ratio observed 0.02 at site1 , 0.03 at site 2 and 0.02 at site 3.These results showed random spatial distribution in case of tree species, (Table 6). DISCUSSION Phyto-sociological studies incorporate mainly the description of plant composition, floristic communities and the functional aspects. Plants in nature occur in repeating groups of associated plants called communities. The structure of a community is determined mainly by the dominating plant species and not by other characteristics (Odum, 1971). All these species are not equally important but there are only a few overtopping species which by their bulk and growth modify the habitat and control the growth of other species of the community as these species are called dominants (K. J. Gaston, 2000).Total 3 tree species belonging to Pinaceae family were recorded on the three sampling sites. Total density/m2 varied for trees from 2.6 to 0.9 at site2 and site3 respectively. For a particular species, higher frequency indicates its more frequent distribution at sites due to optimum soil and environmental conditions. Picea smithiana showed 100% frequency at site1 and near values was obtained at site 2 while 93.8% frequency was reported in case of Abies pindrow at site 3. The higher value of IVI indicates that all the available resources are being utilized by Abies pindrow and Picea smithiana species and left over are being trapped by specie at site1, at site2 Pinus wallichiana having highest IVI followed by Picea smithiana. Abies pindrow having highest IVI at site3. Moreover, each species of a community plays specific role and there is a definite quantitative relationship between abundant and rare species (Bhandari et al., 1999).The high IVI of a species indicated its dominance and ecological success, its good power of regeneration and greater ecological amplitude. Abies pindrow showed maximum IVI values at two sites and therefore emerged as a dominant species of the ecosystem. A/F ratio was used to assess the distribution pattern of the species. Distribution pattern indicated that most of plots species are distributed contagiously (clumped) followed by randomly. The distribution of tree species was mainly random at all sites. Similar findings have been reported for Central Himalayan forests by different workers (Saxena and Singh, 1982; Bhandari and Tiwari, 1997), Kershaw, (1973) and Singh and Yadava, (1974). Odum (1971) described that in natural conditions; contagious (clumped) distribution is the most common type of distribution and is performed due to small but significant variations in the environmental conditions. Preponderance of random distribution in tree as compared to shrub layer reflects the dimension of biotic interferences in these strata. Diversity is a combination of two factors, the number of species present, referred to as species richness and the distribution of individuals among the species, referred to as evenness or equitability. Single species populations are defined as having a diversity of zero, regardless of the index used. Species diversity therefore, refers to the variations that exist among the different forms. In the present study Shannon - Wiener index of diversity has been used. The Shannon index (H') of diversity for trees was maximum (1.06) at site 1 followed by (1.05) at site 2 and (1.04) at site 3. Simpson‘s index (Cd) was maximum (0.34) at site 3 followed by (0.32) at site 1 and site 2 for trees
CONCLUSION
The primary conclusion is, there is a moderate anthropogenic impact on normal distribution of tree community which may cause decrease in tree line within next few decades in the forest ecosystem. Priority should be given to protect tree line especially saplings so that large gaps in forest area would be replaced with healthy forest ecosystem in future.
ACKNOWLEDGEMENT
The authors‘ great appreciation is due to Yusmarg Development Authority (YDA) government of Jammu and Kashmir, for cooperating with researchers for data collection. I take this opportunity to express my sincere regards to the teachers of P. G. Department of environmental Science, who have been a source of constant encouragement and intellectual support for me. I think myself extremely fortunate to be a student of the exemplary teachers at the department. In this regard, I deeply acknowledge the guidance and insight observations of Dr. Arshid Jehngir, Dr. Mudasir Ali who took deep interest and utmost care while this research was taking shape. Authors acknowledge the immense help received from the scholars whose articles are cited and included in references of this manuscript. The authors are also grateful to authors / editors / publishers of all those articles, journals and books from where the literature for this article has been reviewed and discussed.
References:
1. Arora, R.K. 1995. Himalayan Resources, Diversity and Conservation. In: U.Dhar (ed.), Himalayan Biodiversity. Gyanodaya Prakashan, Nainital 2: 39-55.
2. Bhandari, B.S. and Tiwari, S.C. 1997. Dominance and diversity along an altitudinal gradient in a montane forest of Garhwal Himalaya. Proc. Indian National SciencAcademy. B 64: 437-446.
3. Bhandari, B.S.,D.C. Nautiyal and R. D. Gaur, 1999. Structural attributes and Productivity potential of an alpine Pasture of Garhwal Himalaya. J.Ind. Bot. Soc., 78:321- 329.
4. Curtis, J.T., 1959. The Vegetation of Wisconsin. An Ordination of Plant Communities.Univ.Wisconsin press, Madison, Wisconsin, pp:657.
5. Curtis JT , McIntosh RP (1950). The interrelations of certain analytic and synthetic phytosociological characters. Ecology, 31: 438-455.
6. Fernandez MD, Pieters A, Donoso C, Herrera C, Tezara W, Rengifo E, Herrera A (1999) Seasonal changesin photosynthesis of trees in the flooded forest of the Mapire River. Tree Physiol 19:79–85.
7. Ilorkar, V.M. and Khatri, P.K. 2003. Phytosociological study of Navegaon National Park (Maharashtra). Indian For., 129: 377-387.
8. Jackson MB, Colmer TD (2005) Response and adaptation by plants to flooding stress. Ann Bot (Oxford)96:501–505.
9. Kershaw KK. 1973. Quantitative and Dynamic Plant Ecology. (2nd edition). London: FLBS and Edwards Arnold (Publ.) Ltd., p. 308.
10. K. J. Gaston, 2000. ?Global palterns in biodiversity,? Nature; 405 : 220-227.
11. Misra, R. 1968. Ecology Work Book. Oxford and IBH Publishing, New Delhi.
12. Nunes da Cunha C, Junk WJ (2001) Distribution of woody plant communities along the flood gradient in the Pantanal of Poconé, Mato Grosso, Brazil. International Journal of Ecology and Environmental Science 27:63–70.
13. Odum E.P. 1971. Fundamentals of Ecology, 3rd edition.
14. Parolin P, De Simone O, Haase K, Waldhoff D, Rottenberger S, Kuhn U, Kesselmeier J, Kleiss B, Schmidt W, Piedade MTF, Junk WJ (2004) Central Amazon floodplain forests: tree adaptation in a pulsing system. The Bot Rev 70:357–380.
15. Rahbek, C., 1997. The relationship among area, elevation and regional species richness in Neotropical birds. Am. Nat., 149, 875-902.
16. Singh, J. S and Singh ,S. P. 1987. Forest vegetation of the Himalaya; Bot. Rev. 52 80- 192.
17. Saxena, A.K. and Singh, J.S. 1982. A phytosociological analysis of woody species in forest communities of a part of Kumaun Himalaya. Vegetatio, 50: 3-32.
18. Singh, J.S and Yadav, P.S. 1974. Seasonal variation in composition of plant biomass and net primary productivity of tropical grassland of Kurukshetra, India. Ecological. Monograph, 44: 351-375.
19. Shannon, C. E. and Wiener, W. 1963. The Mathematical Theory of communication. University of lllinois press, Urbana. 117p.
20. Simpson, E. H. 1949. The Measurement of Diversity. Nature. 163-688.
21. Worbes M (1997) The forest ecosystem of the floodplains. In Junk WJ (ed) The Central Amazon floodplains. Ecology of a pulsing system. Springer Verlag Berlin, Heidelberg, New York, pp 223–266.


|
 IJCRR
IJCRR 


 This work is licensed under a Creative Commons Attribution-NonCommercial 4.0 International License


